Download to read offline
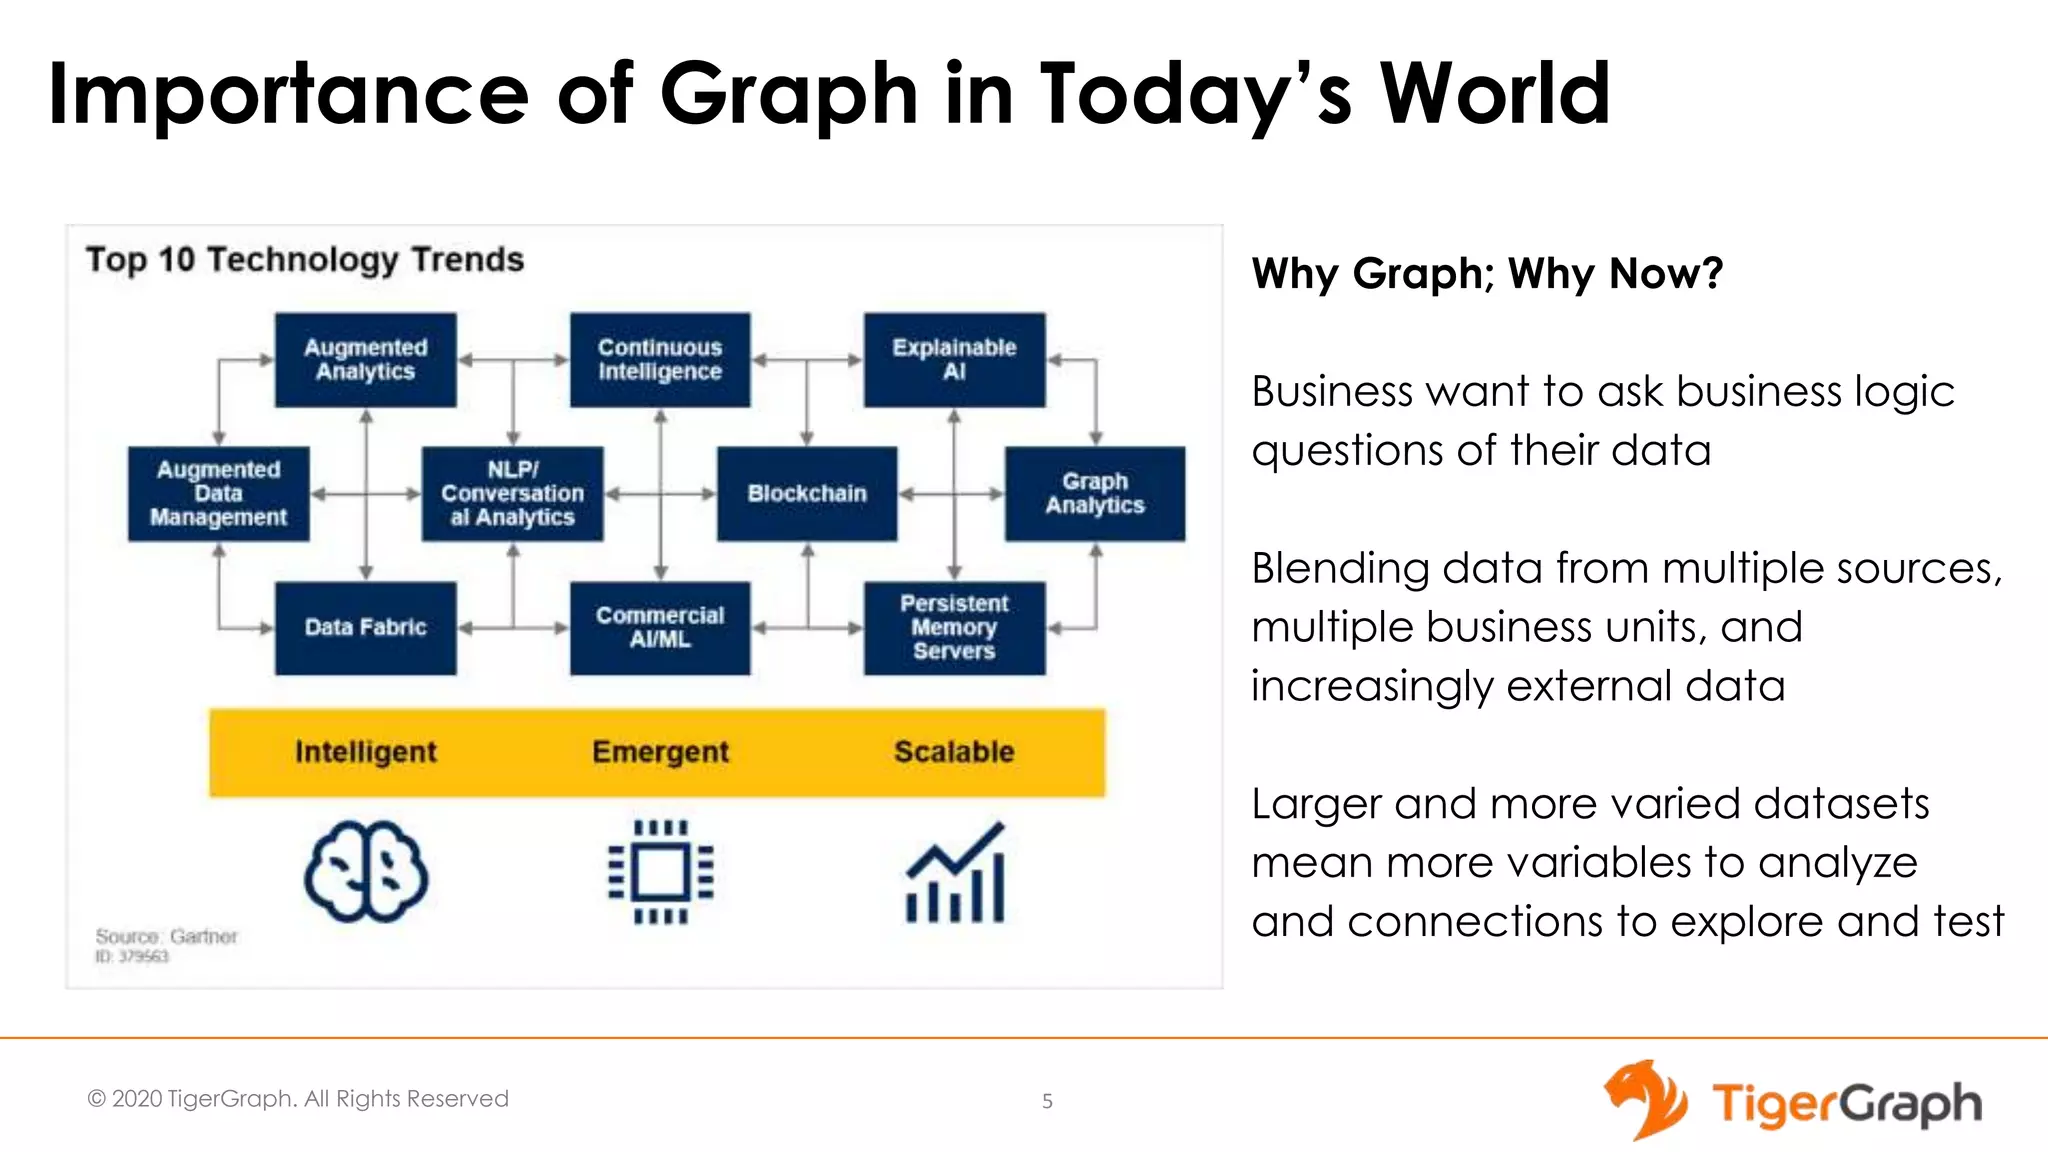
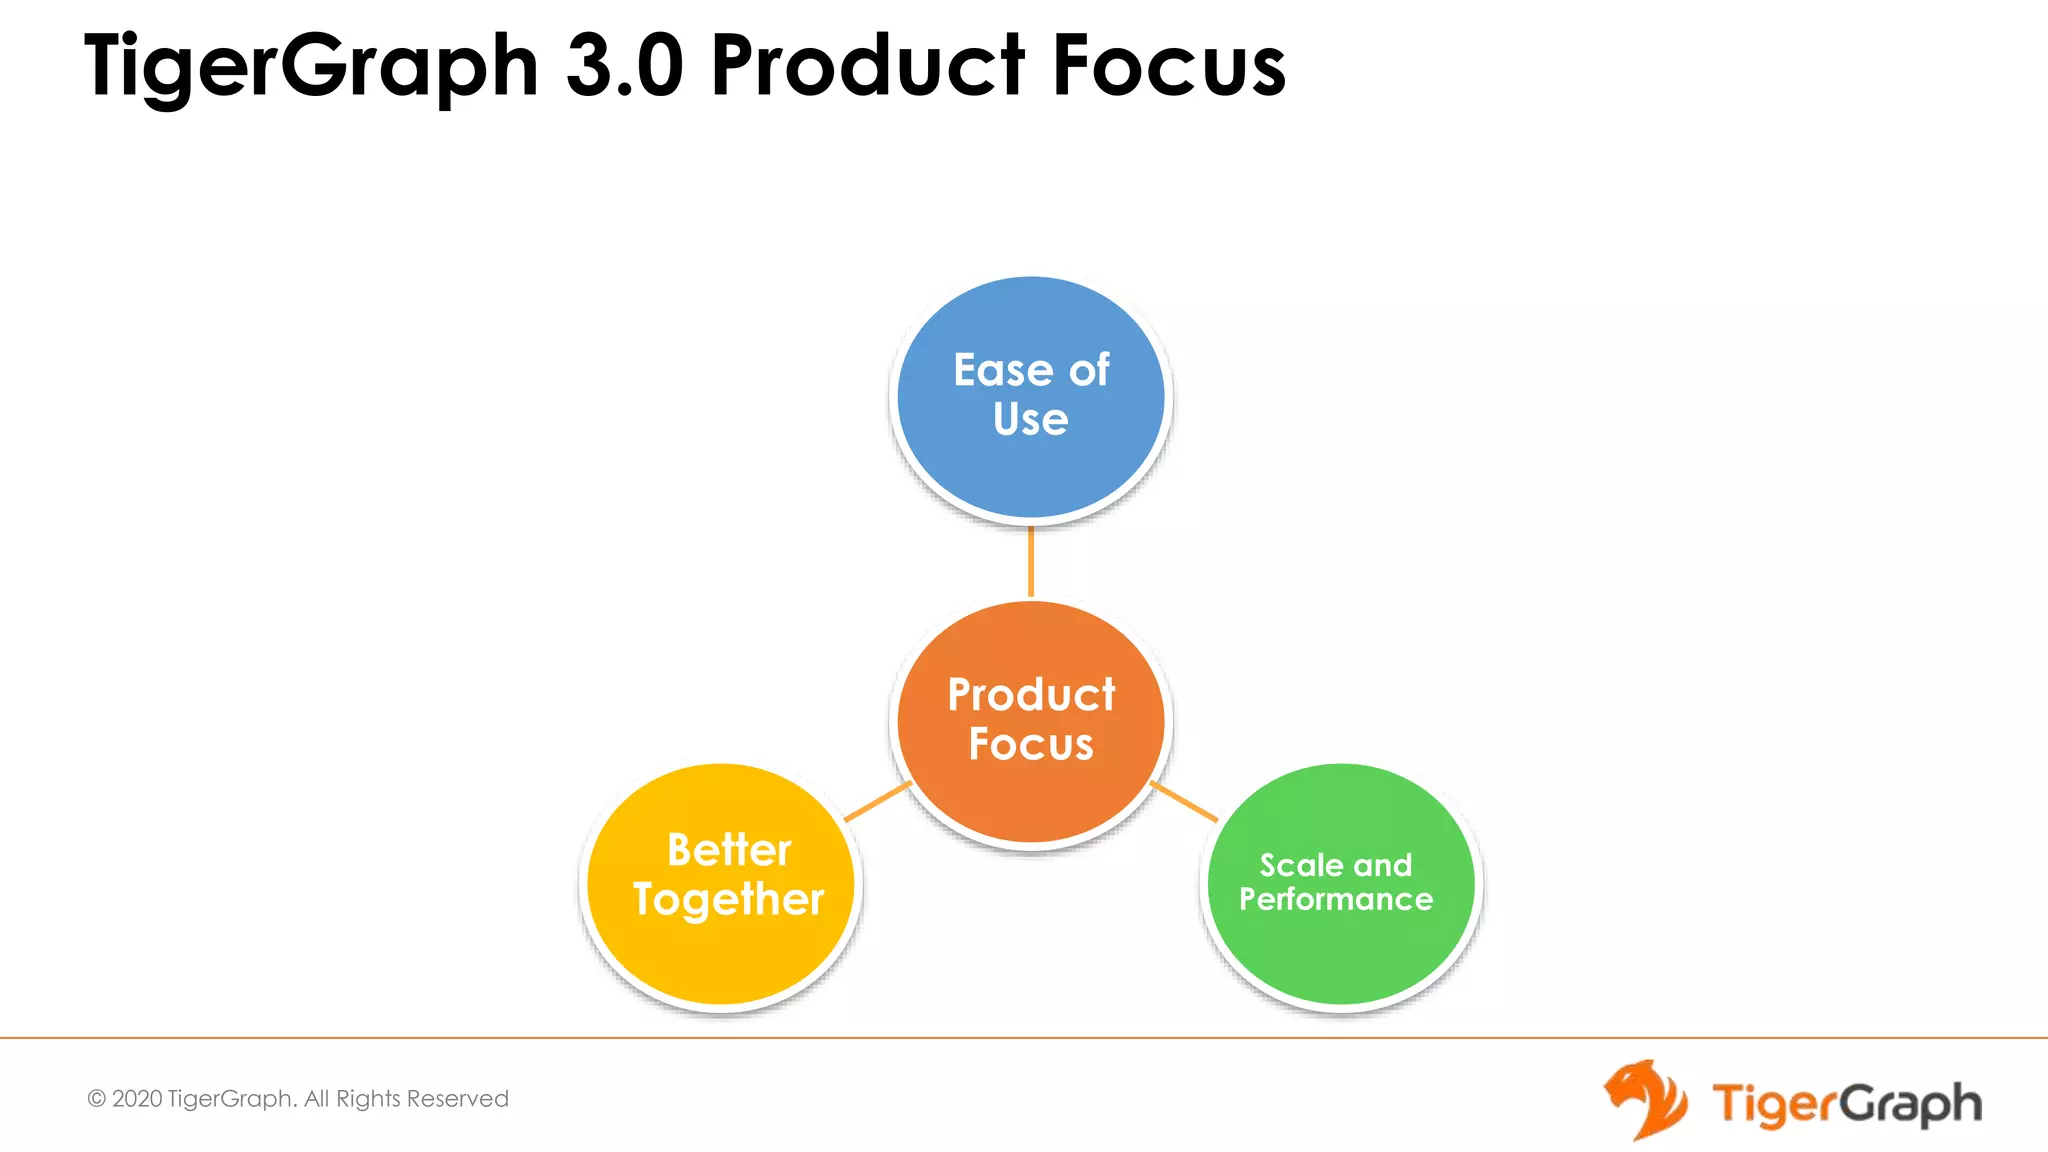
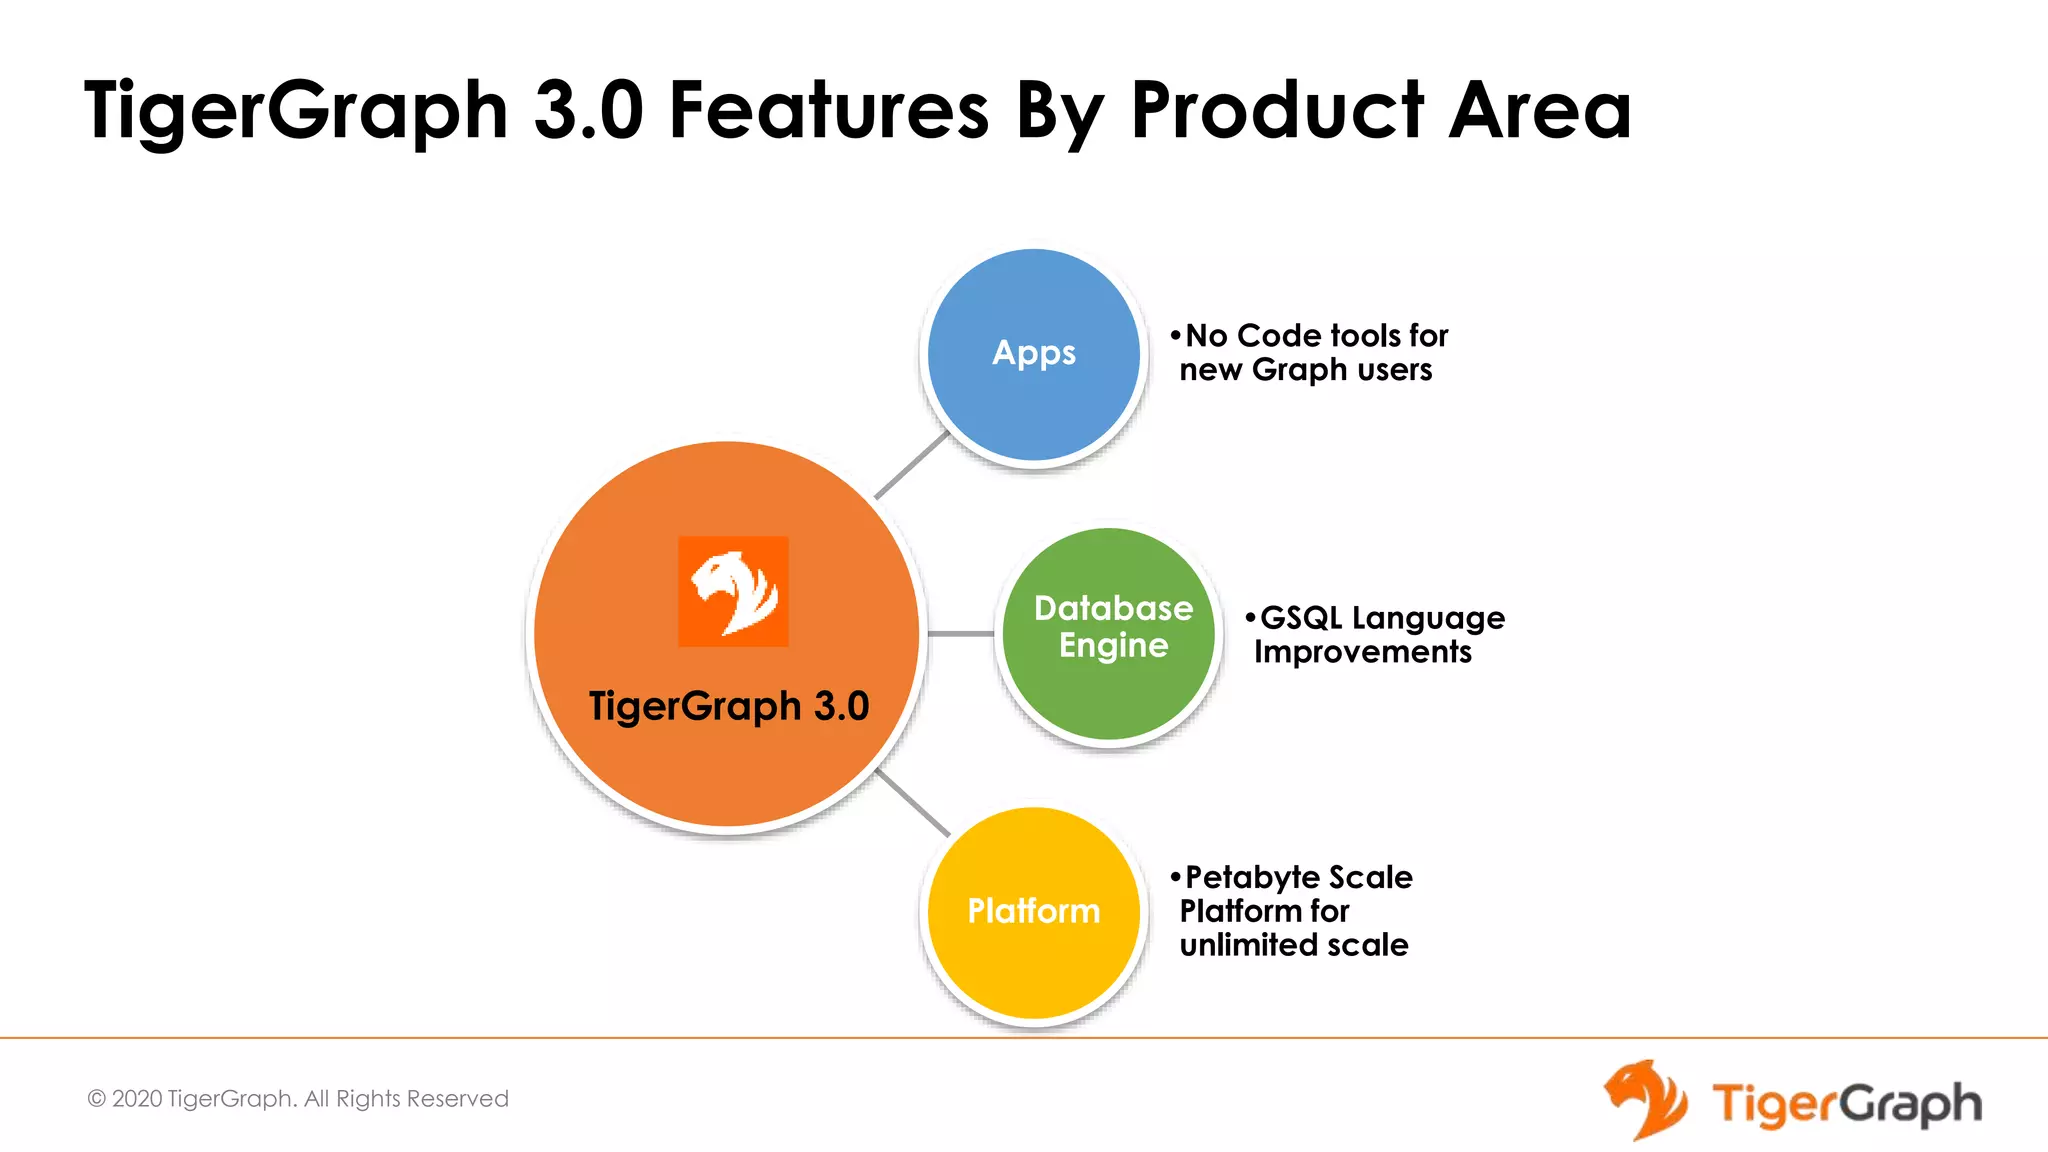
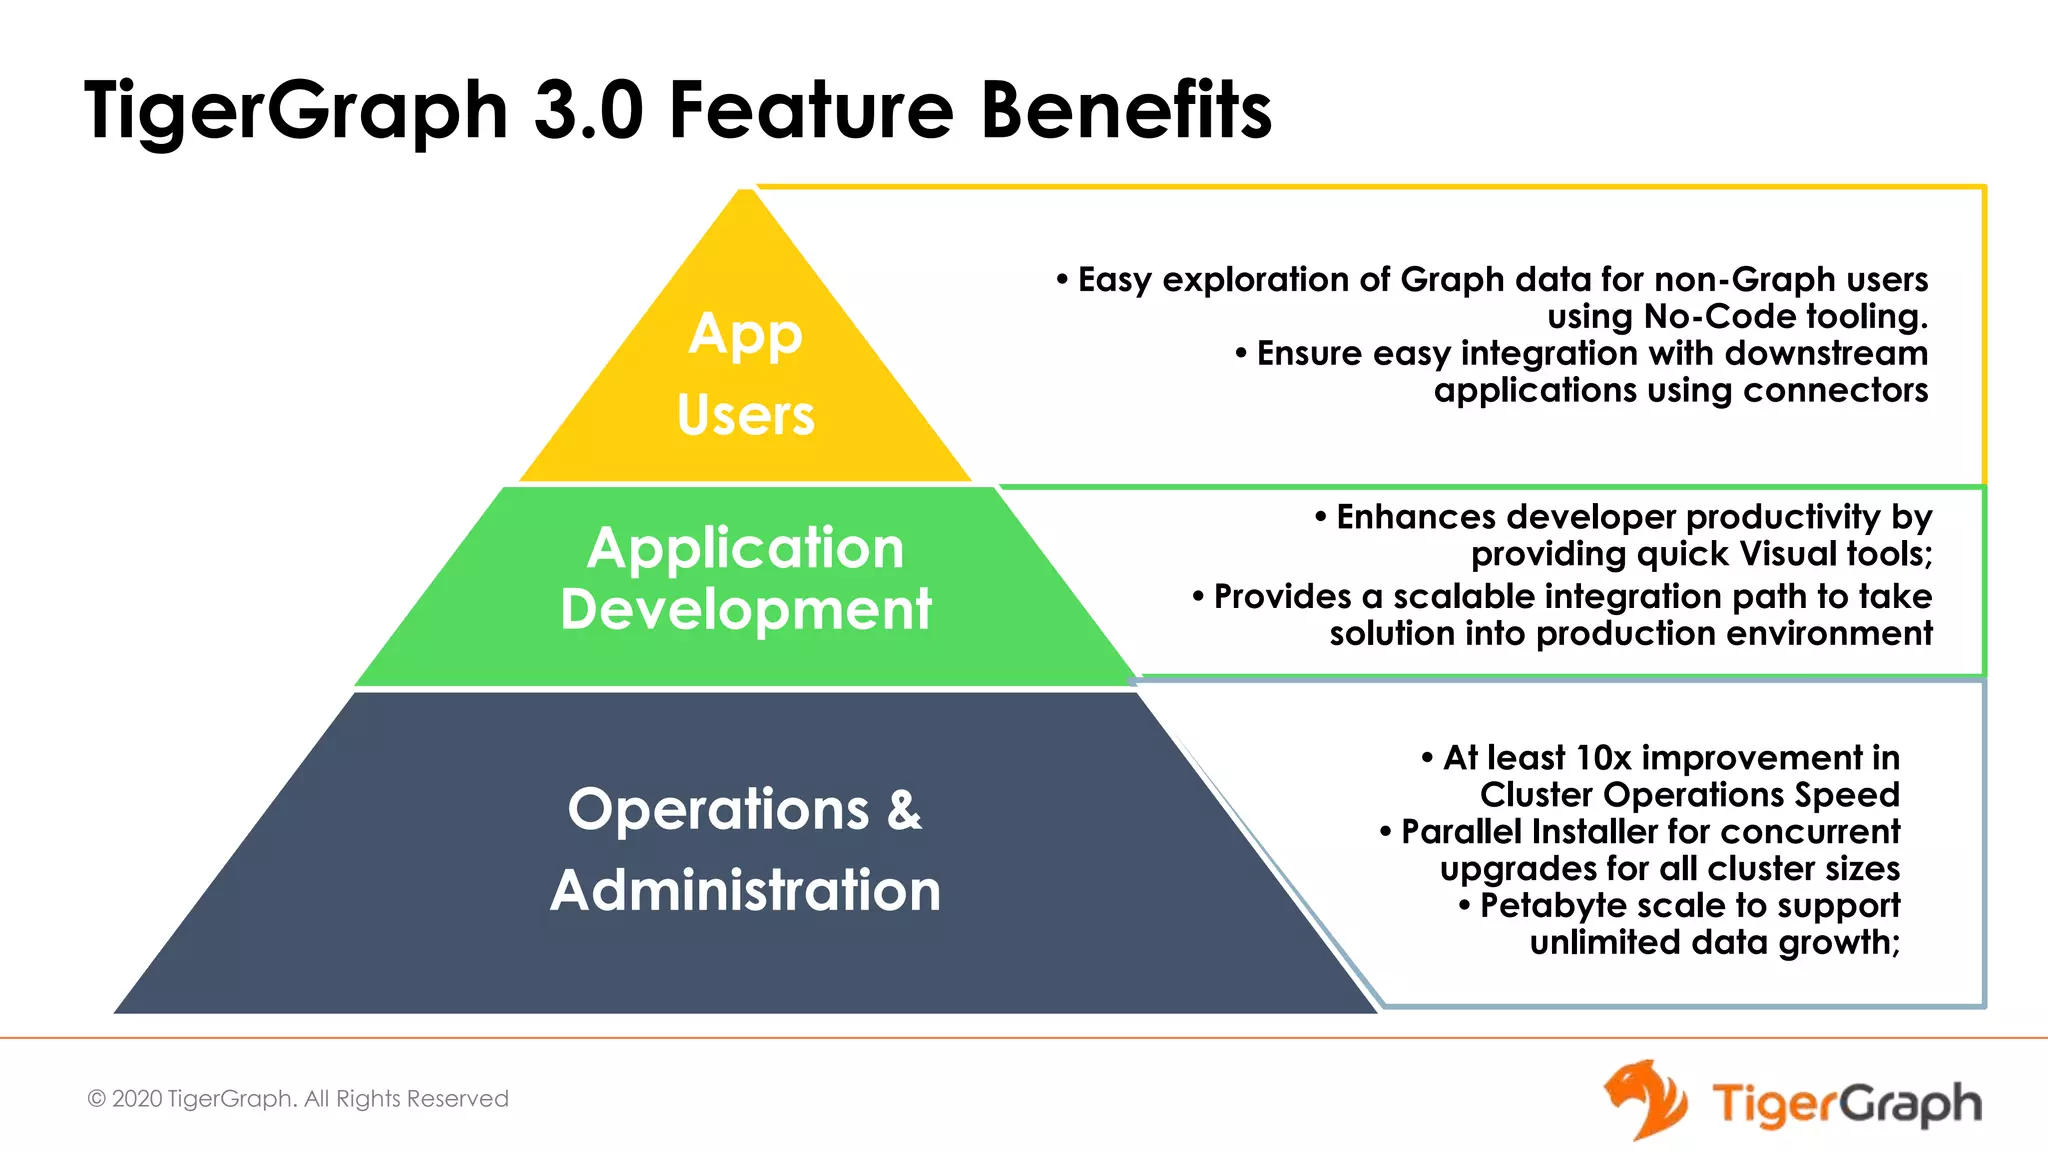
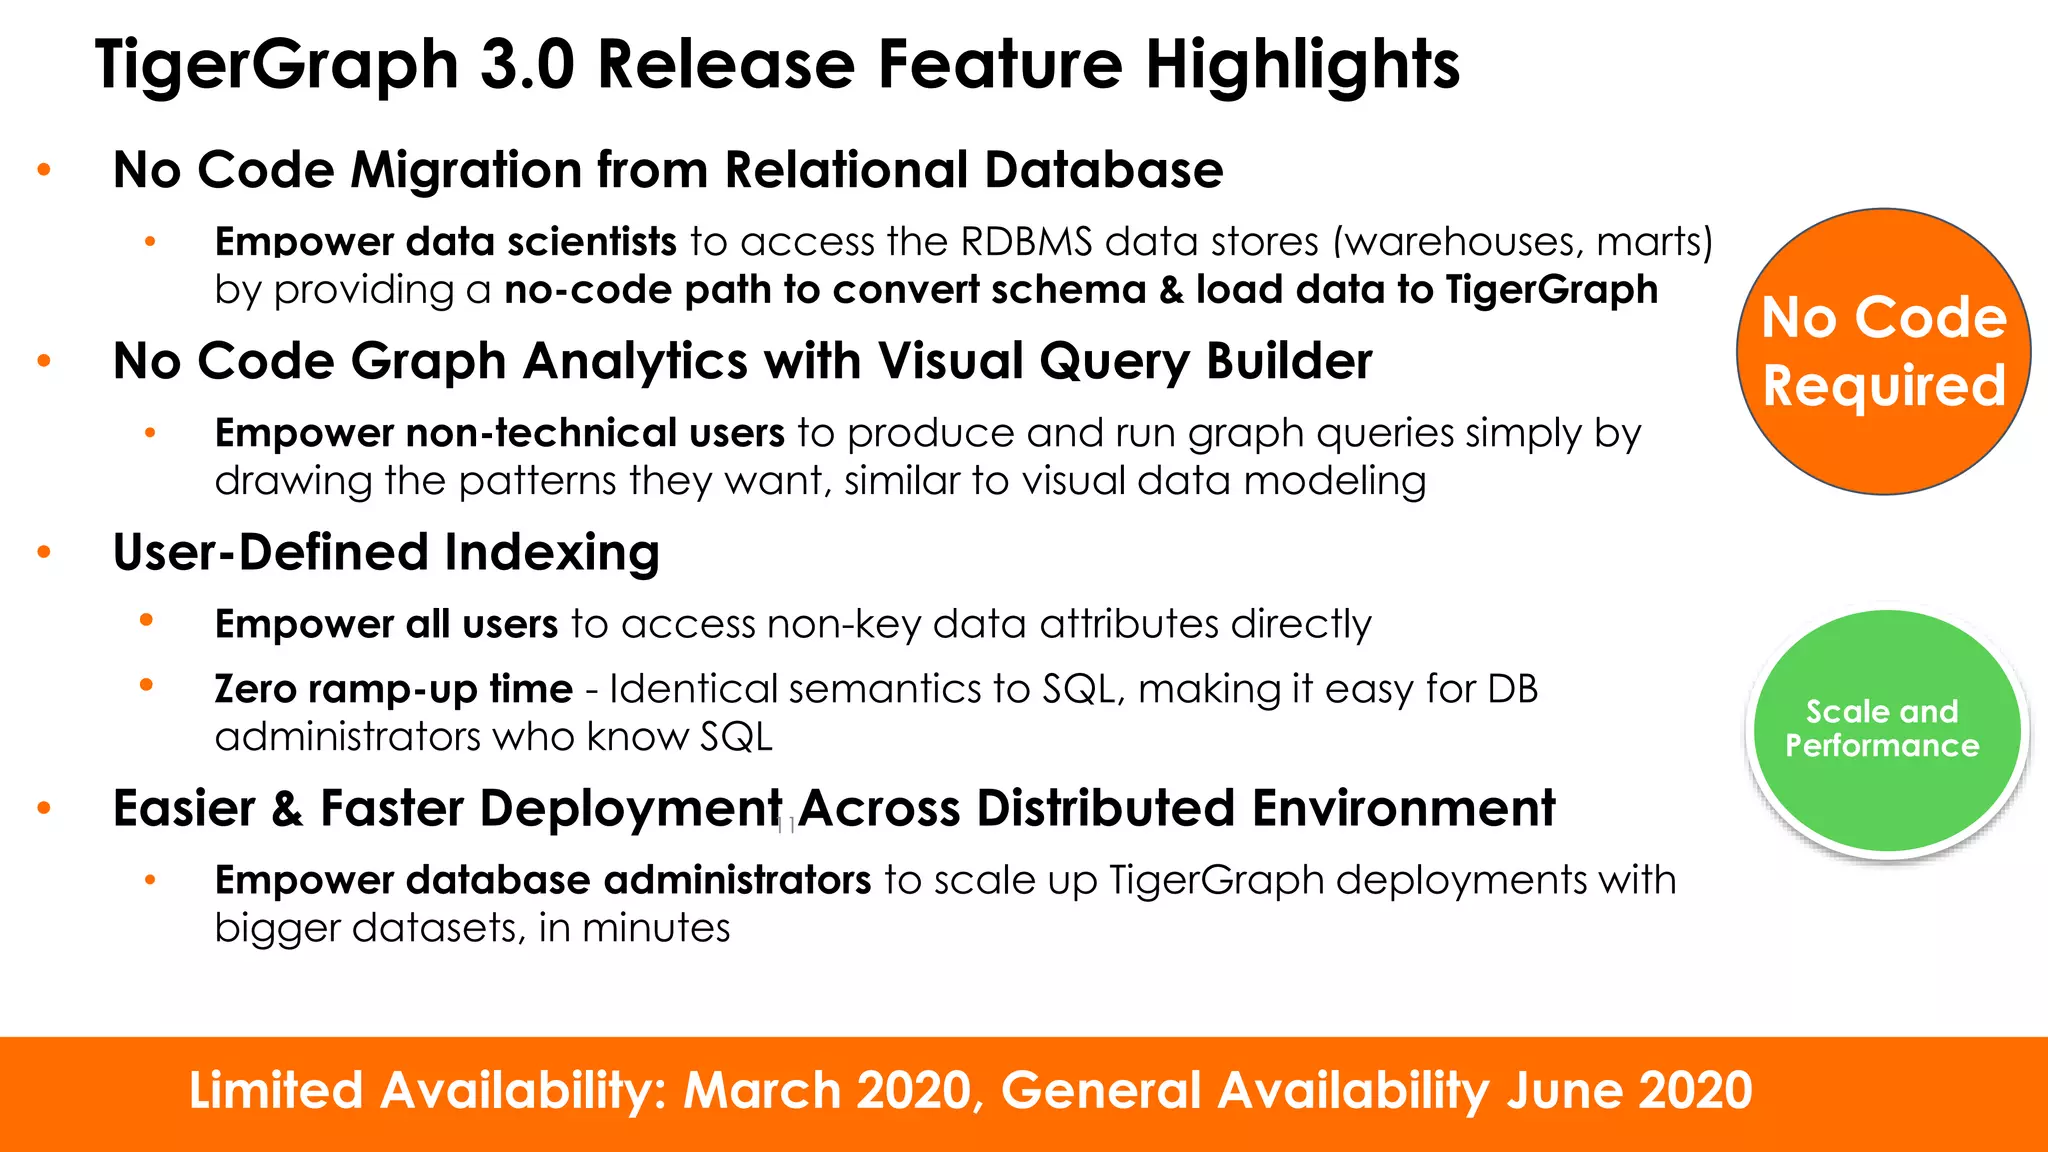
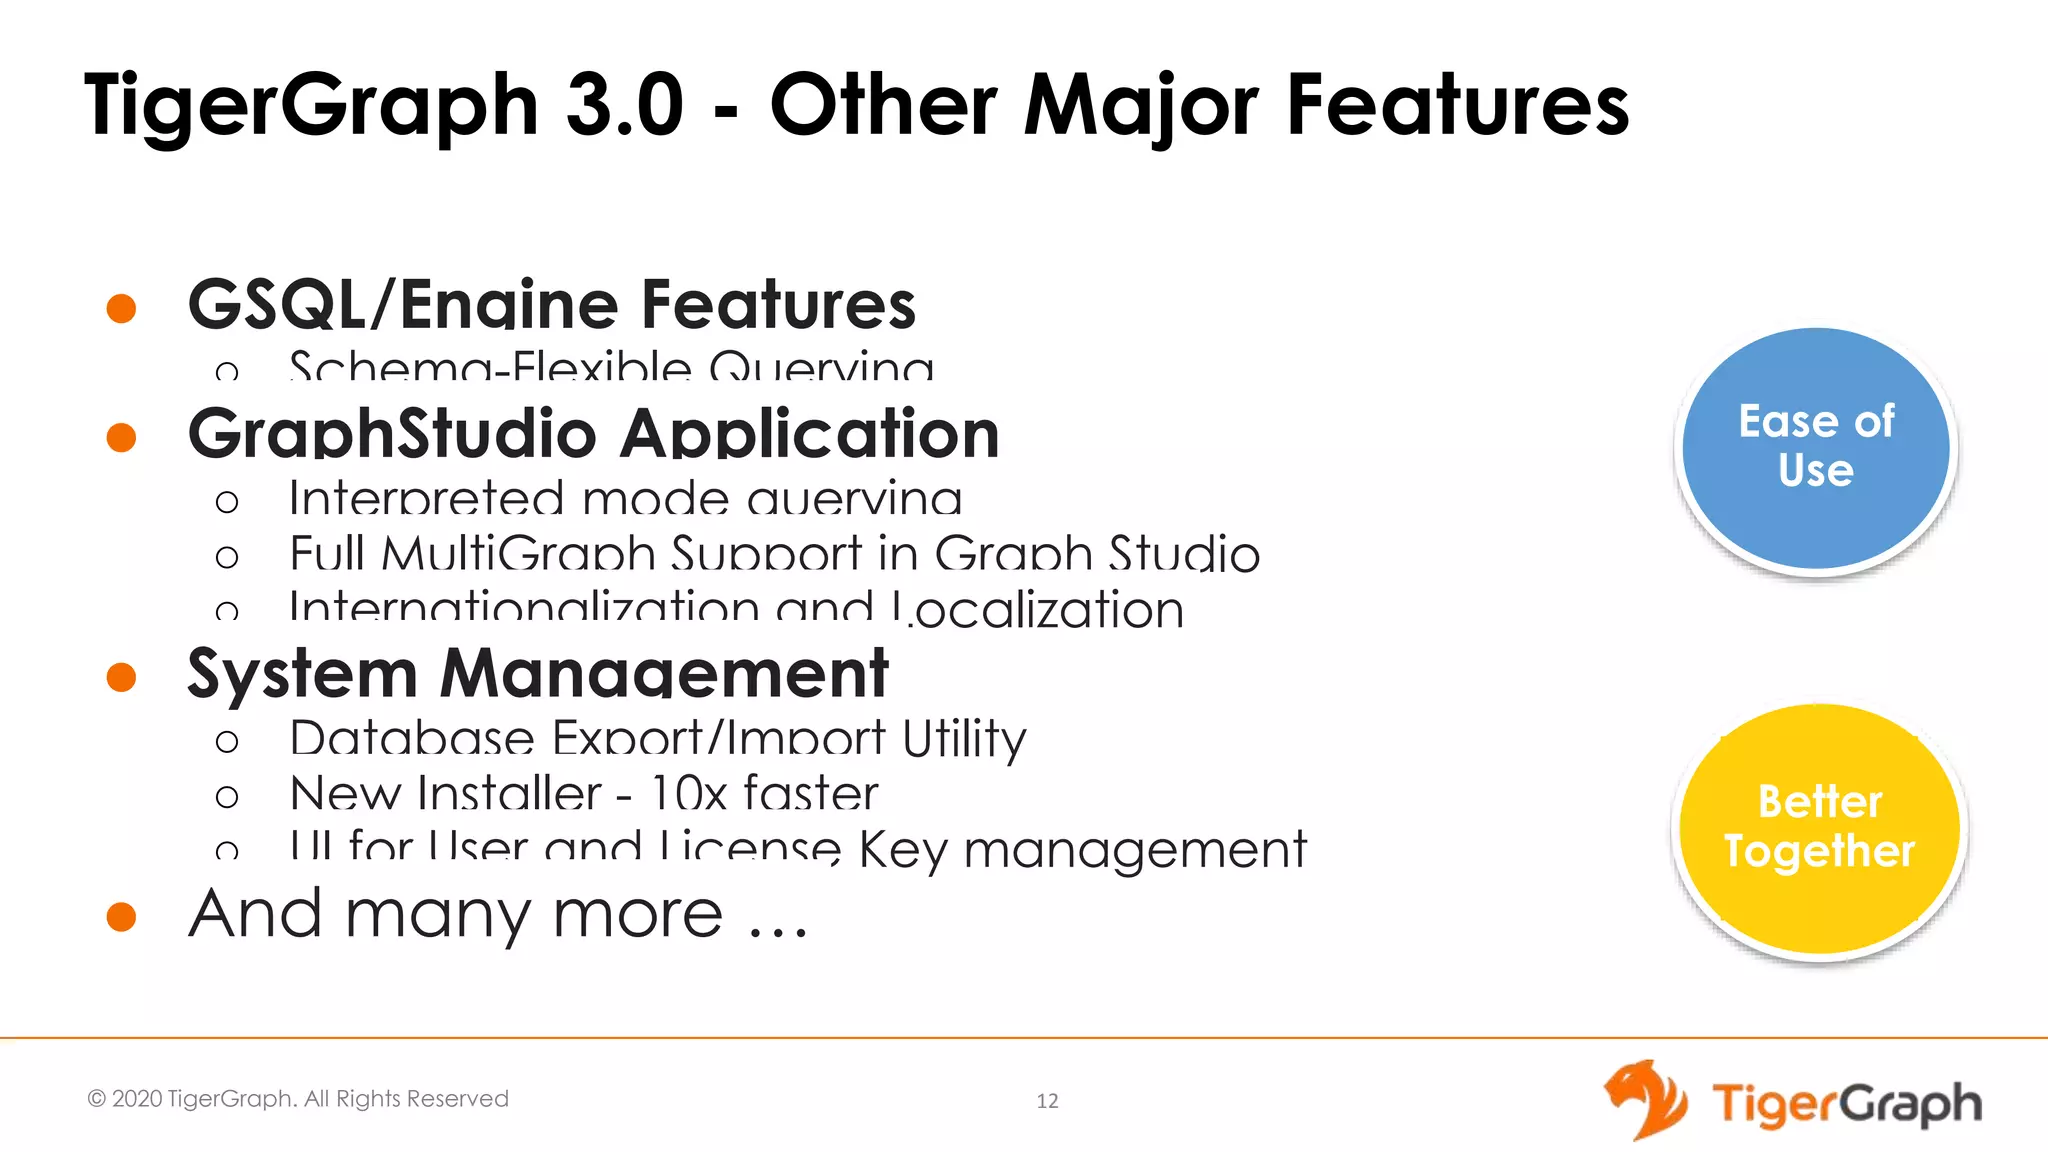
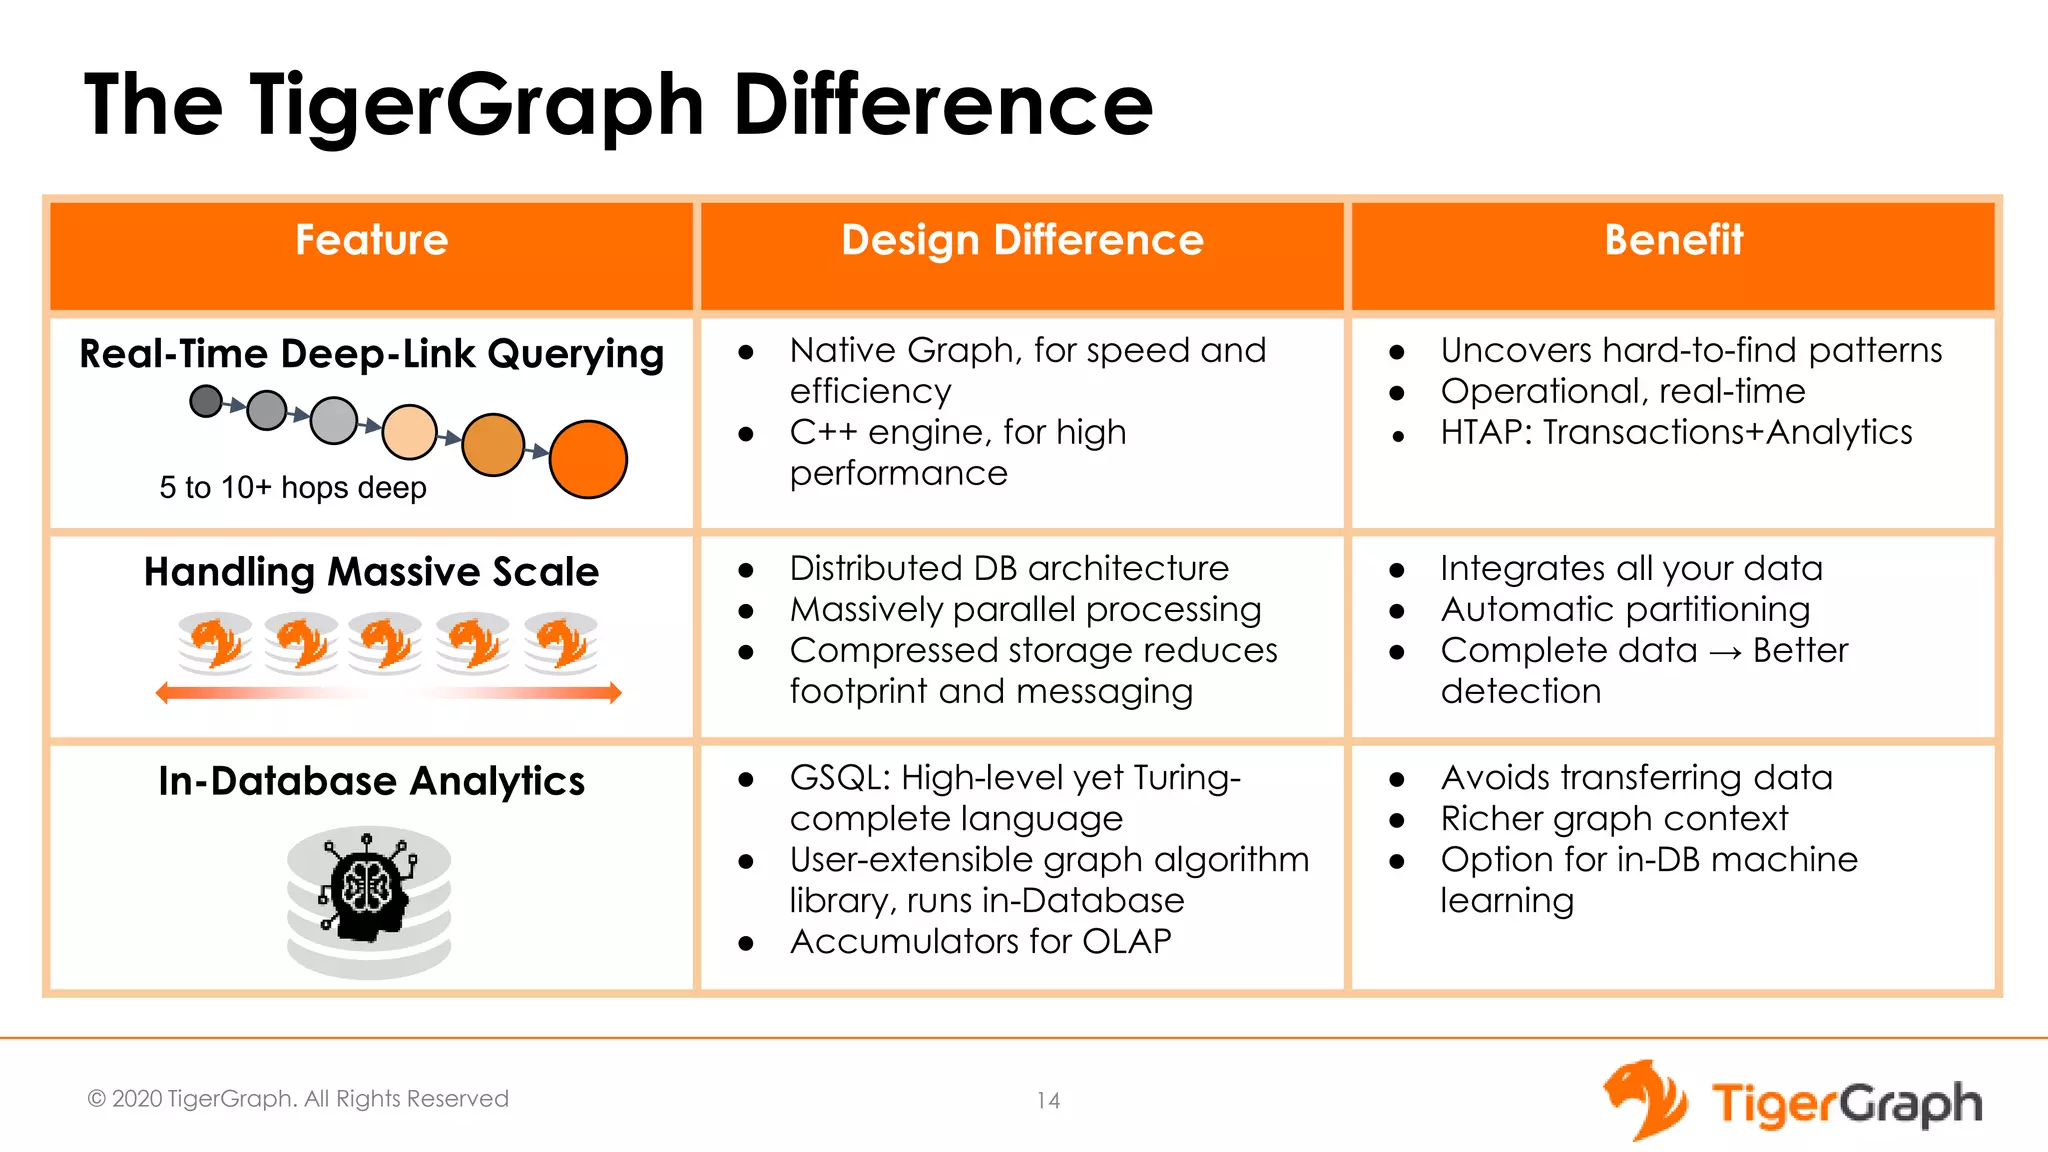

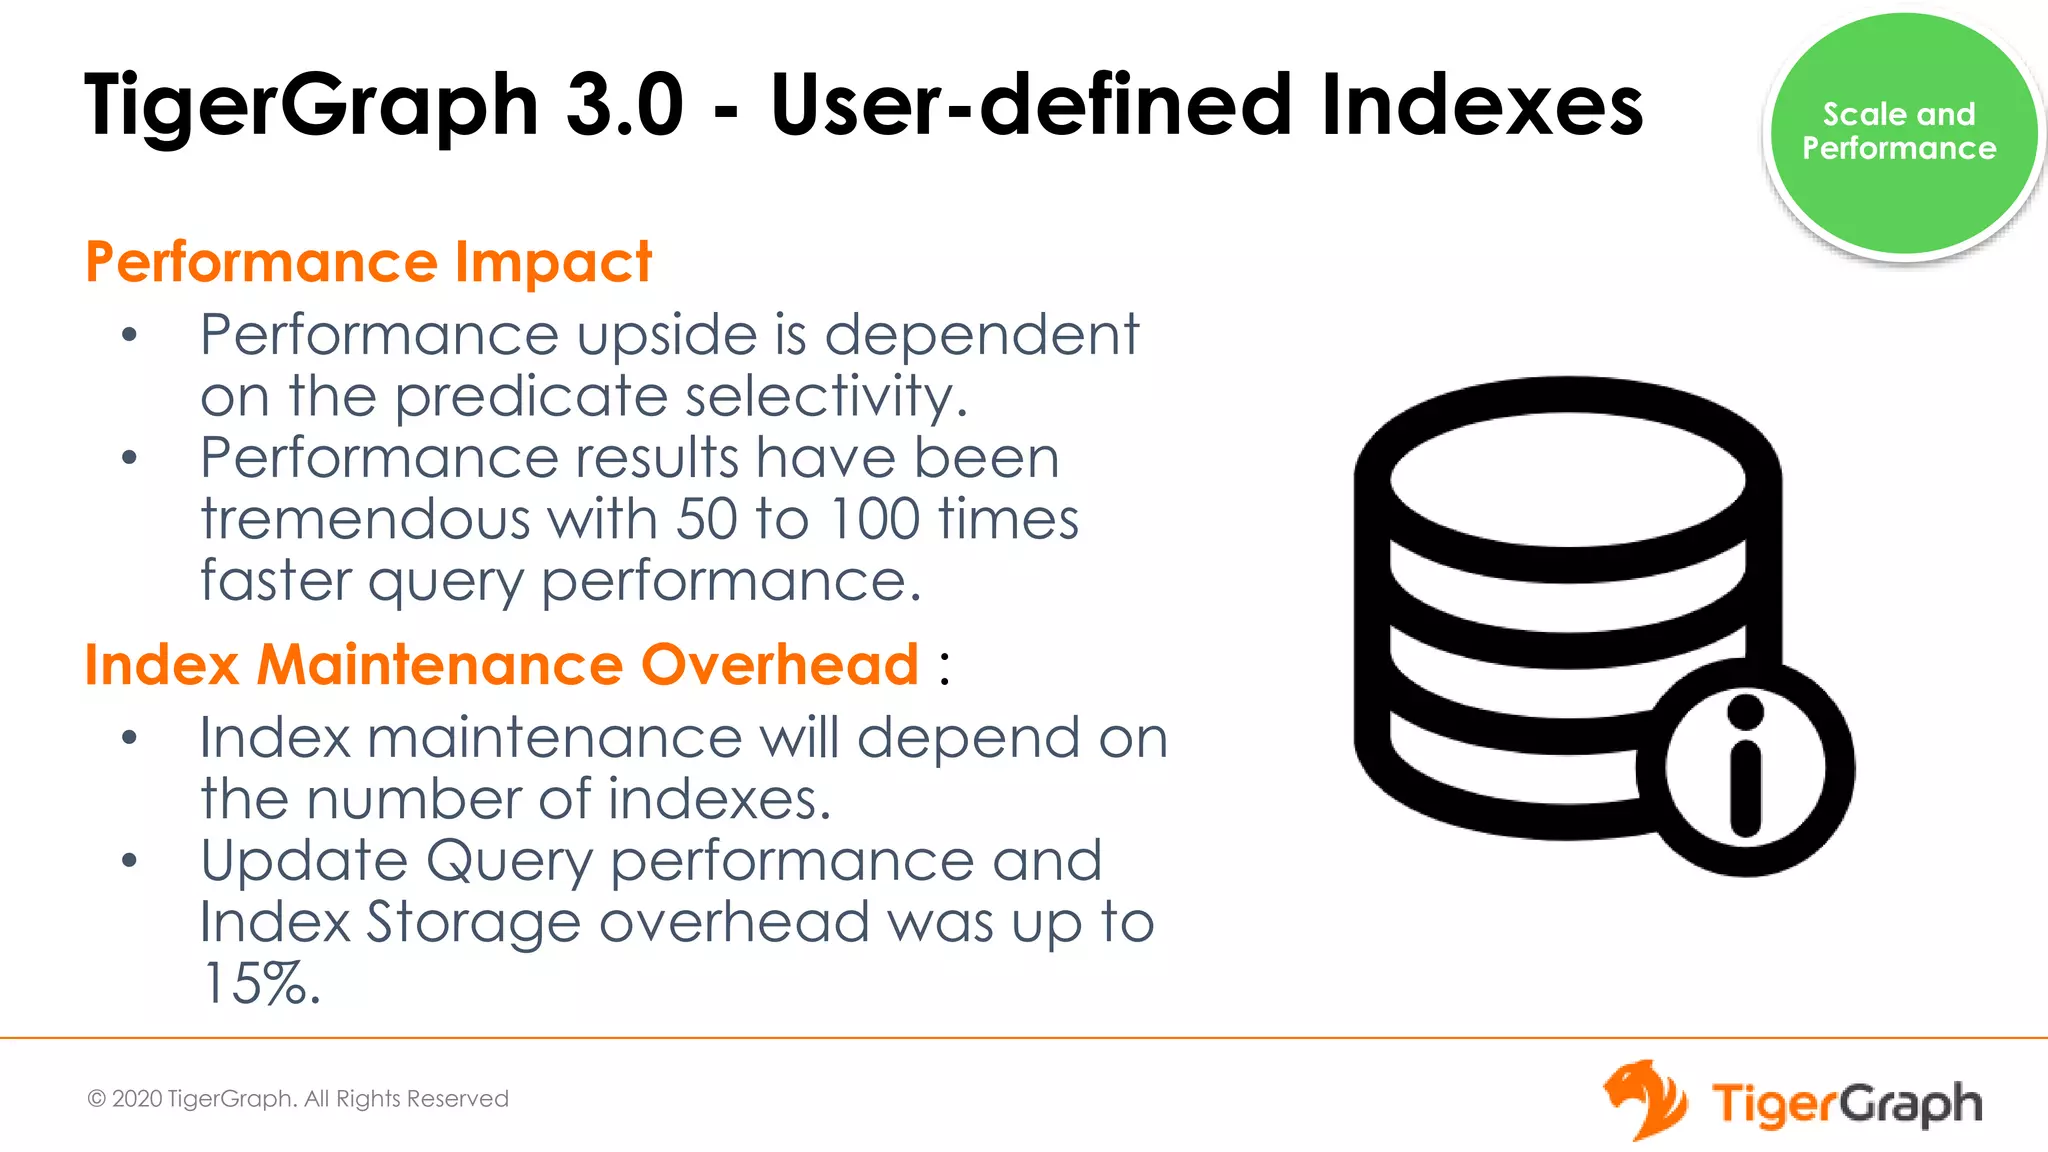
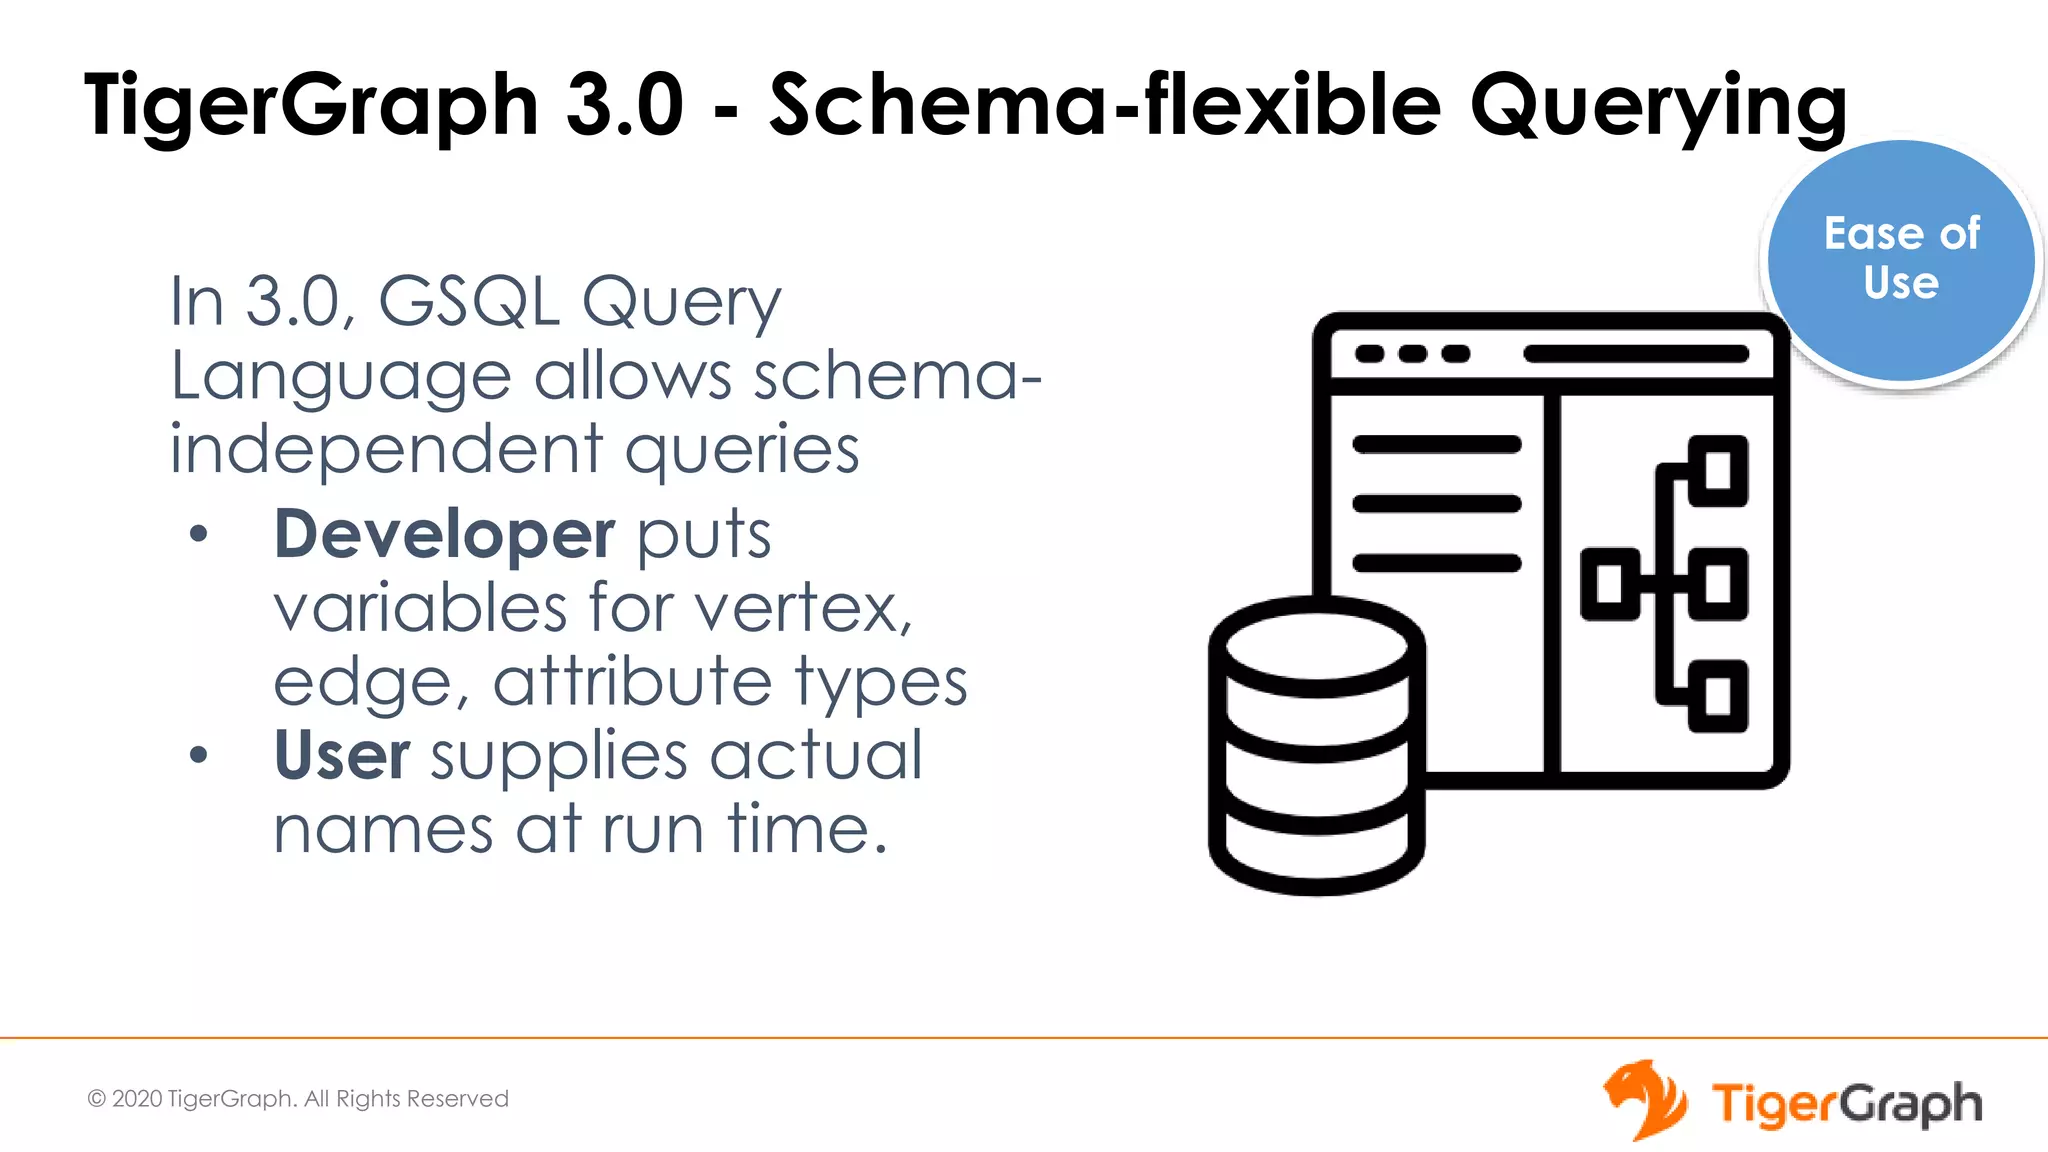
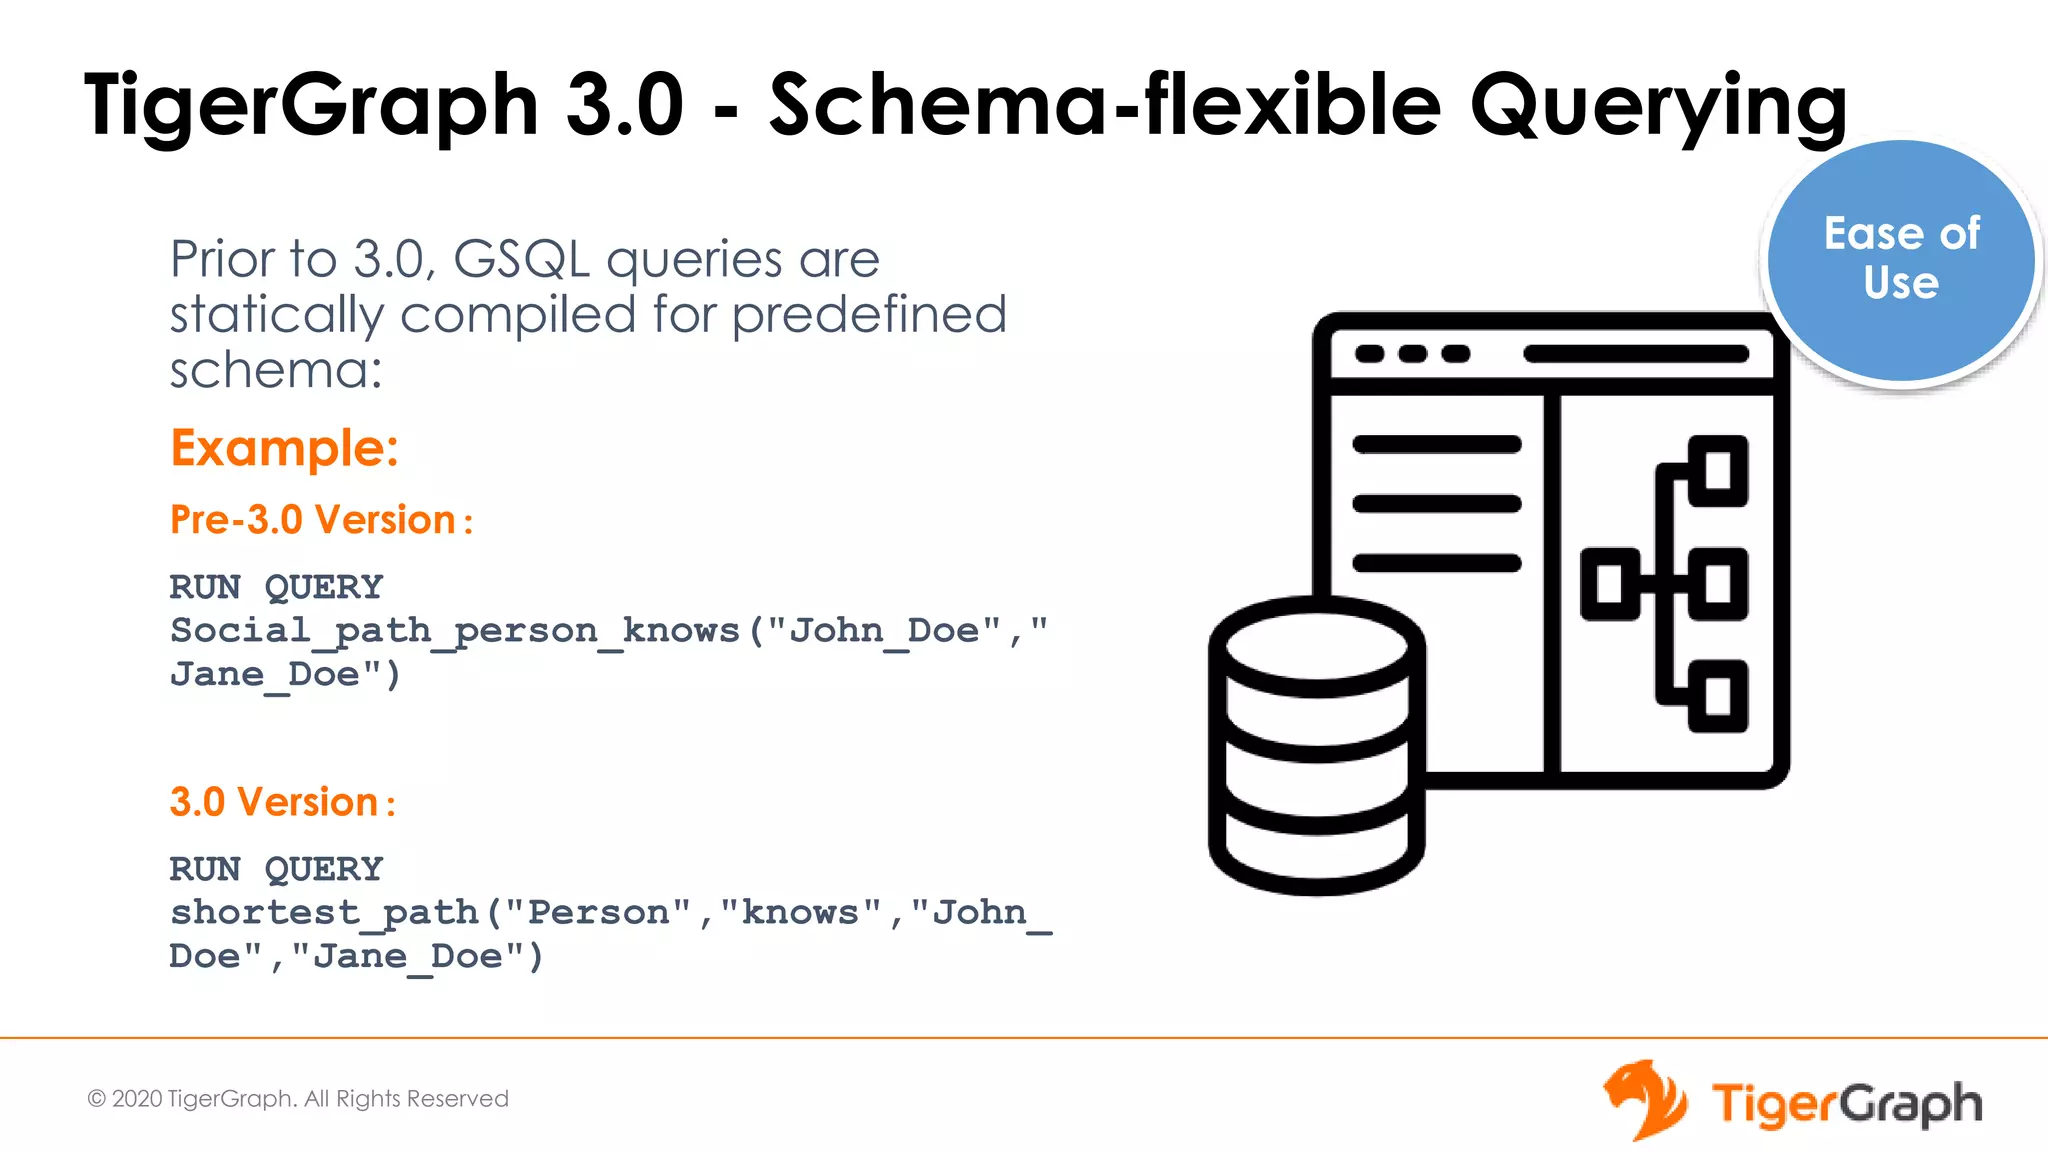
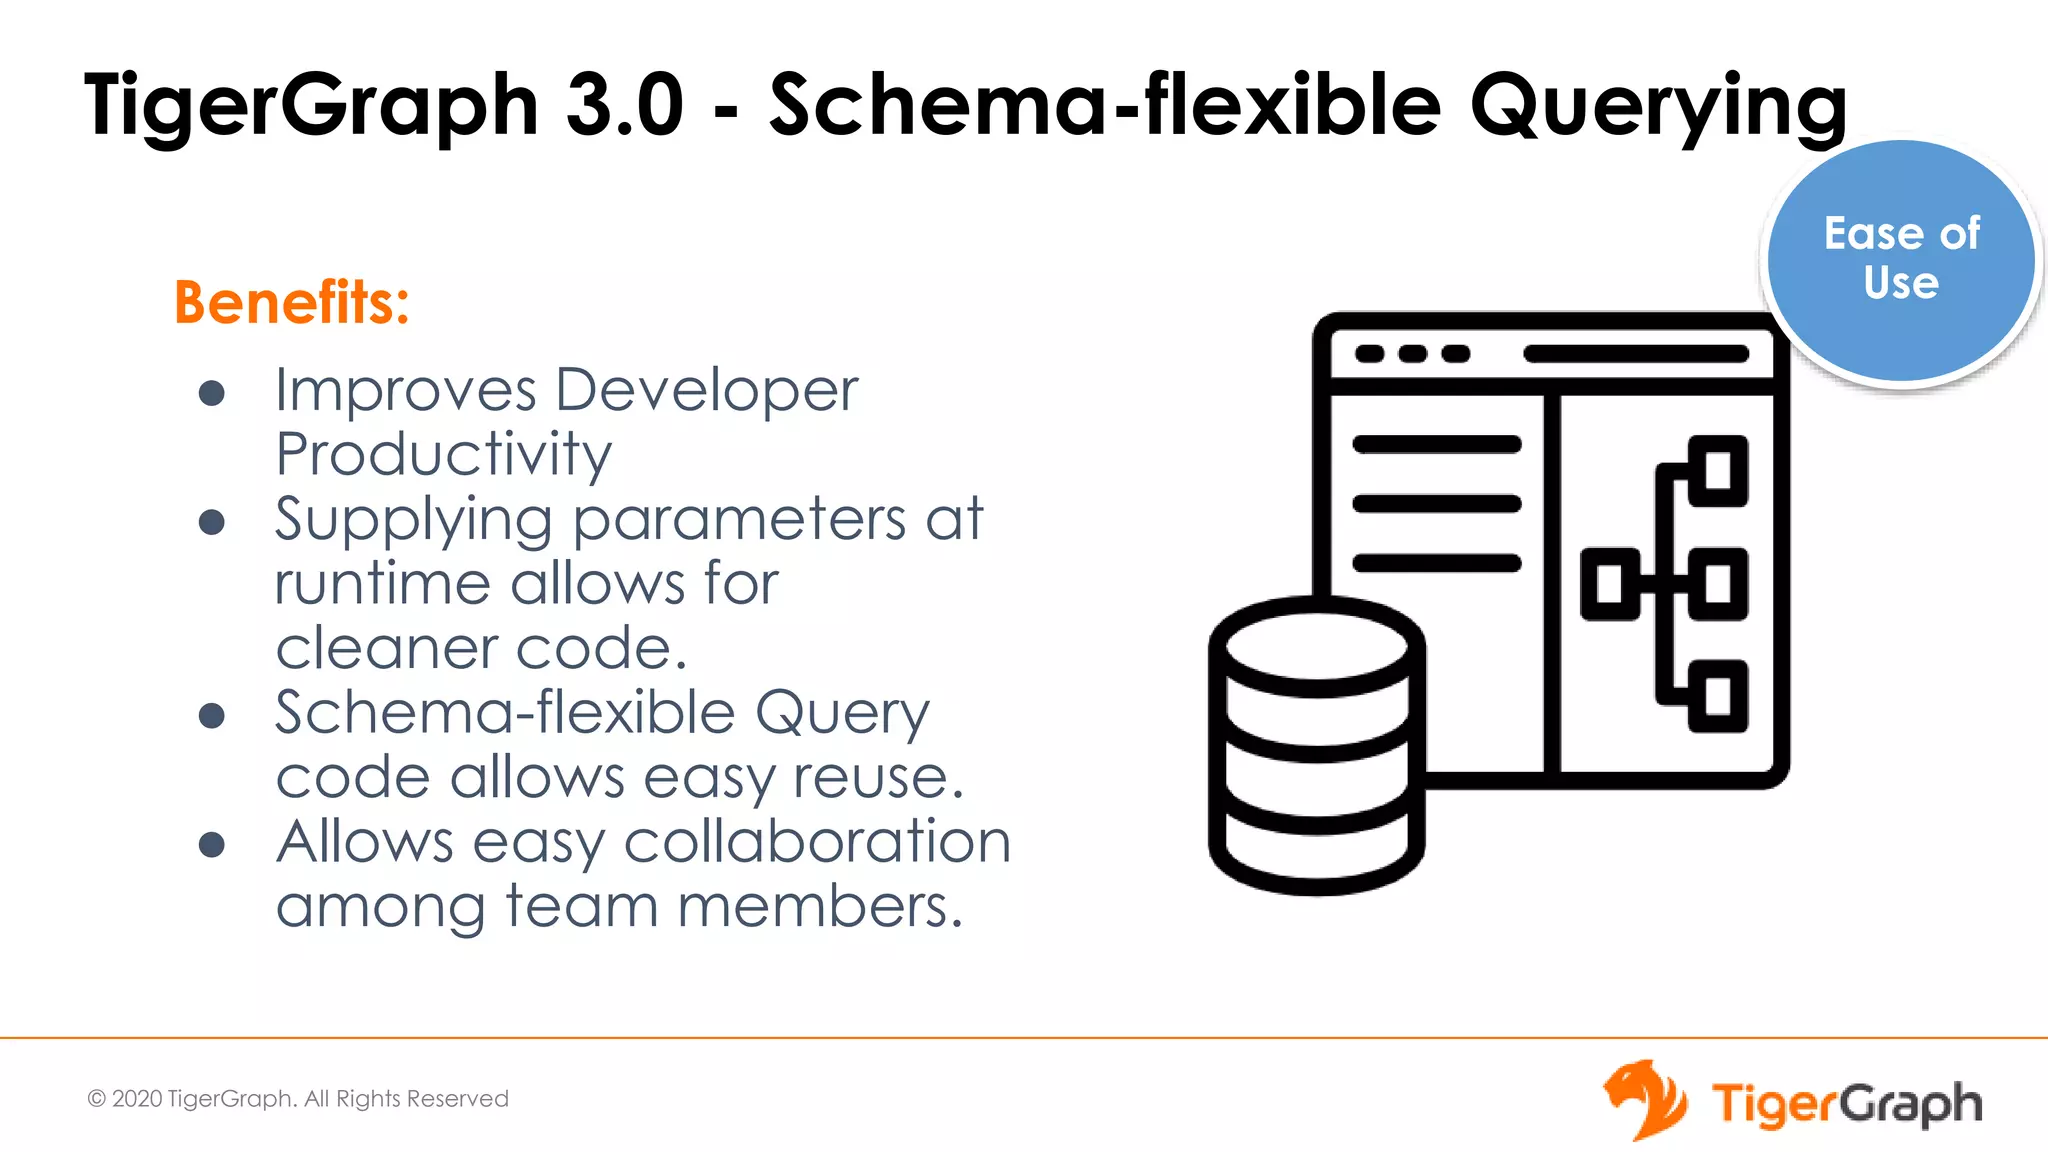
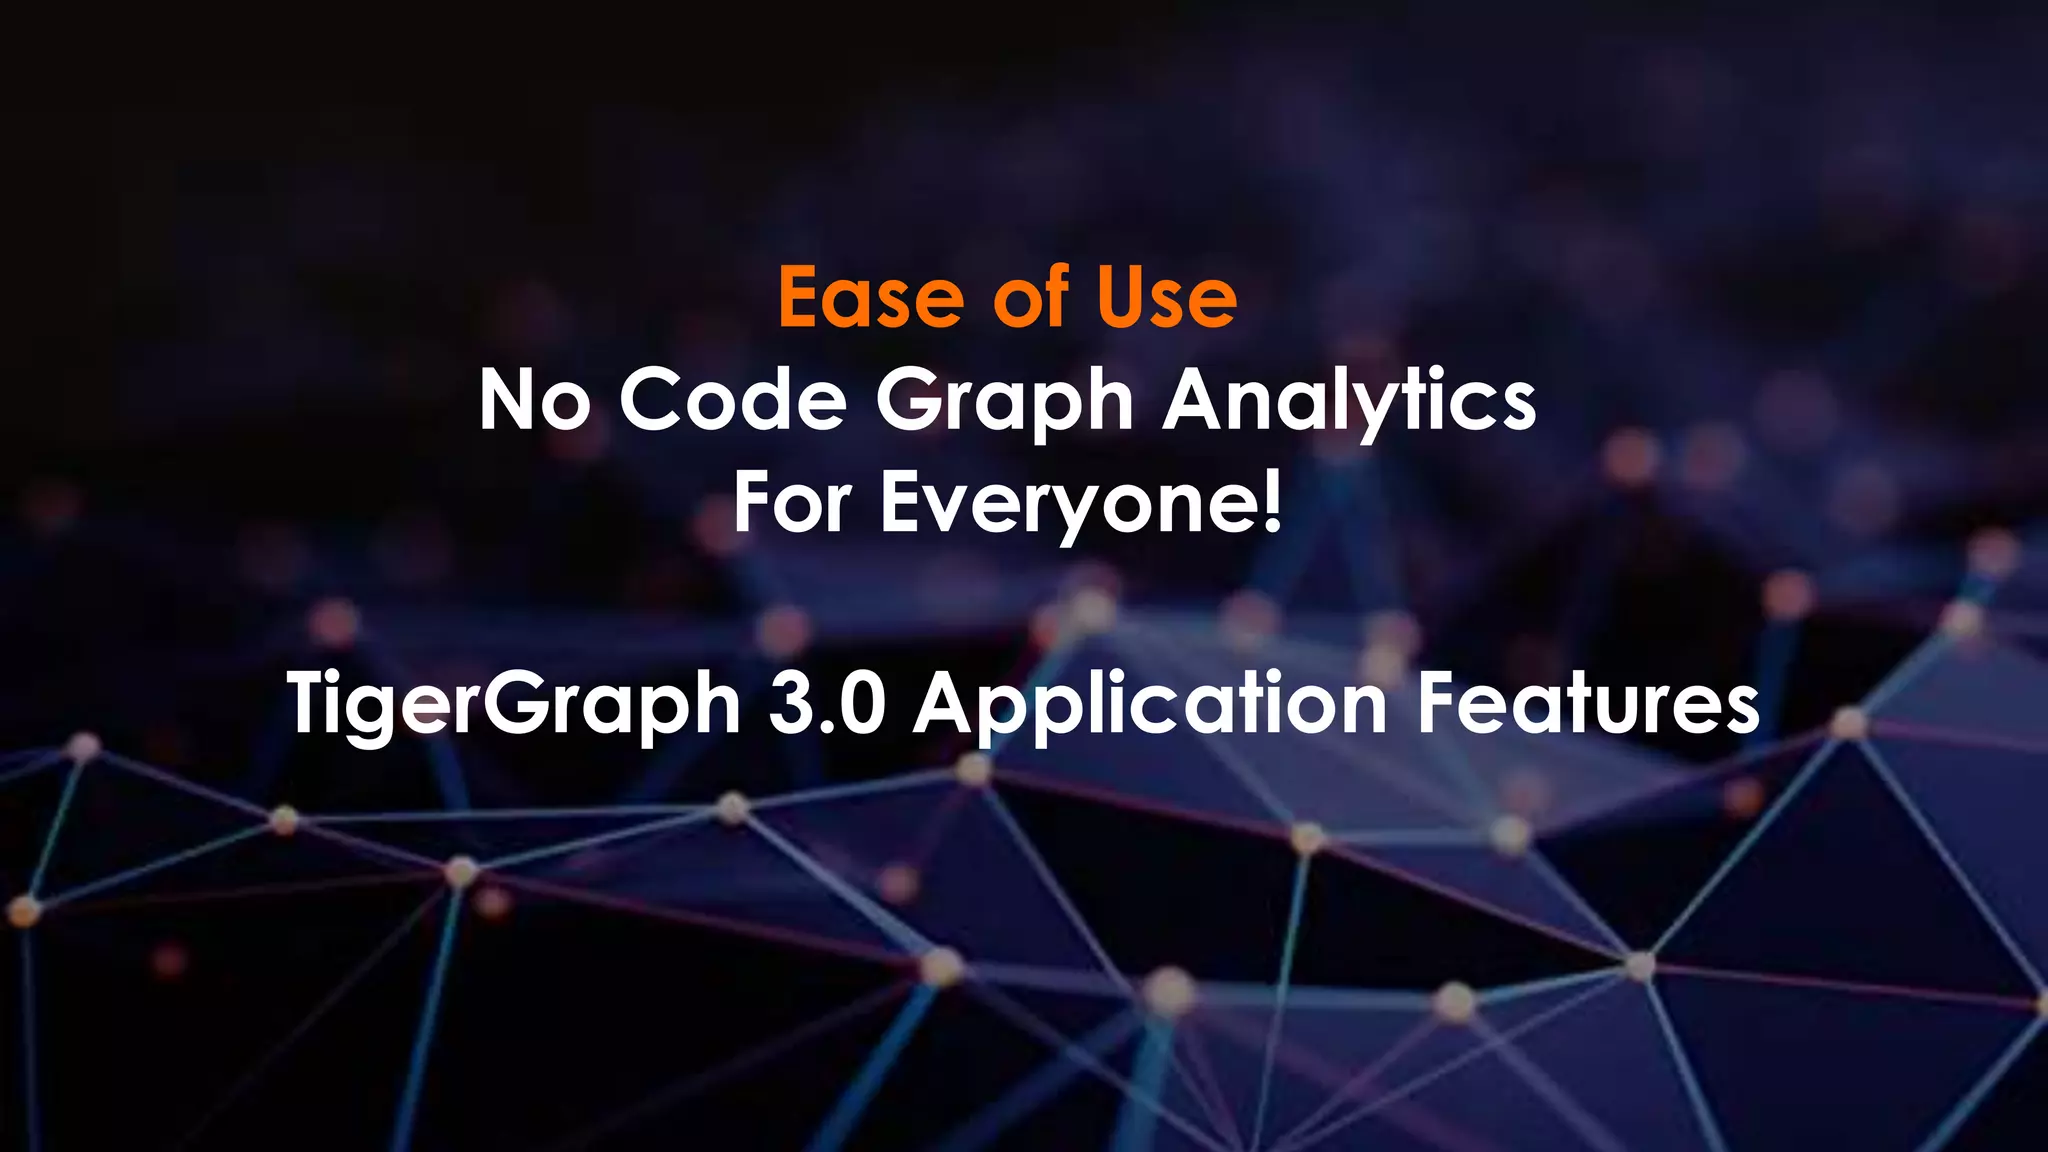
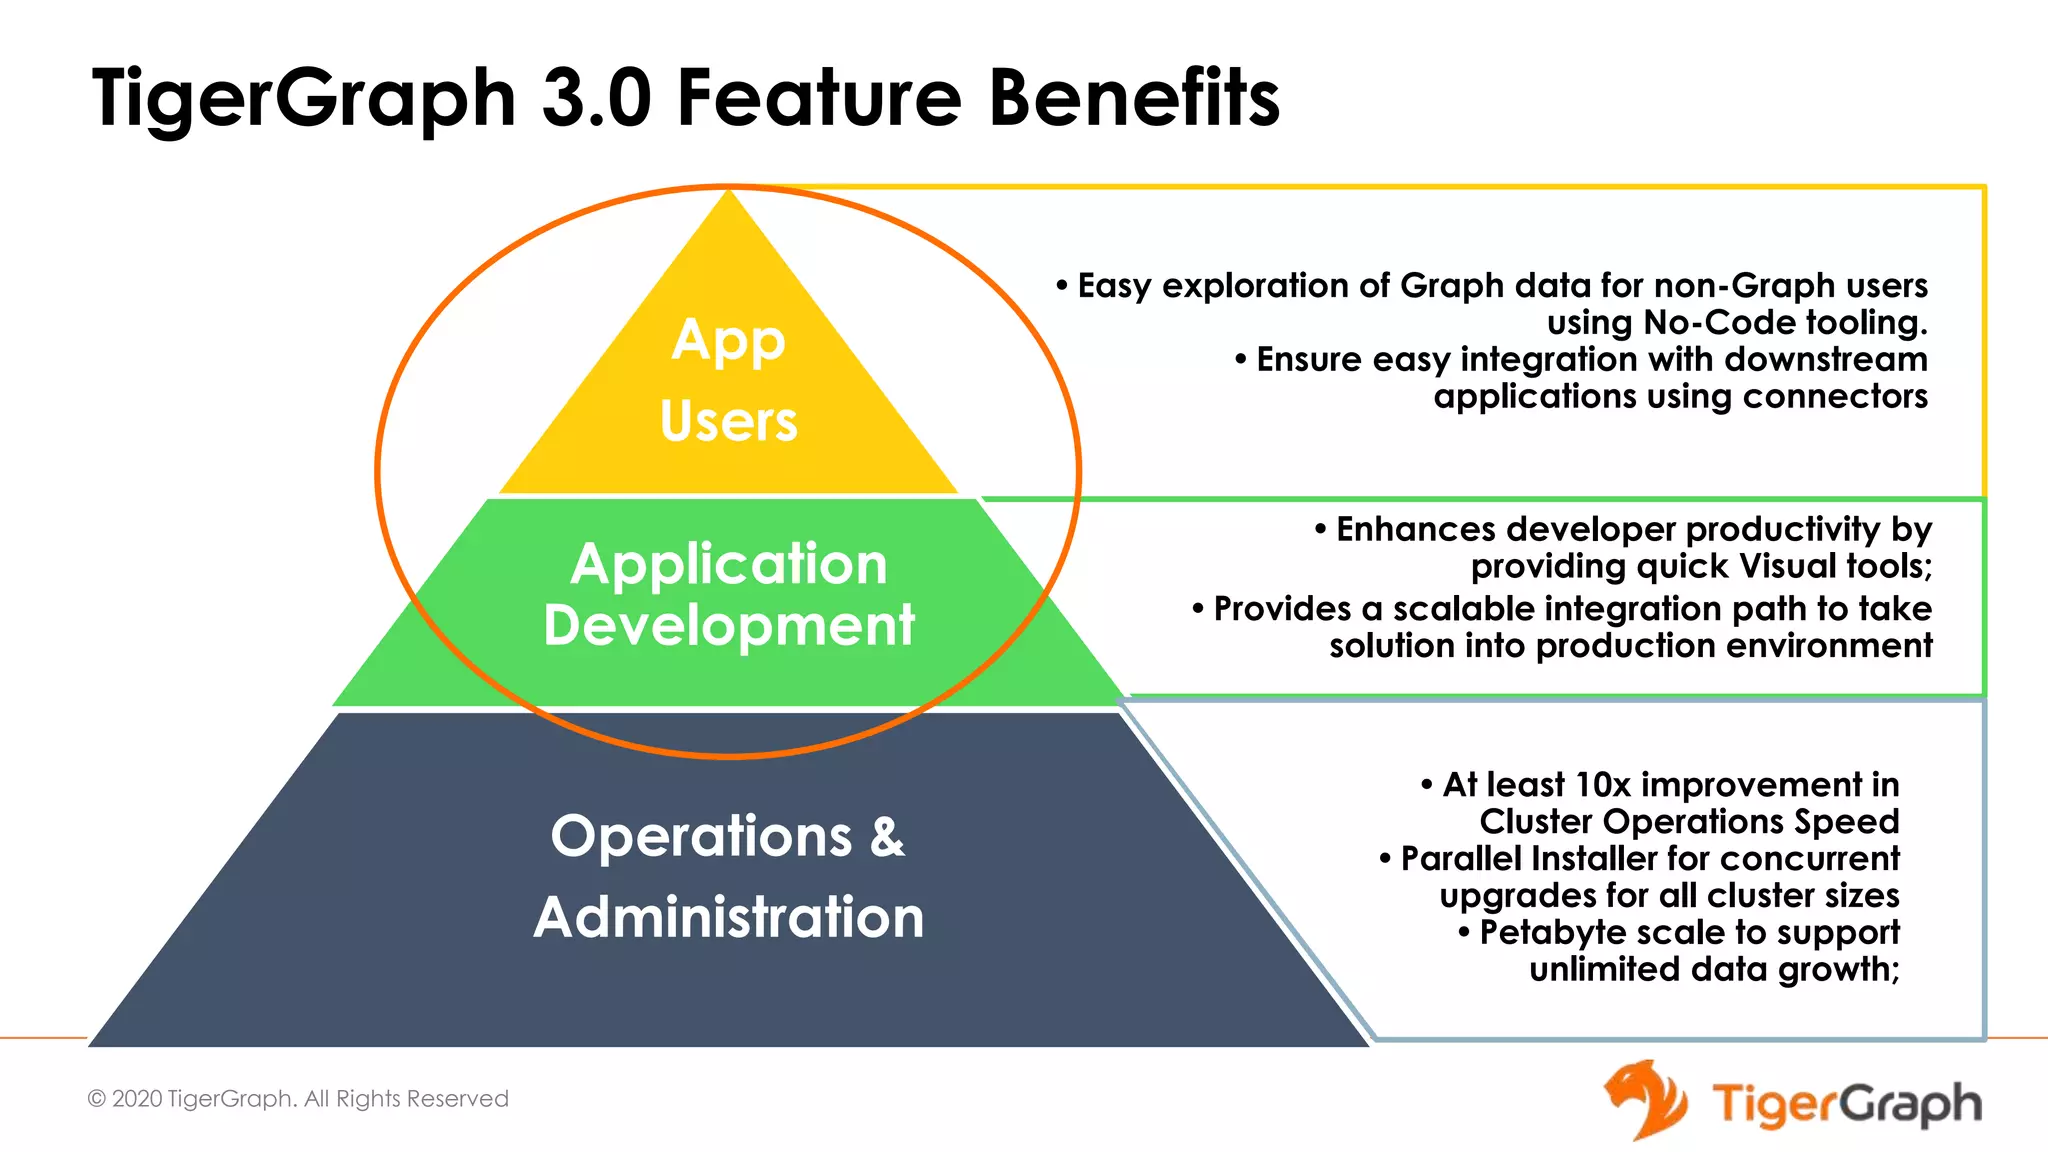
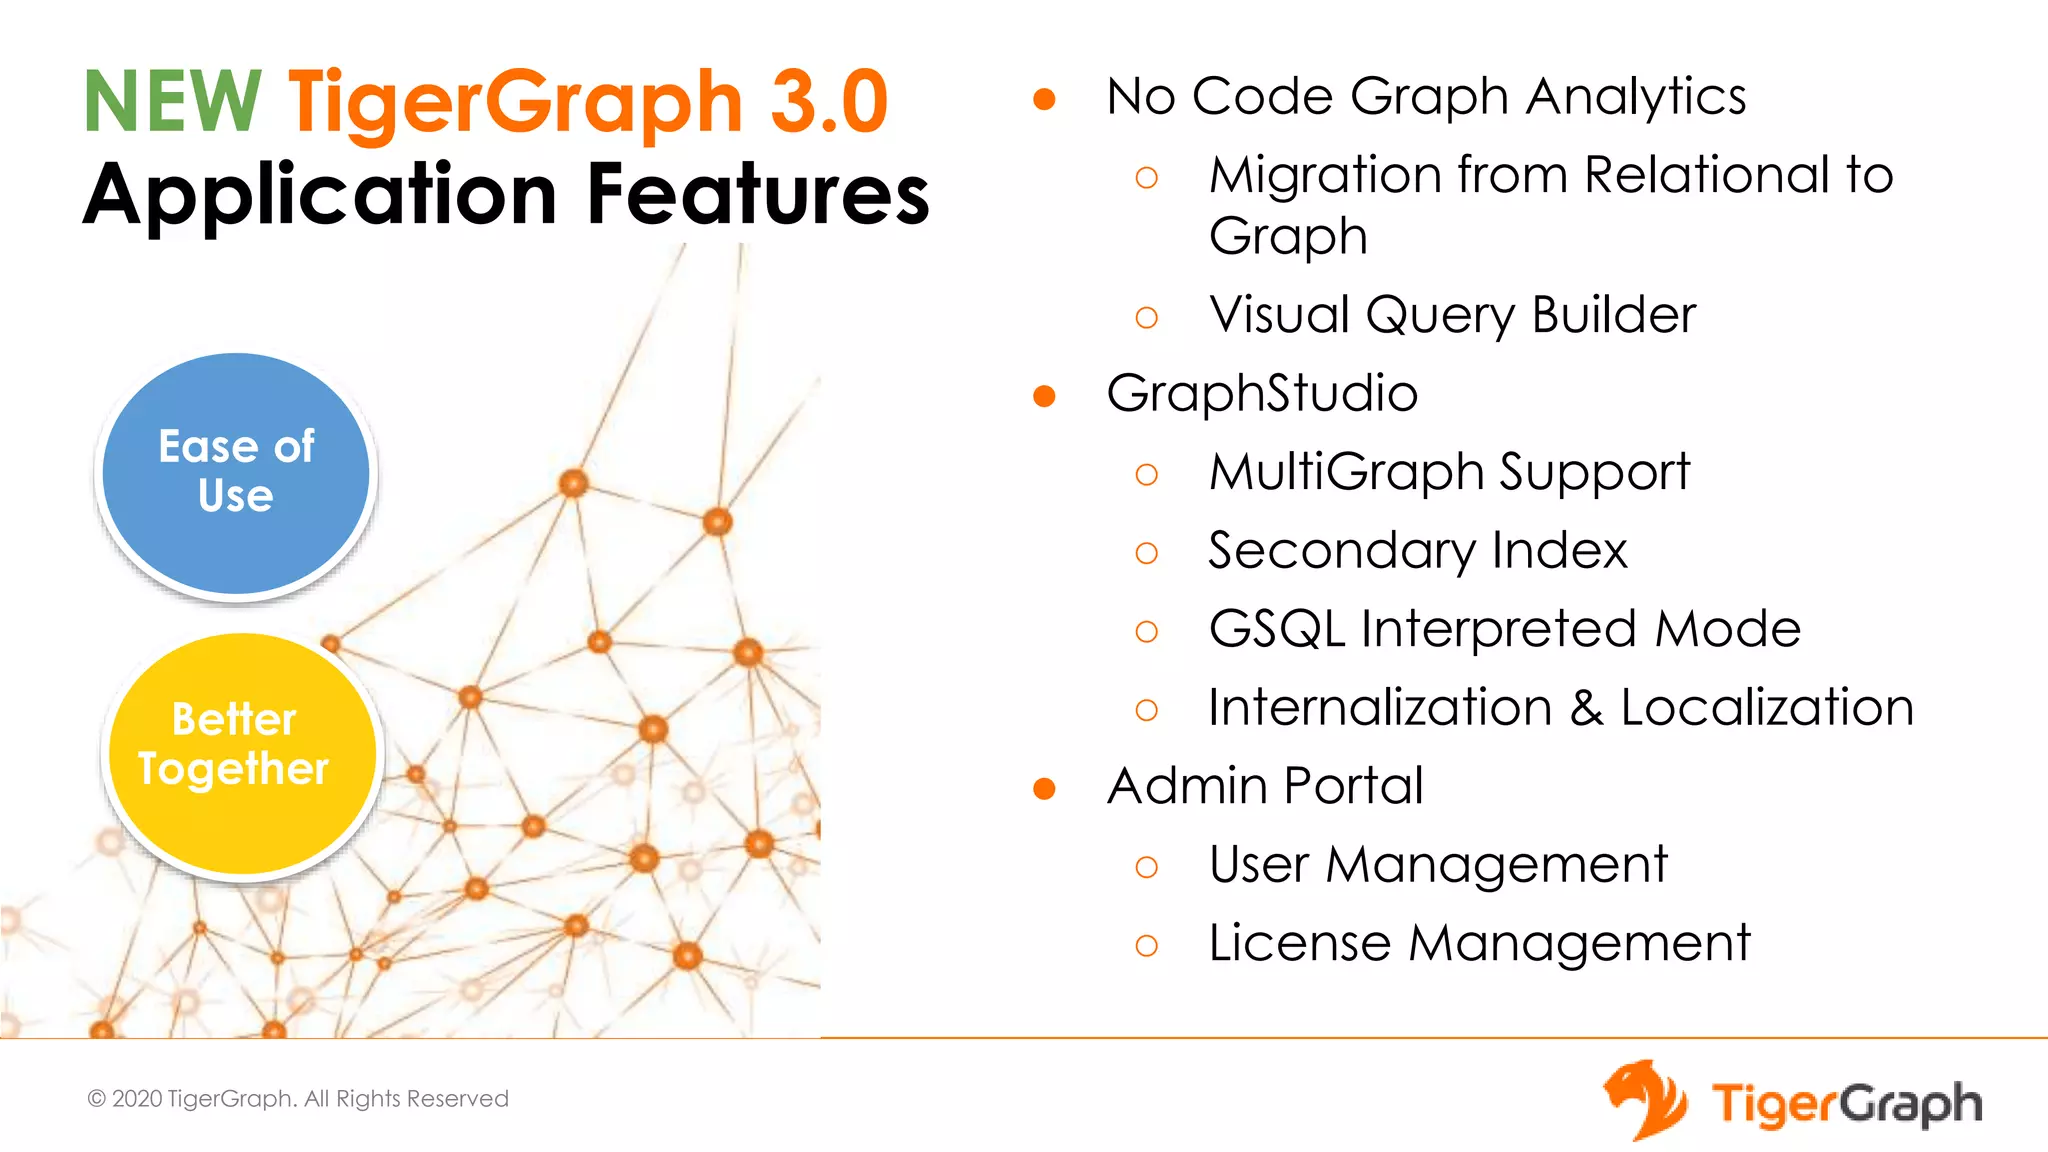
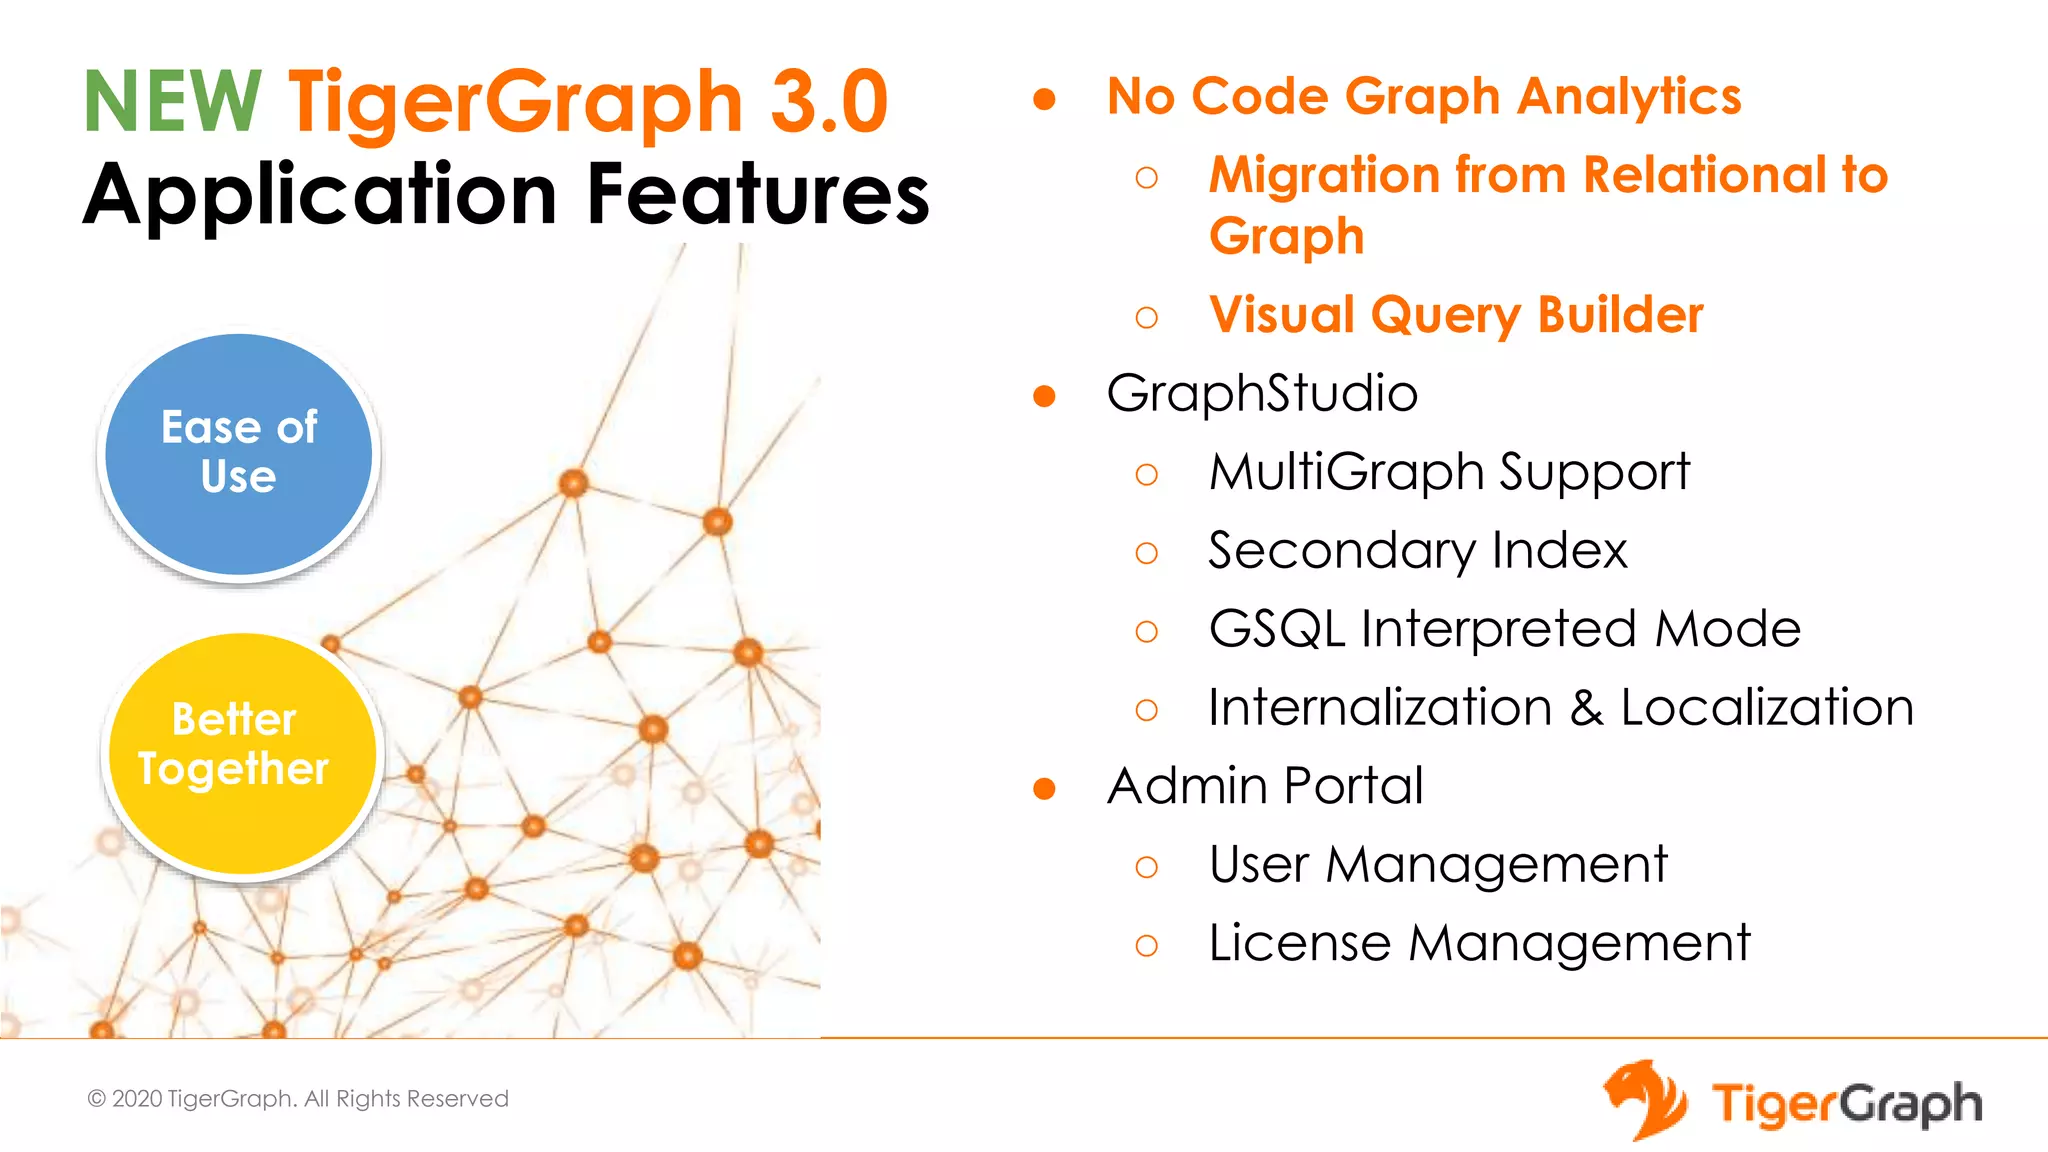
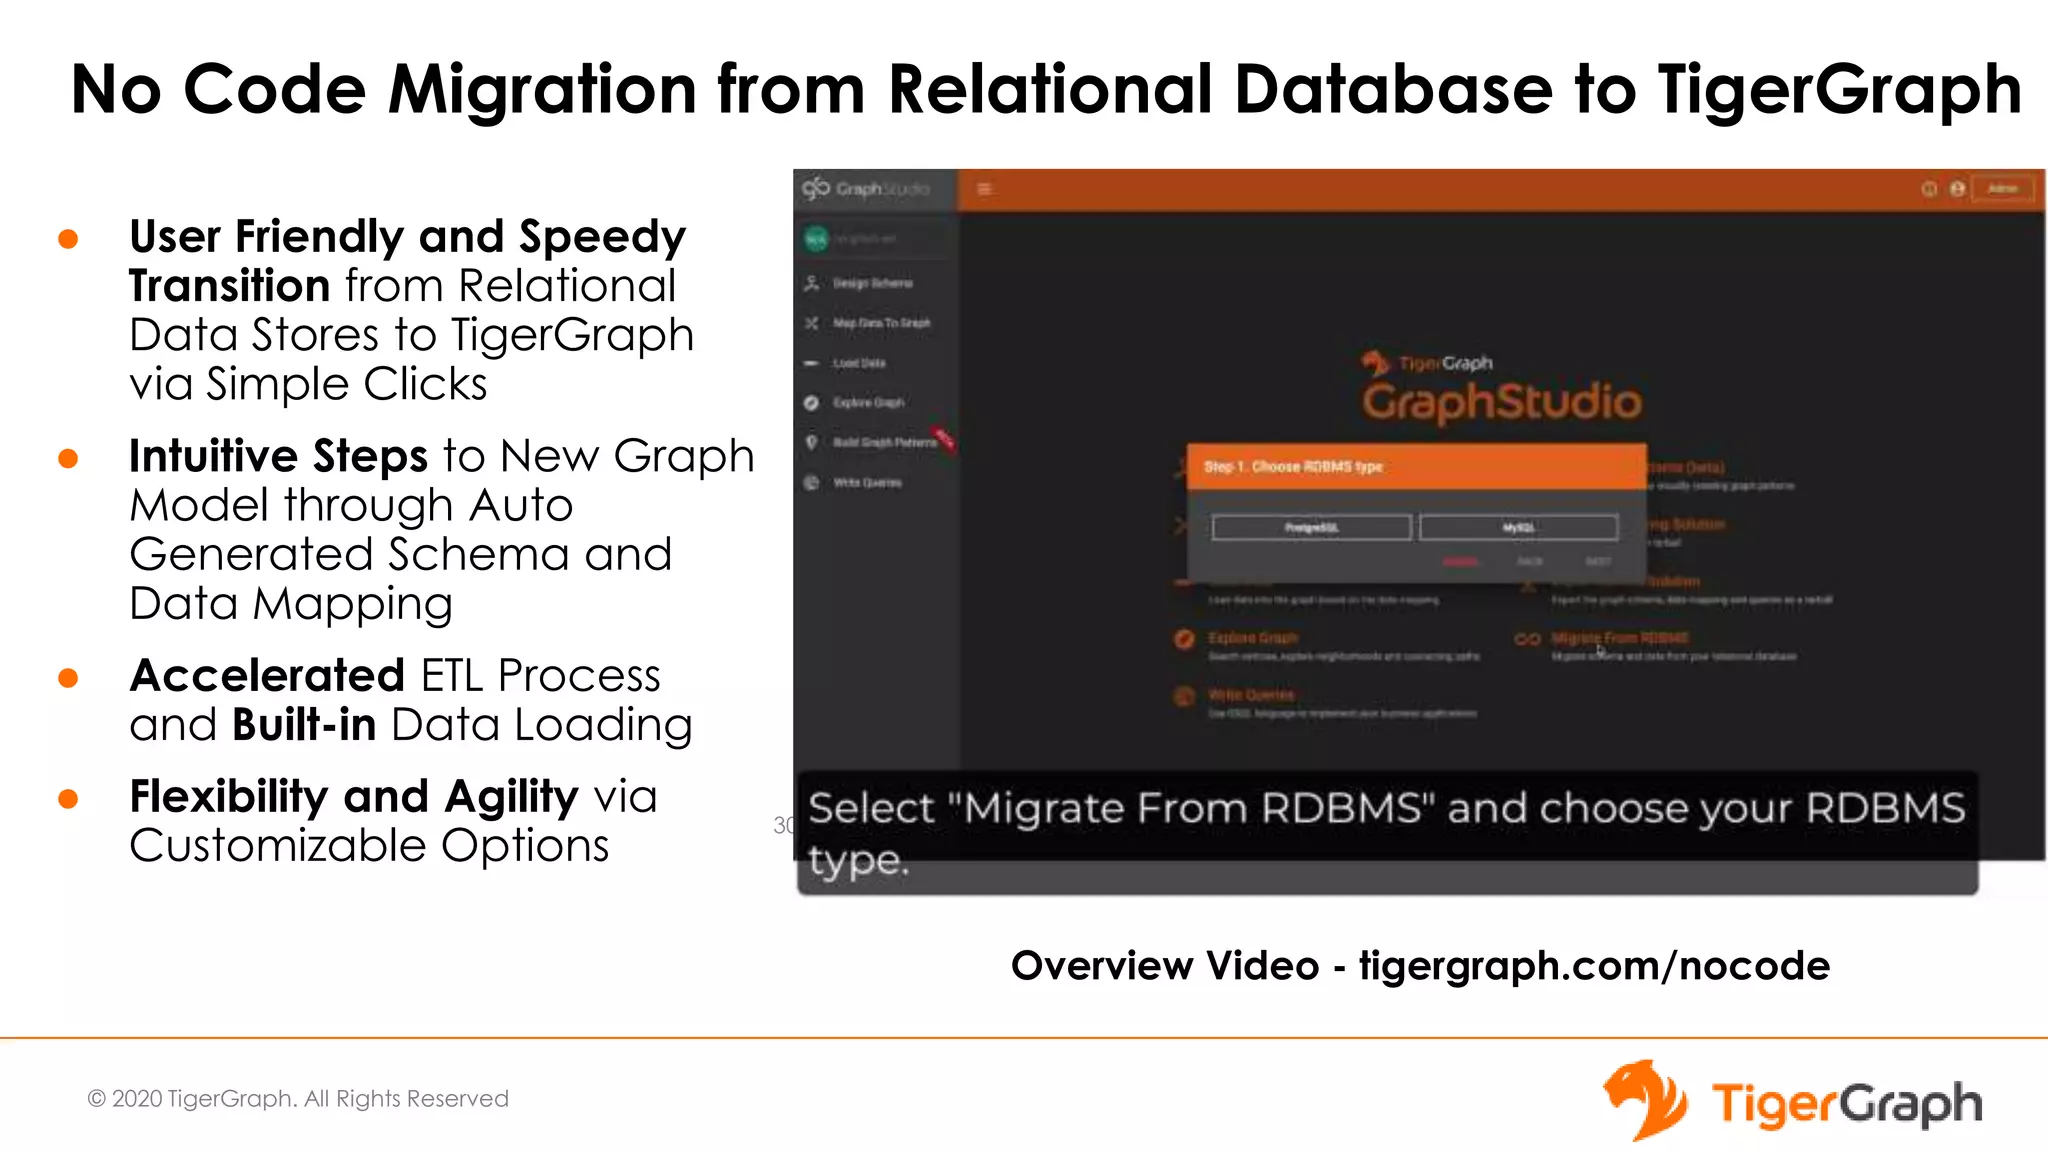
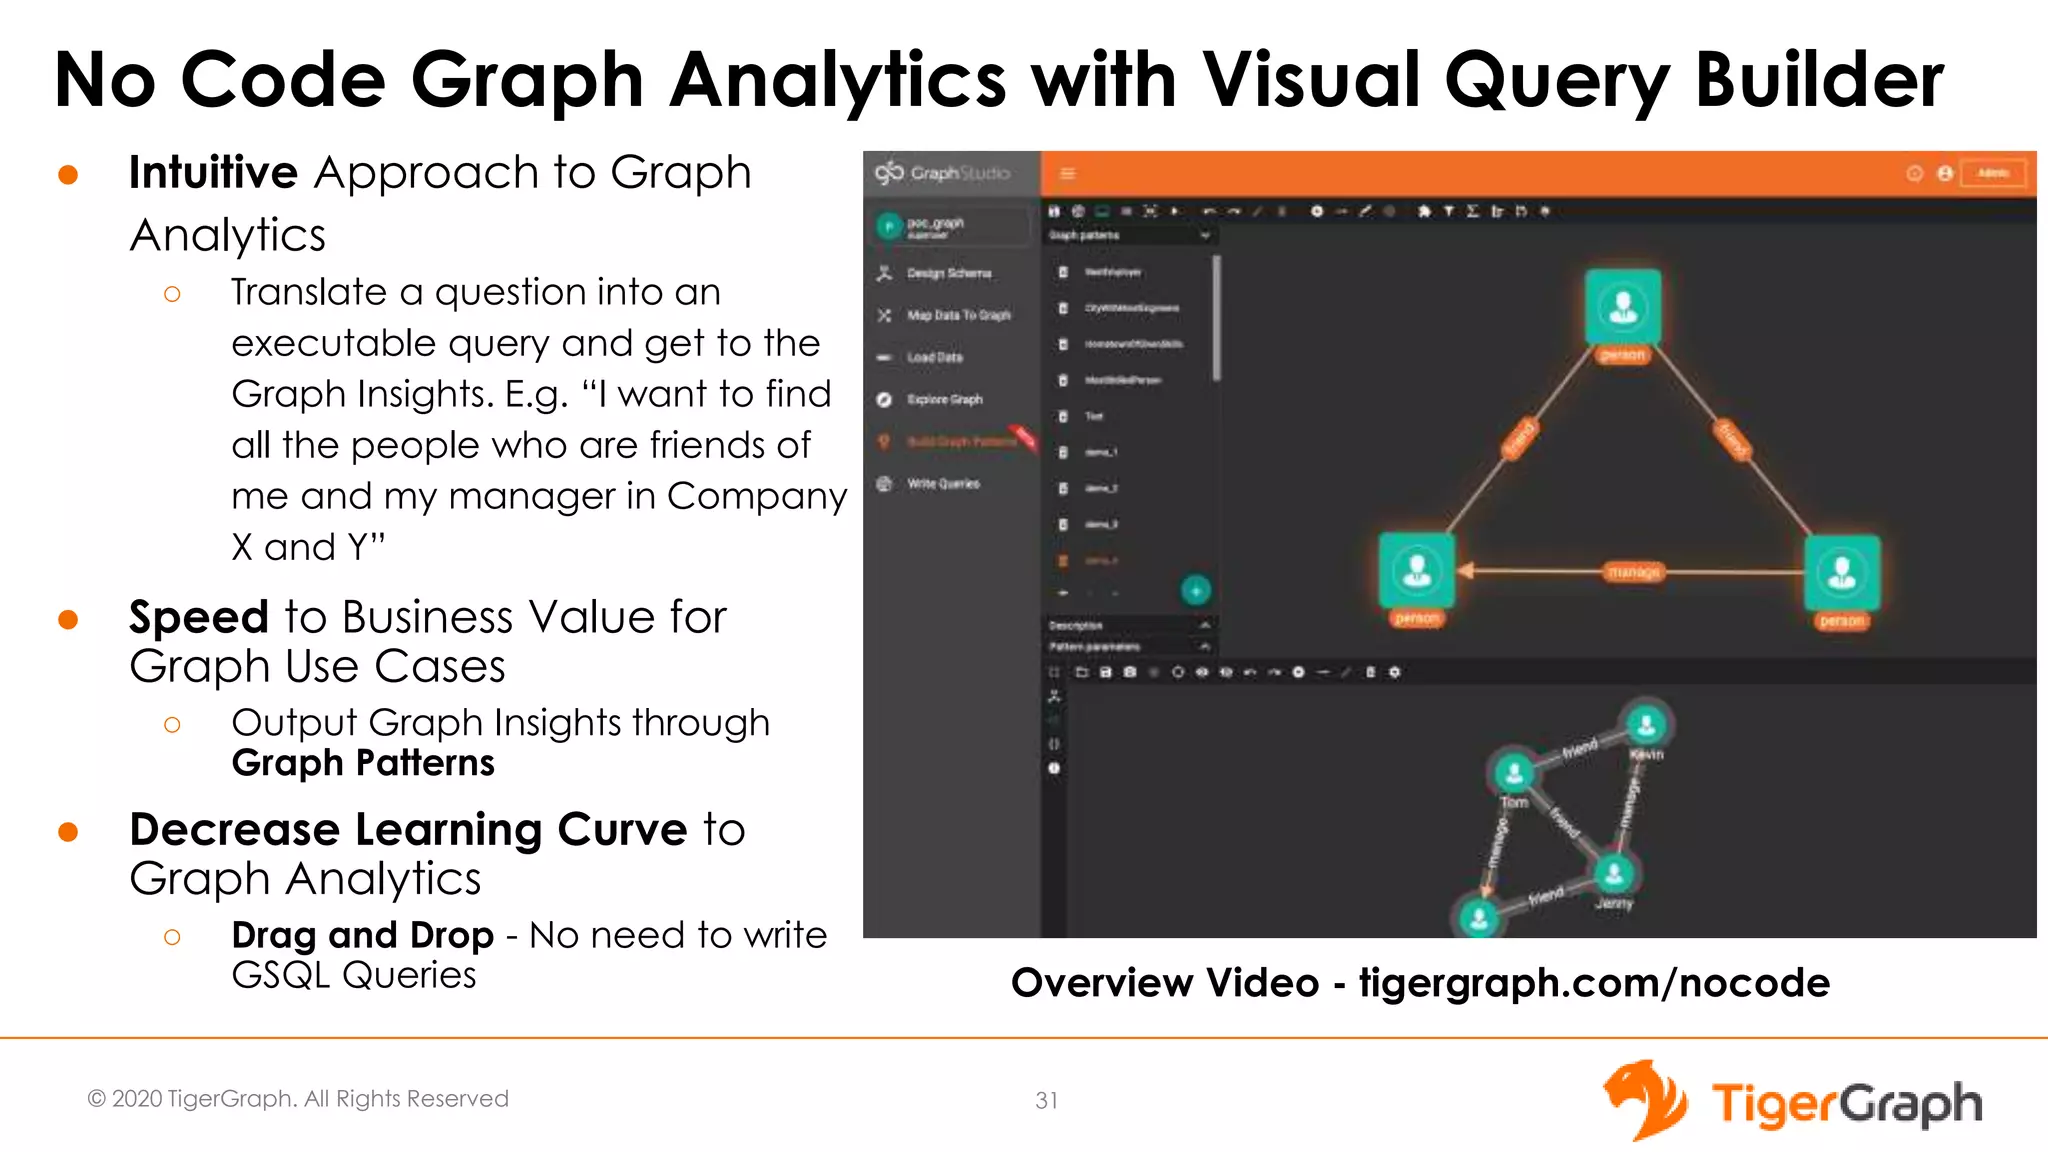
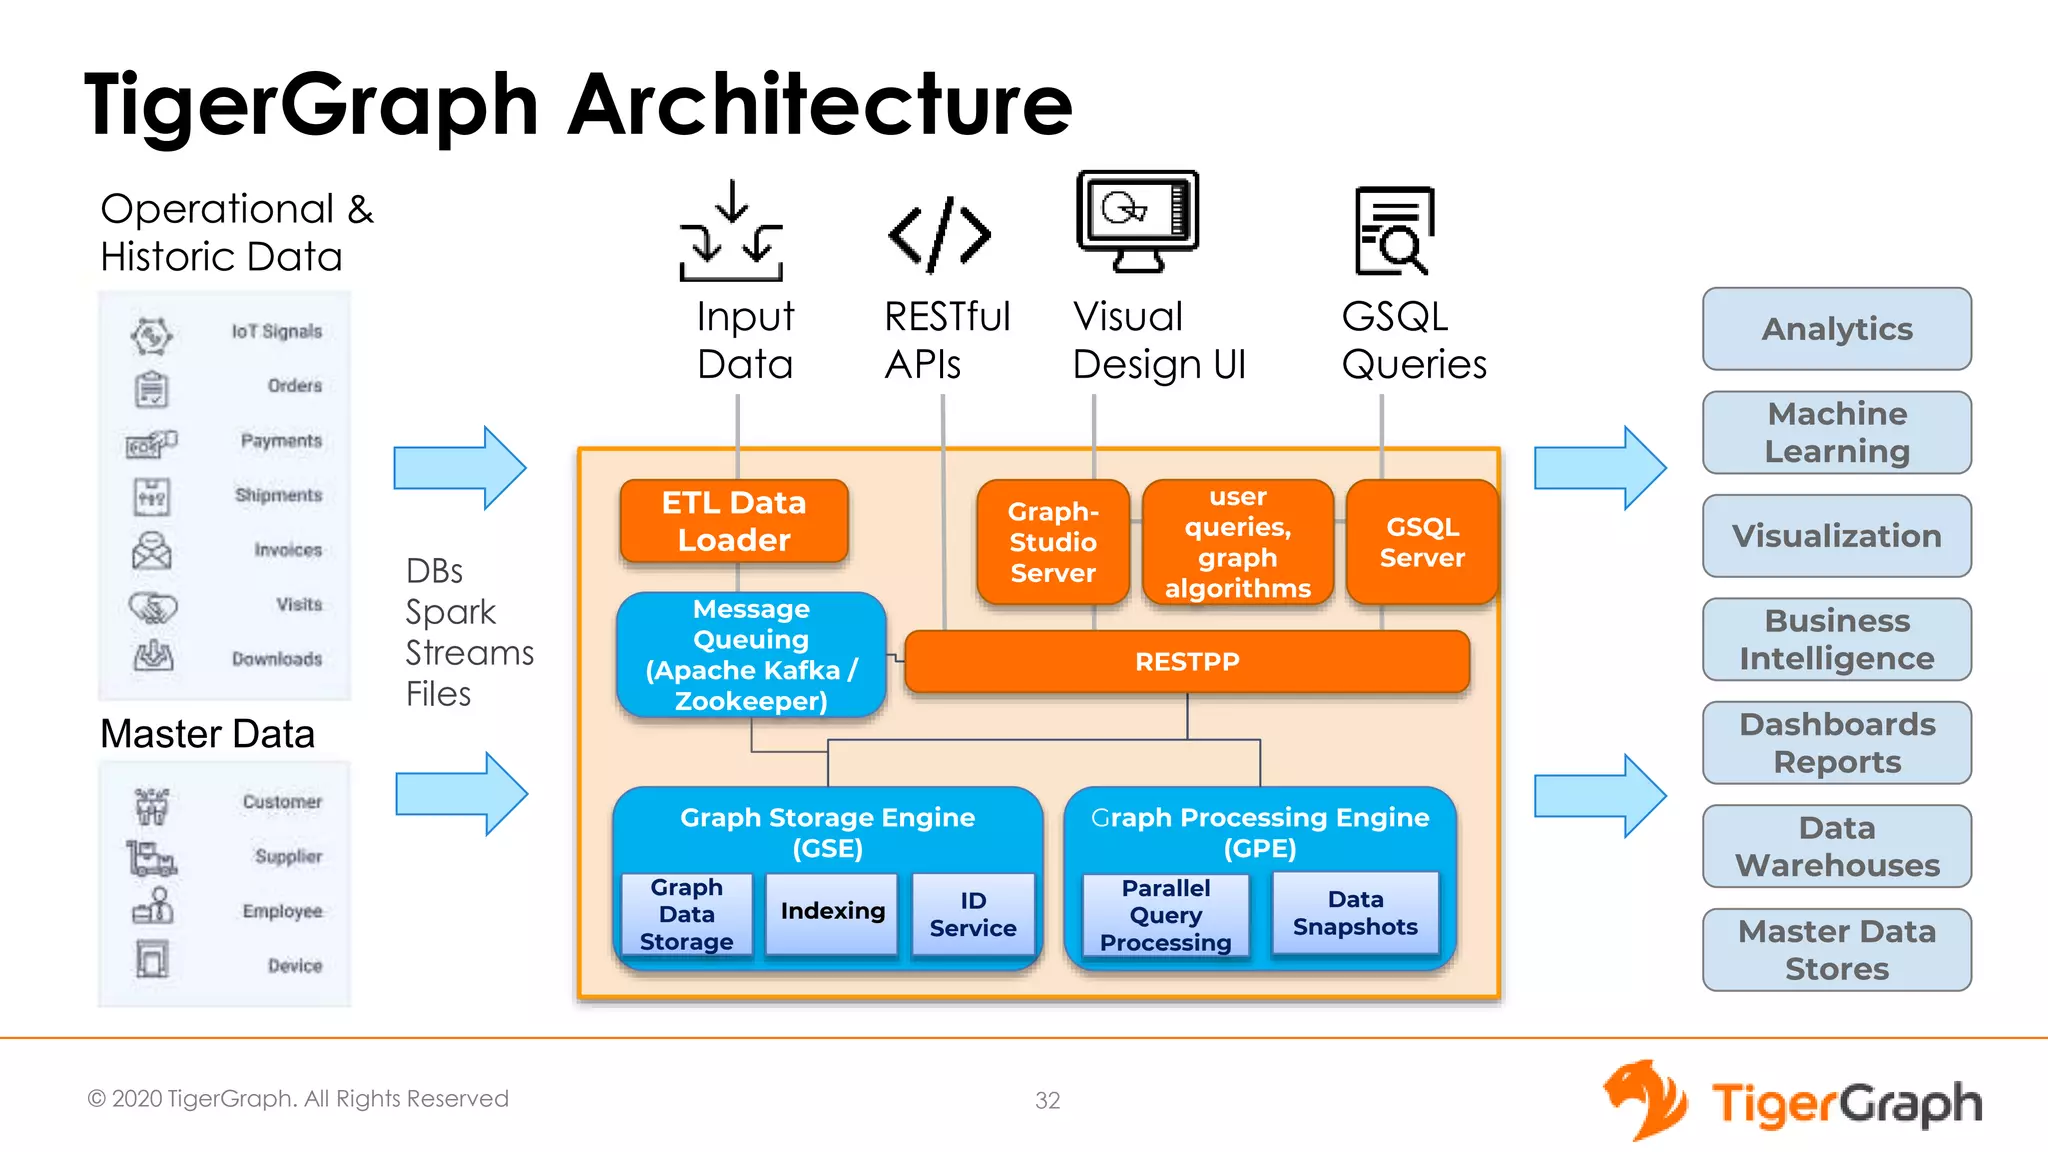
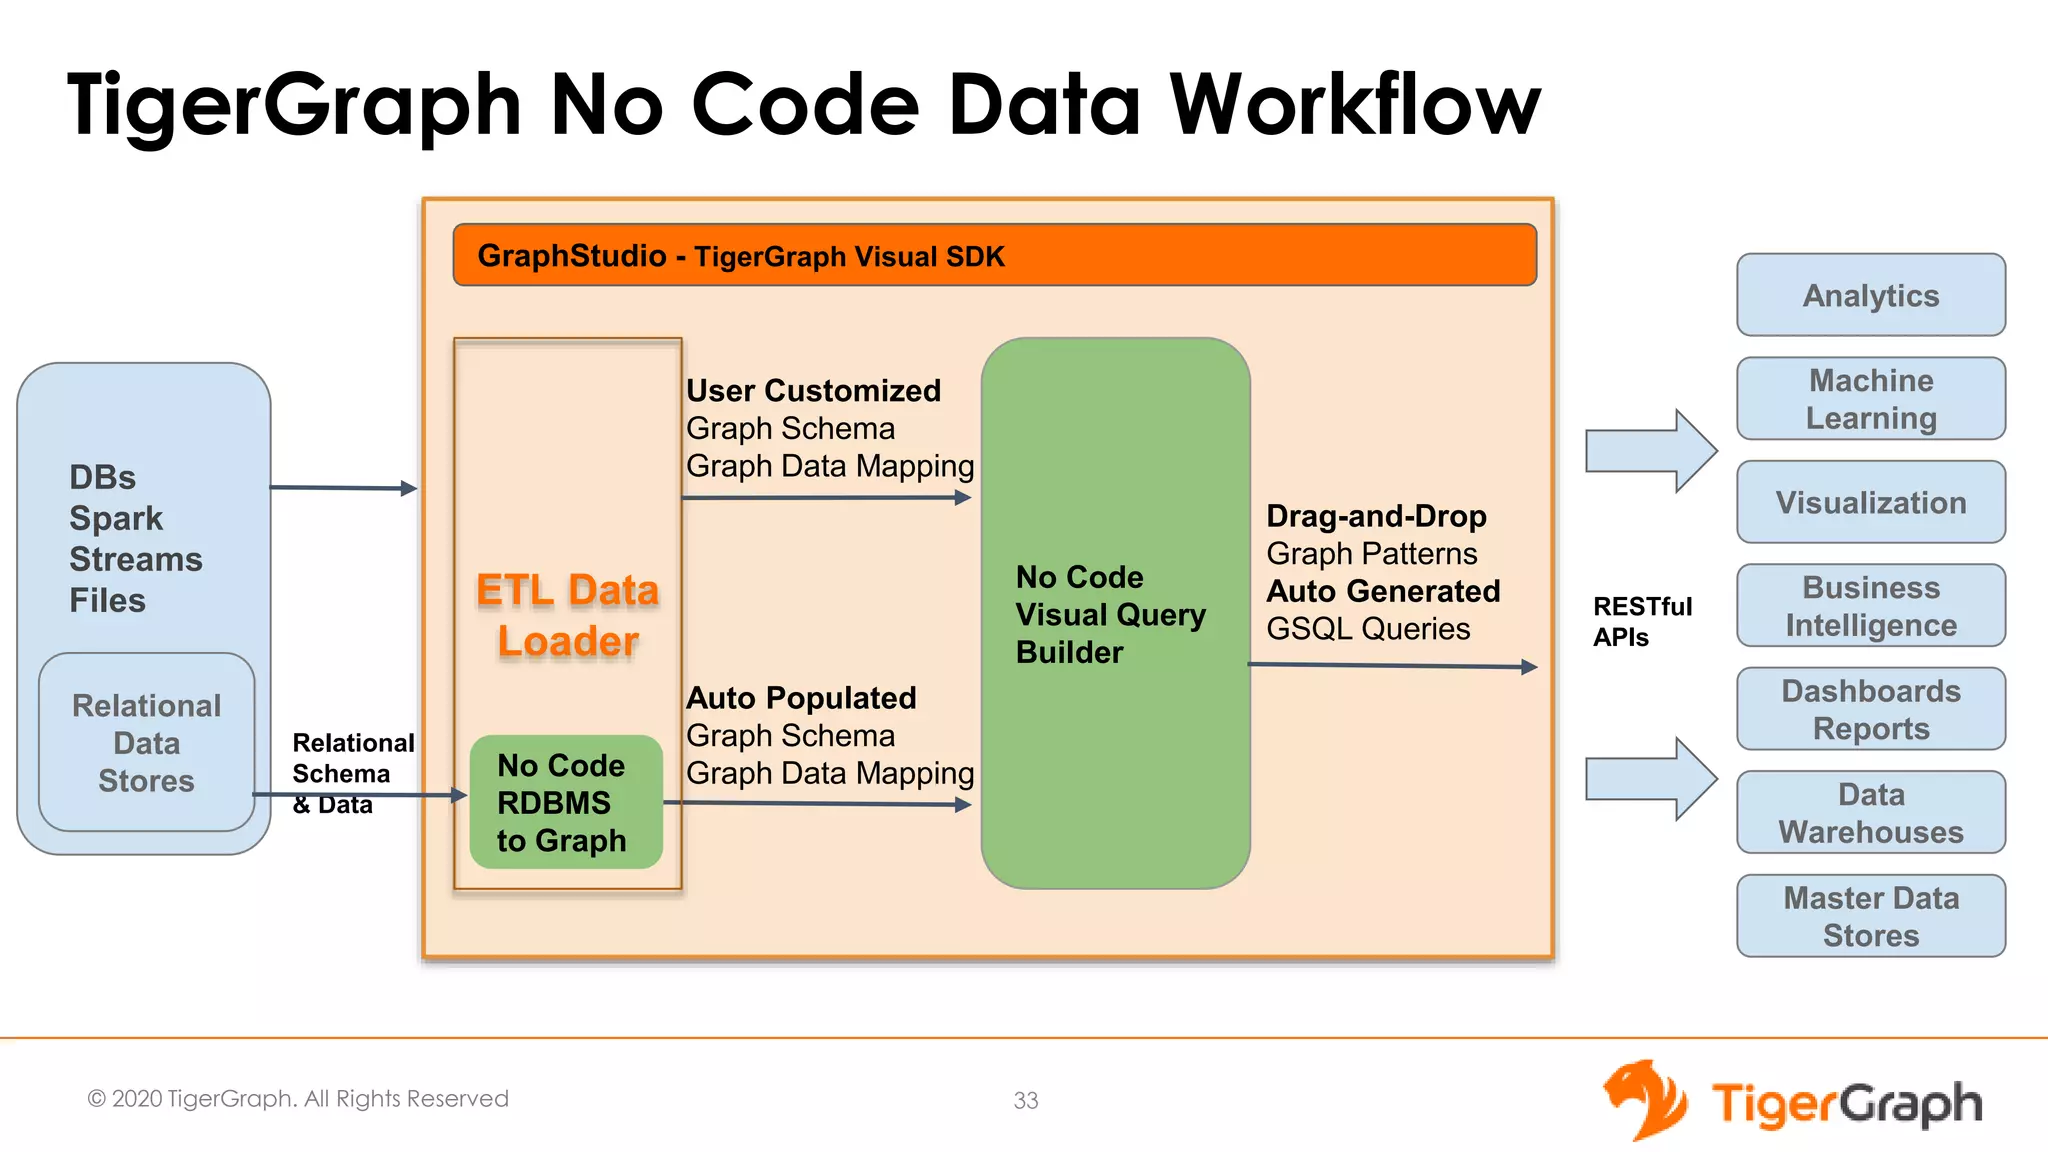
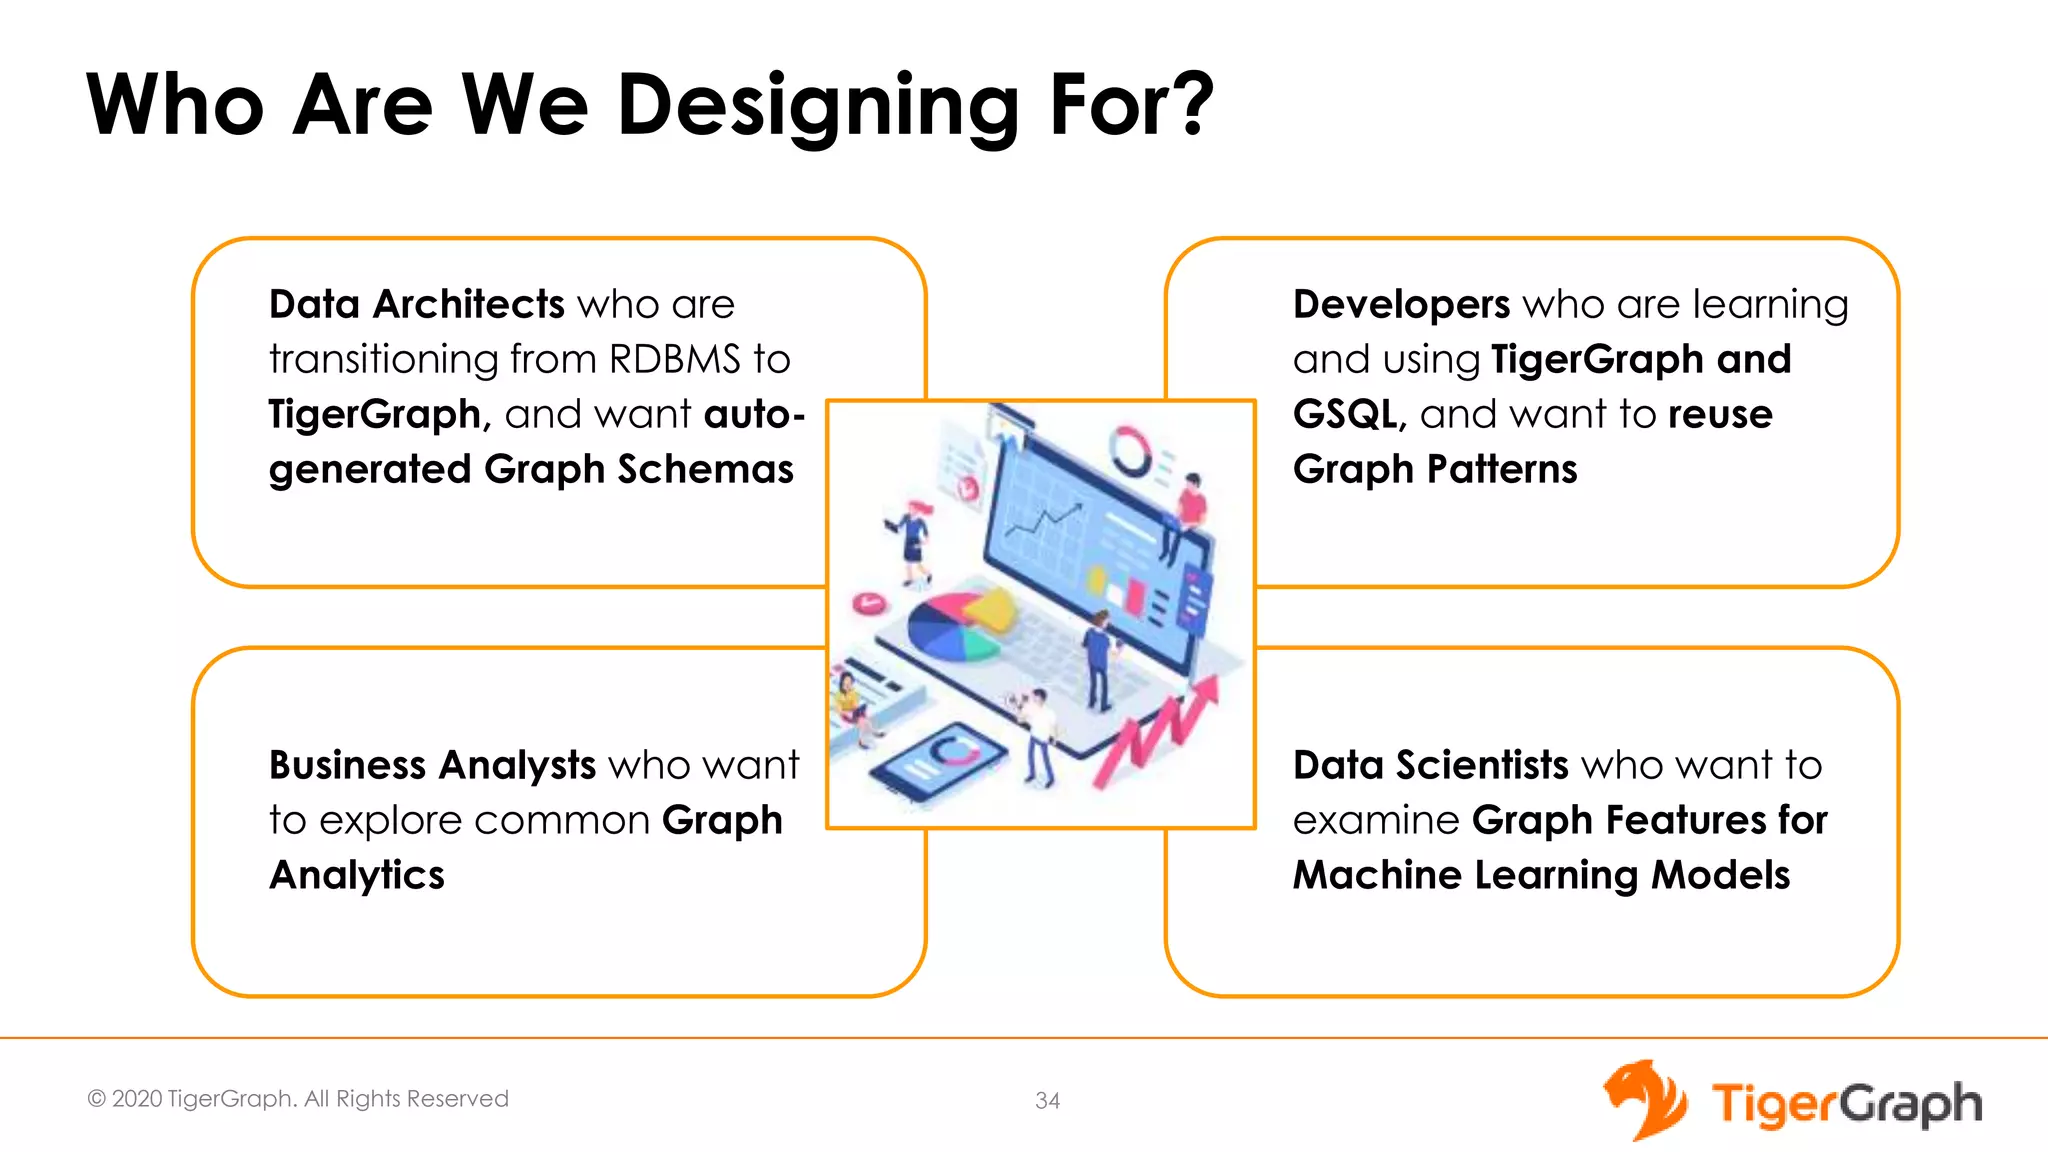
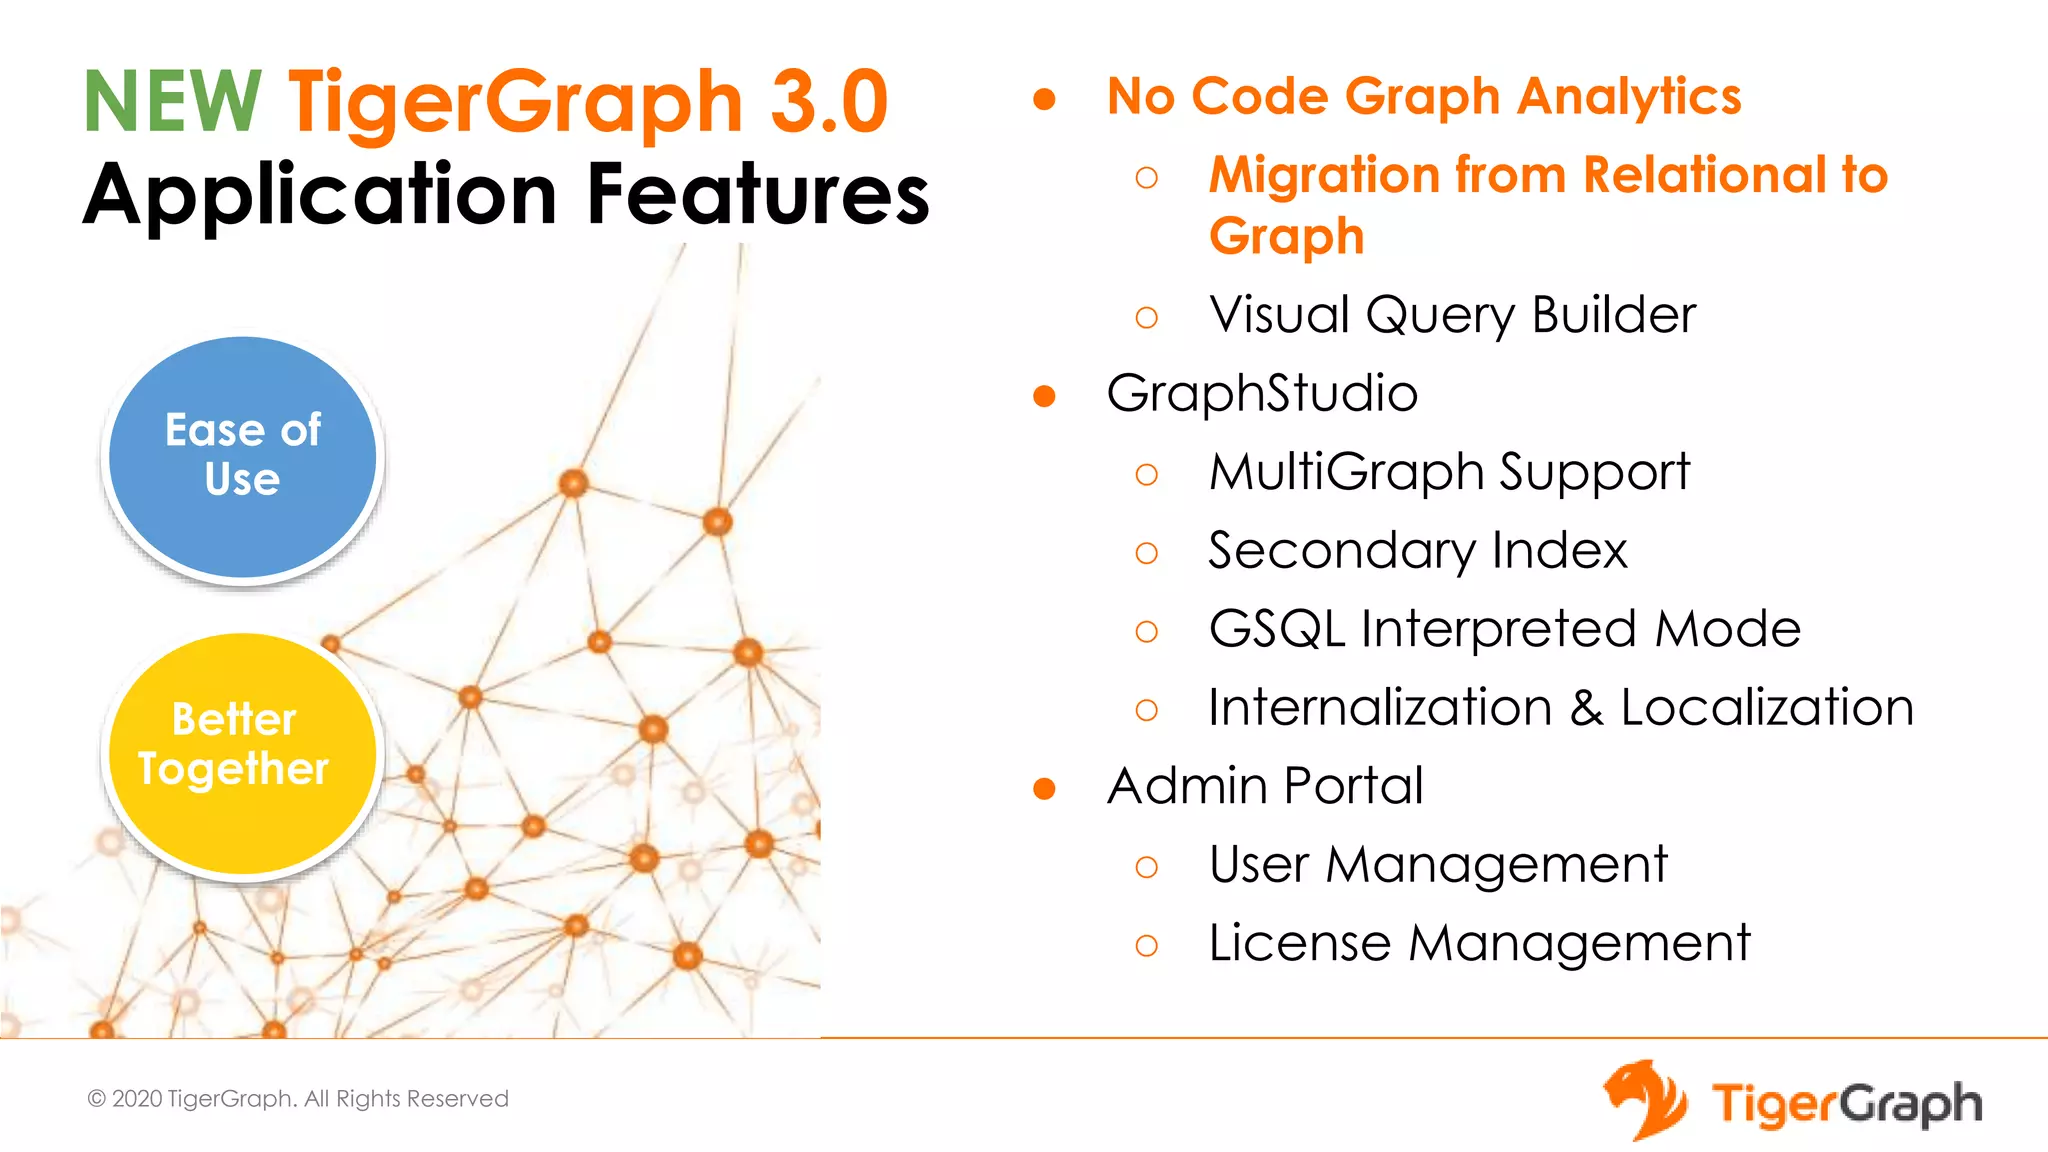

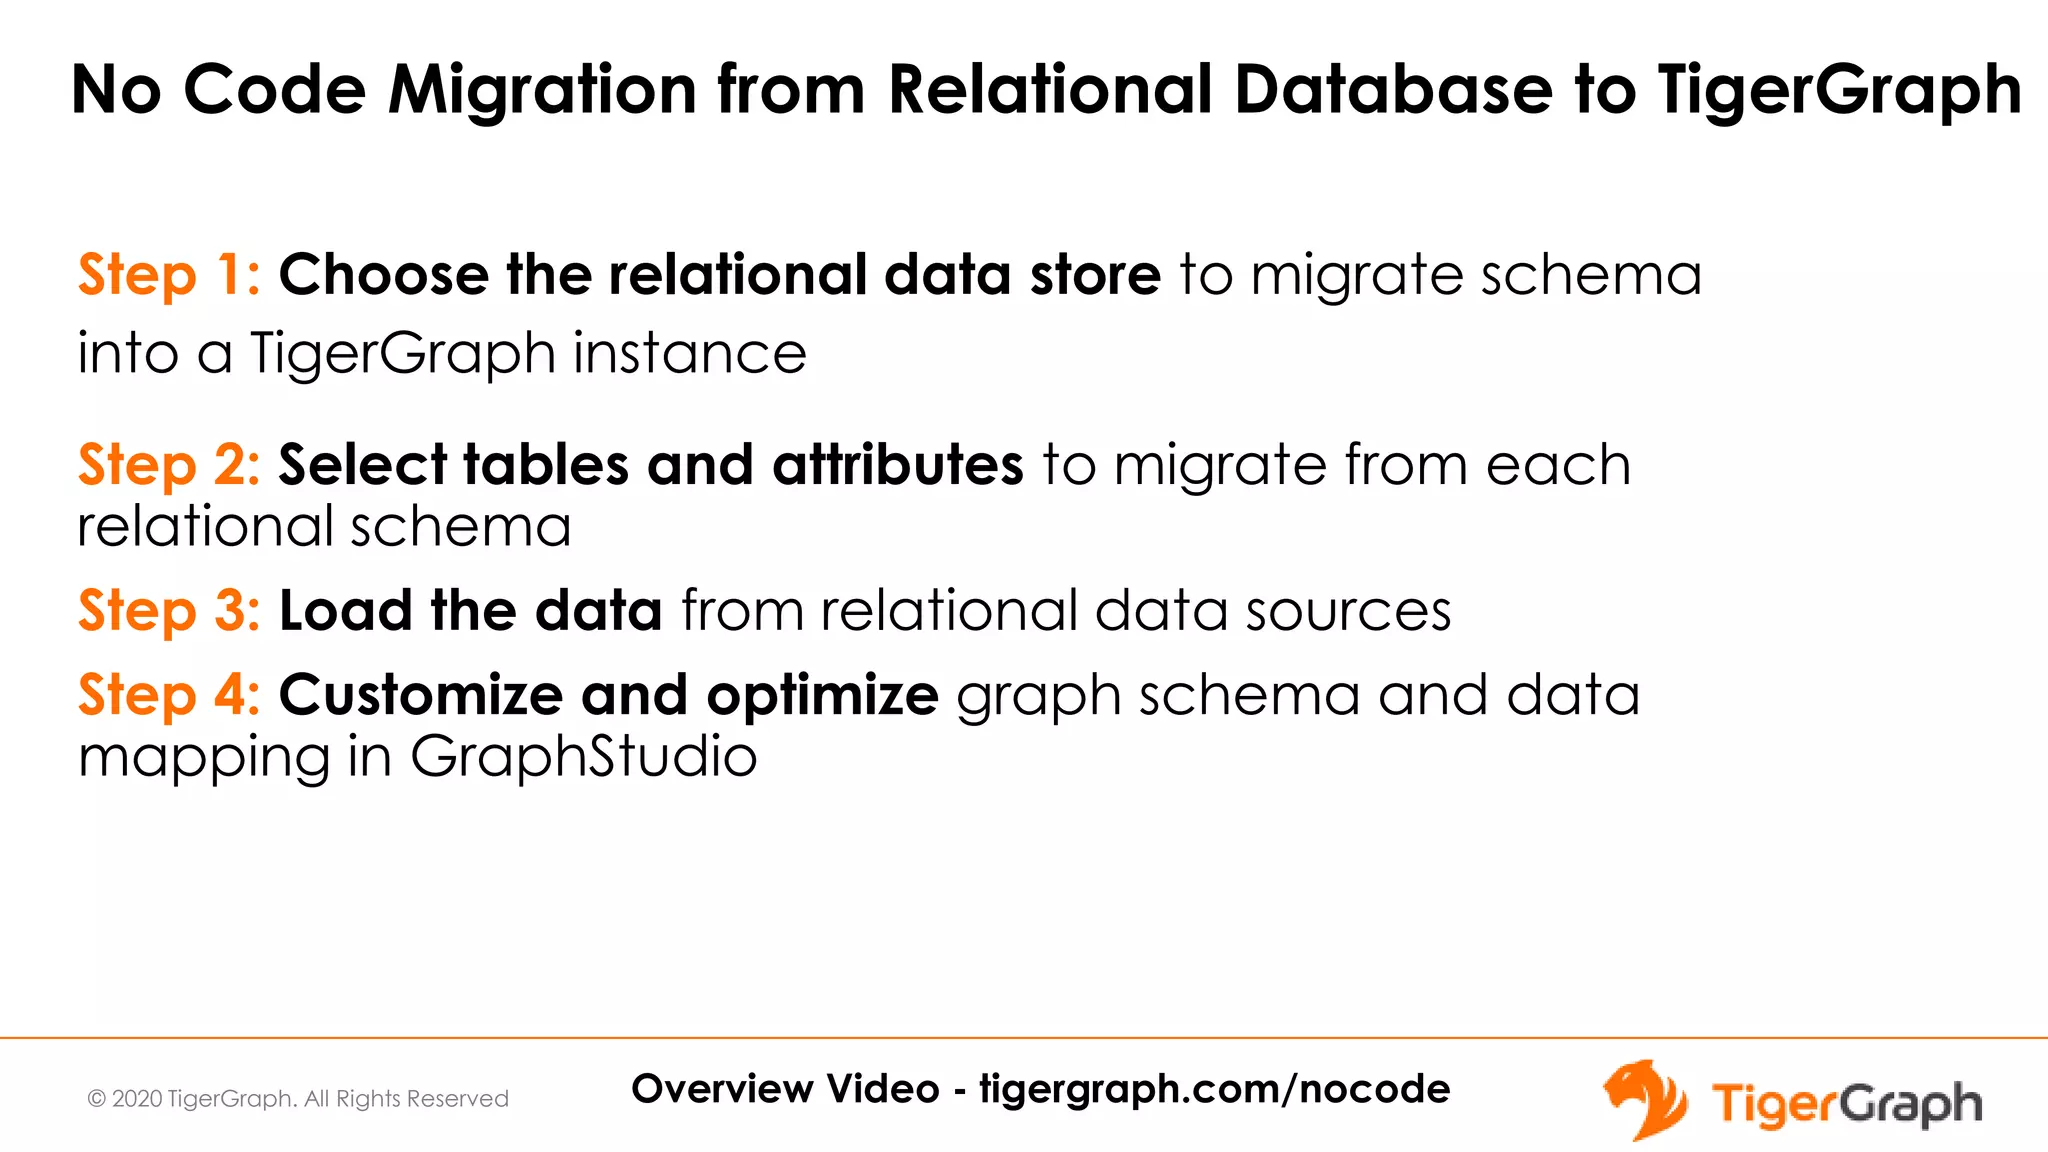
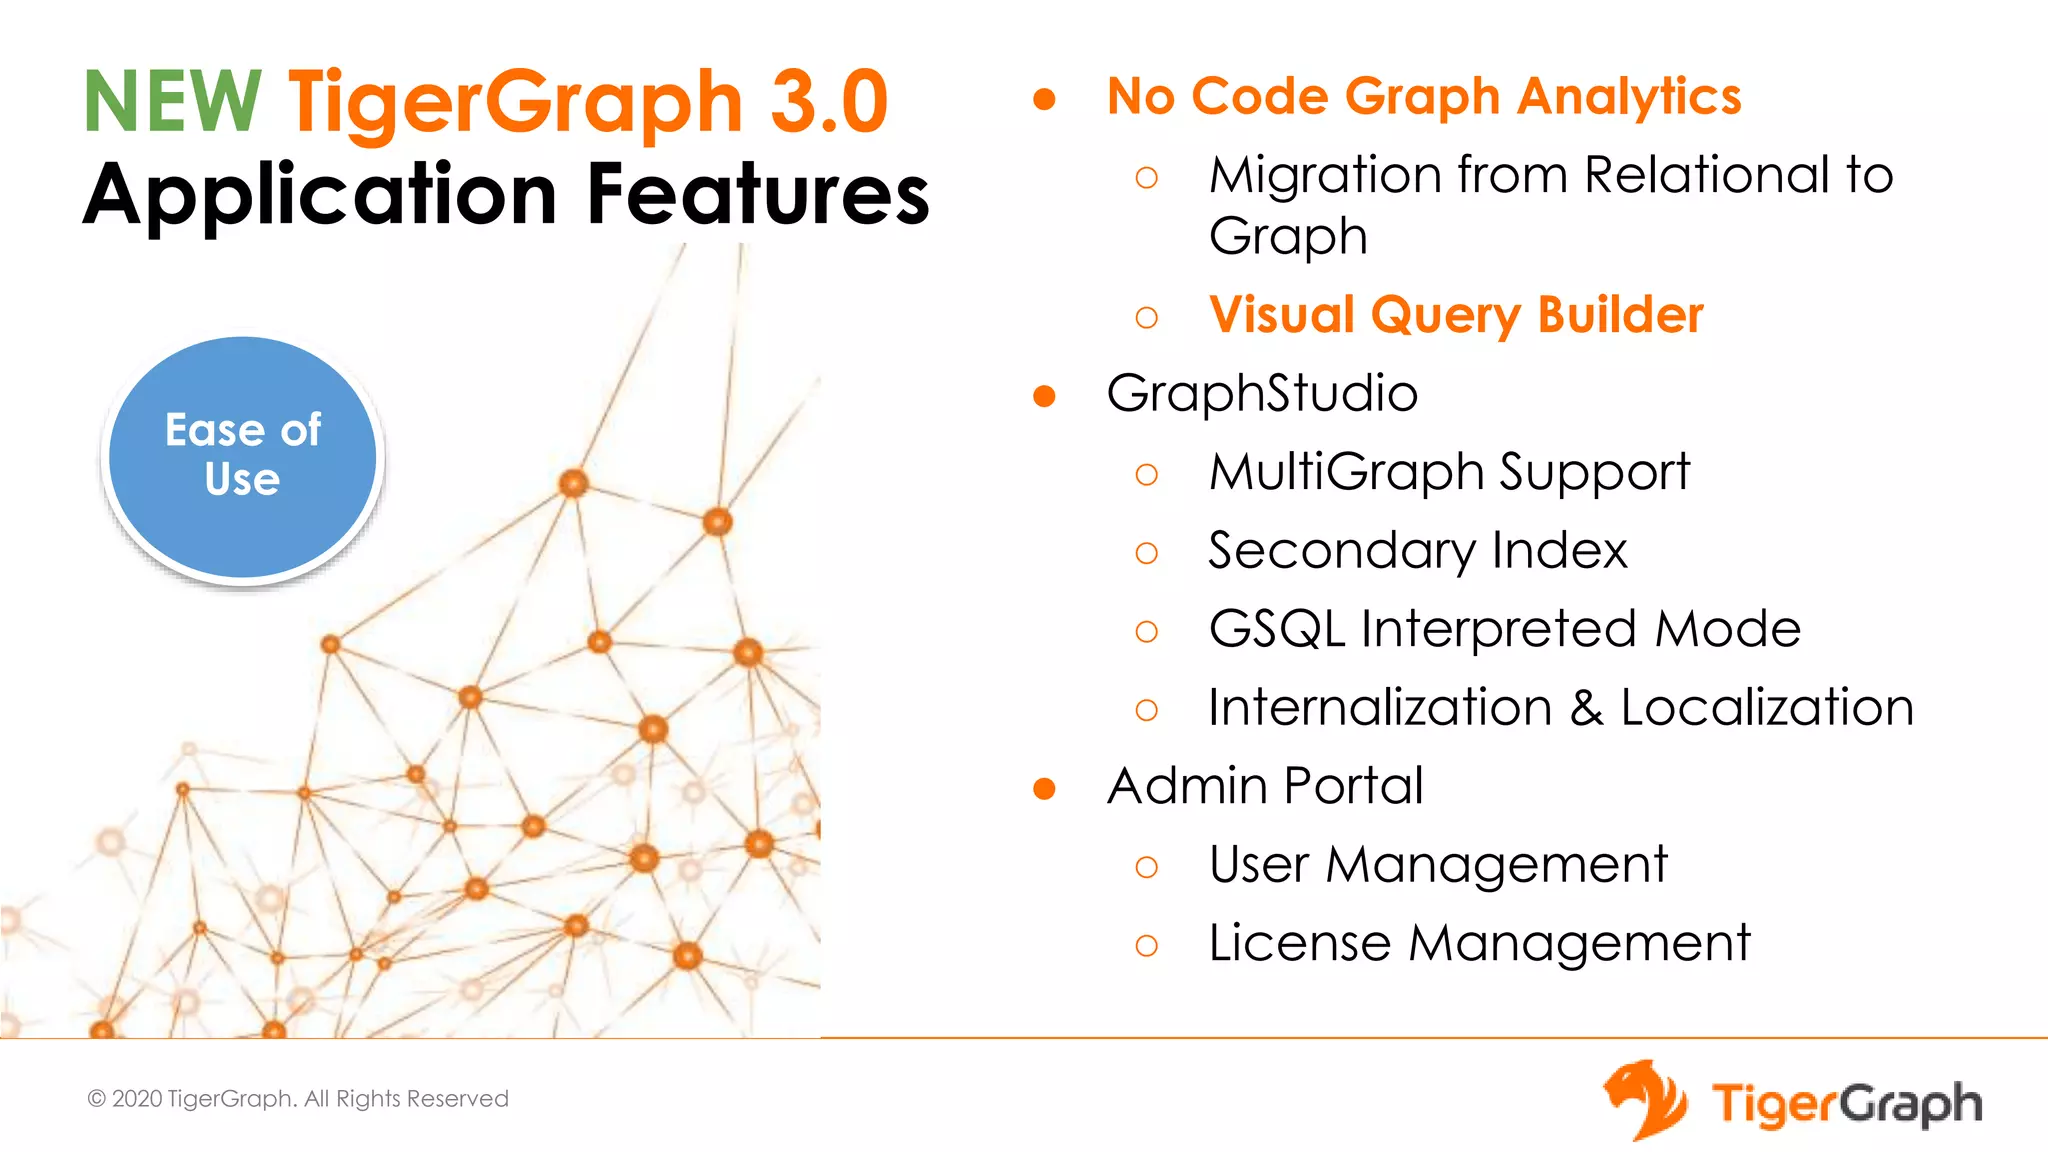

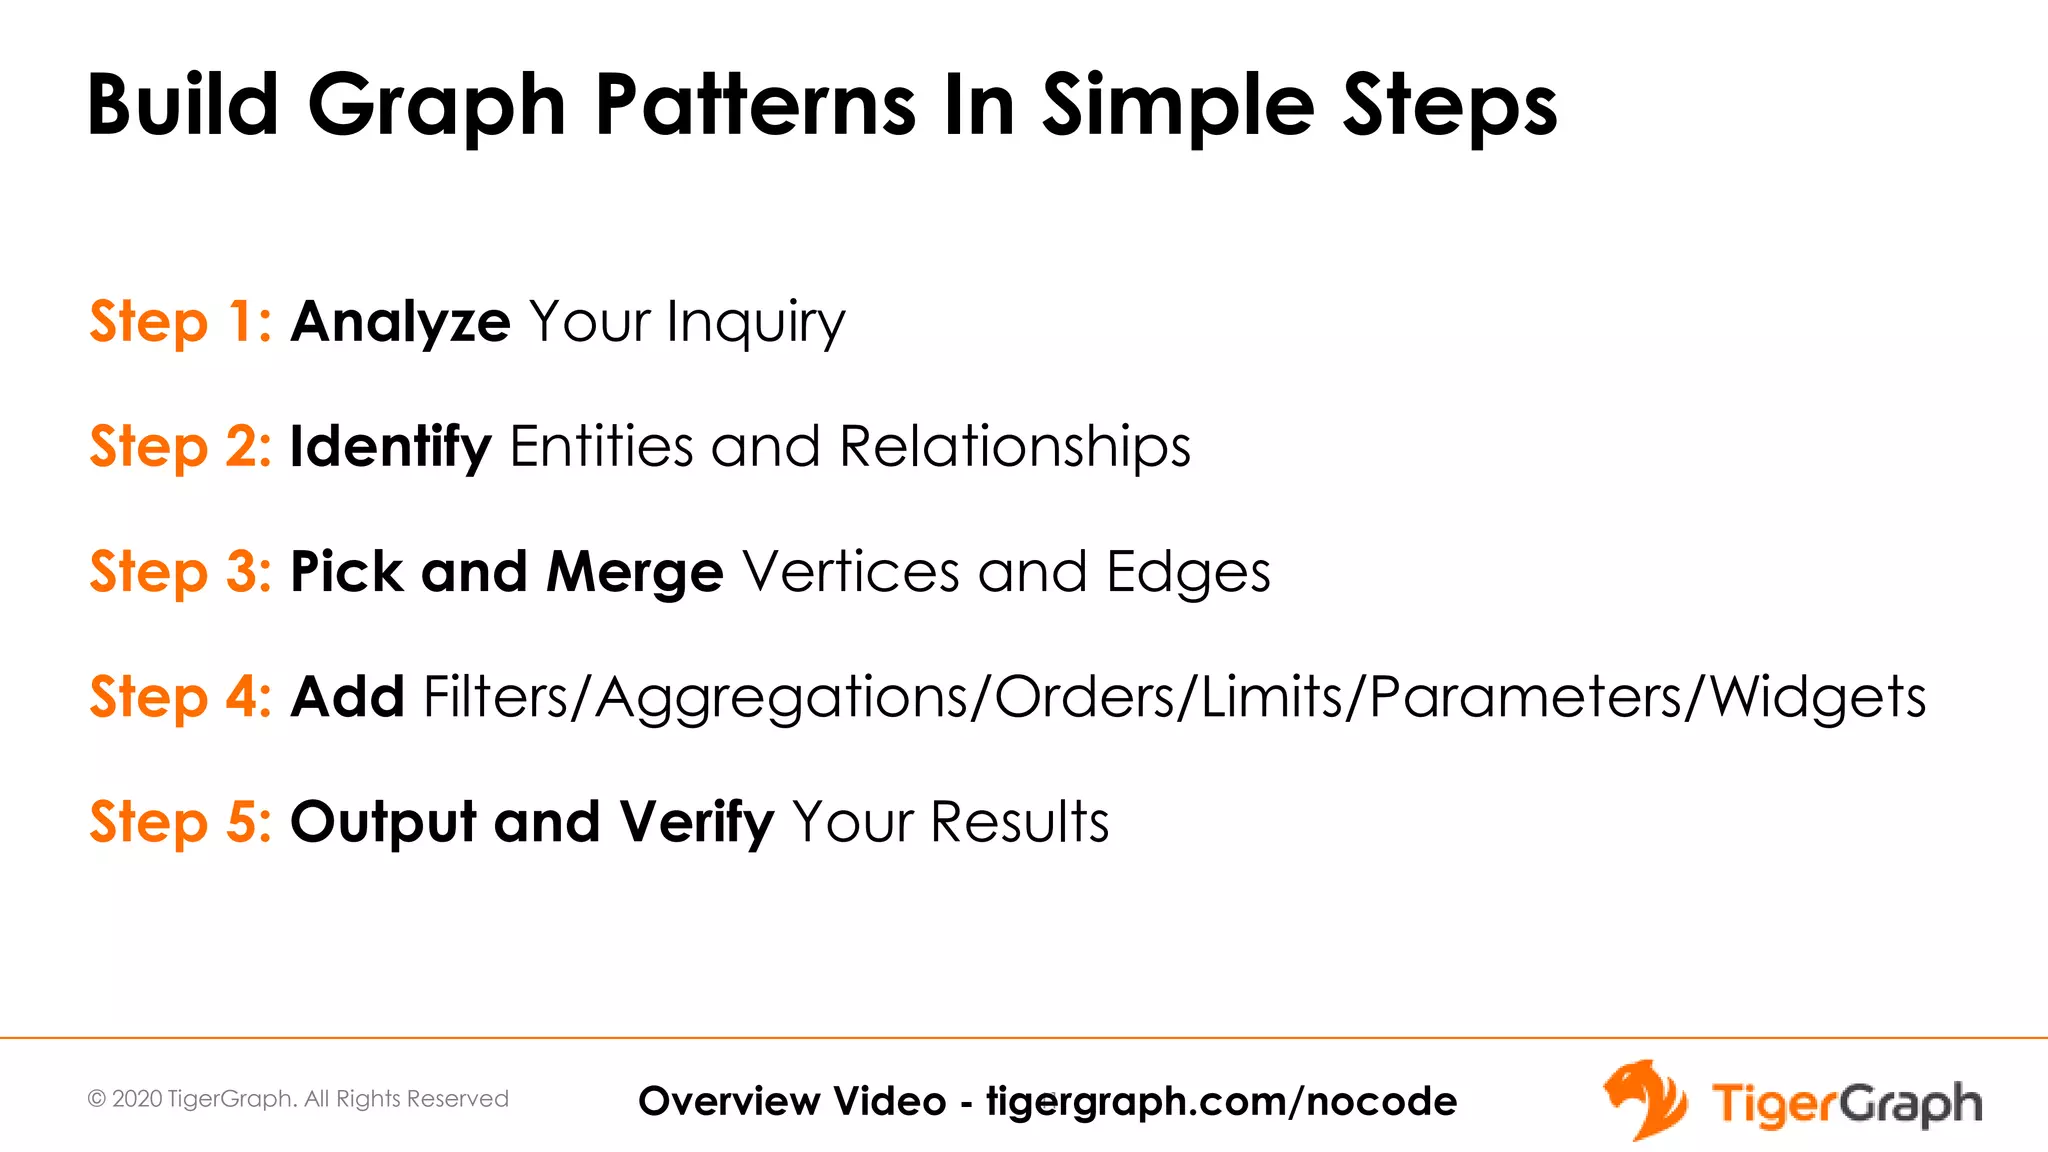
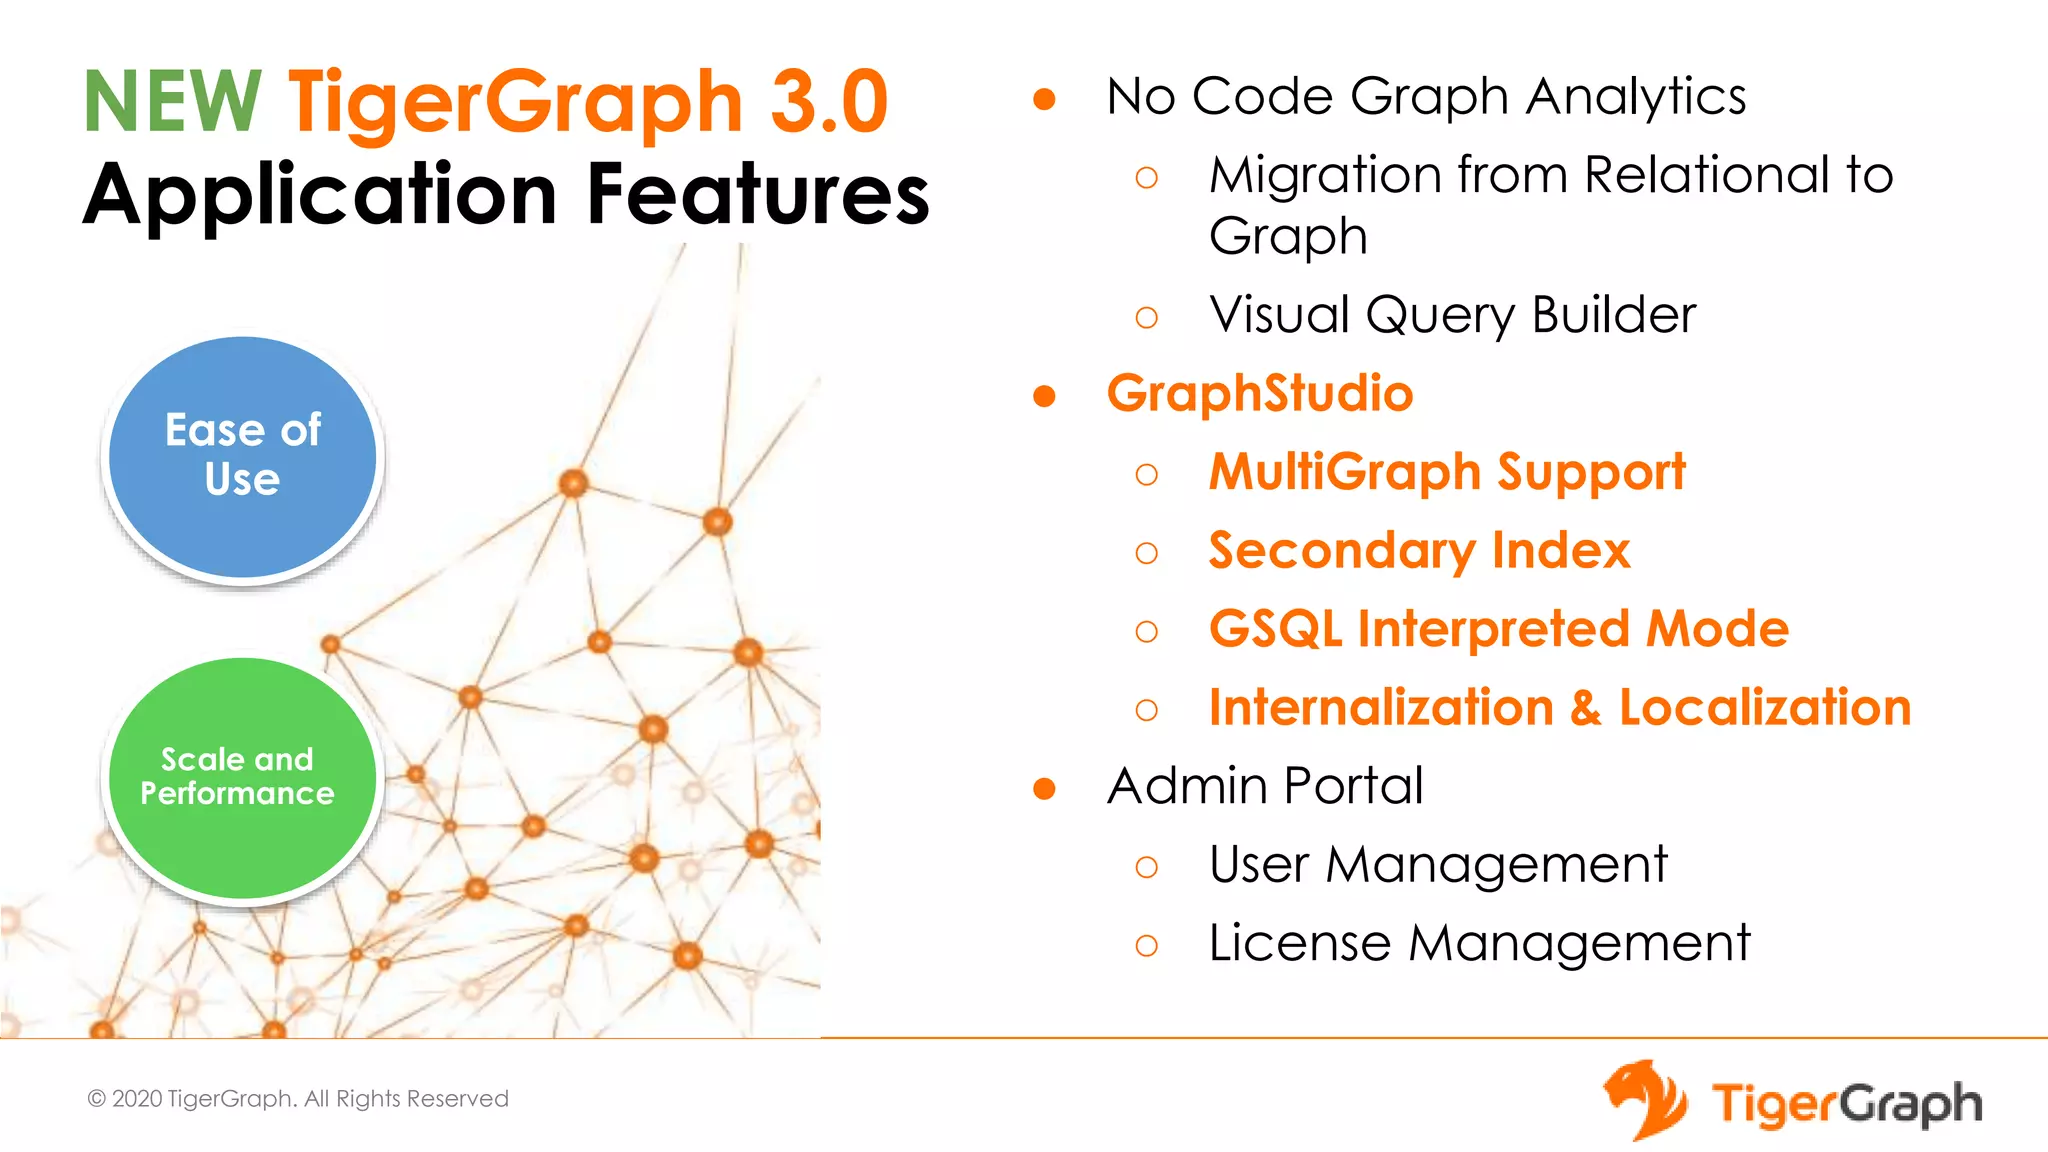
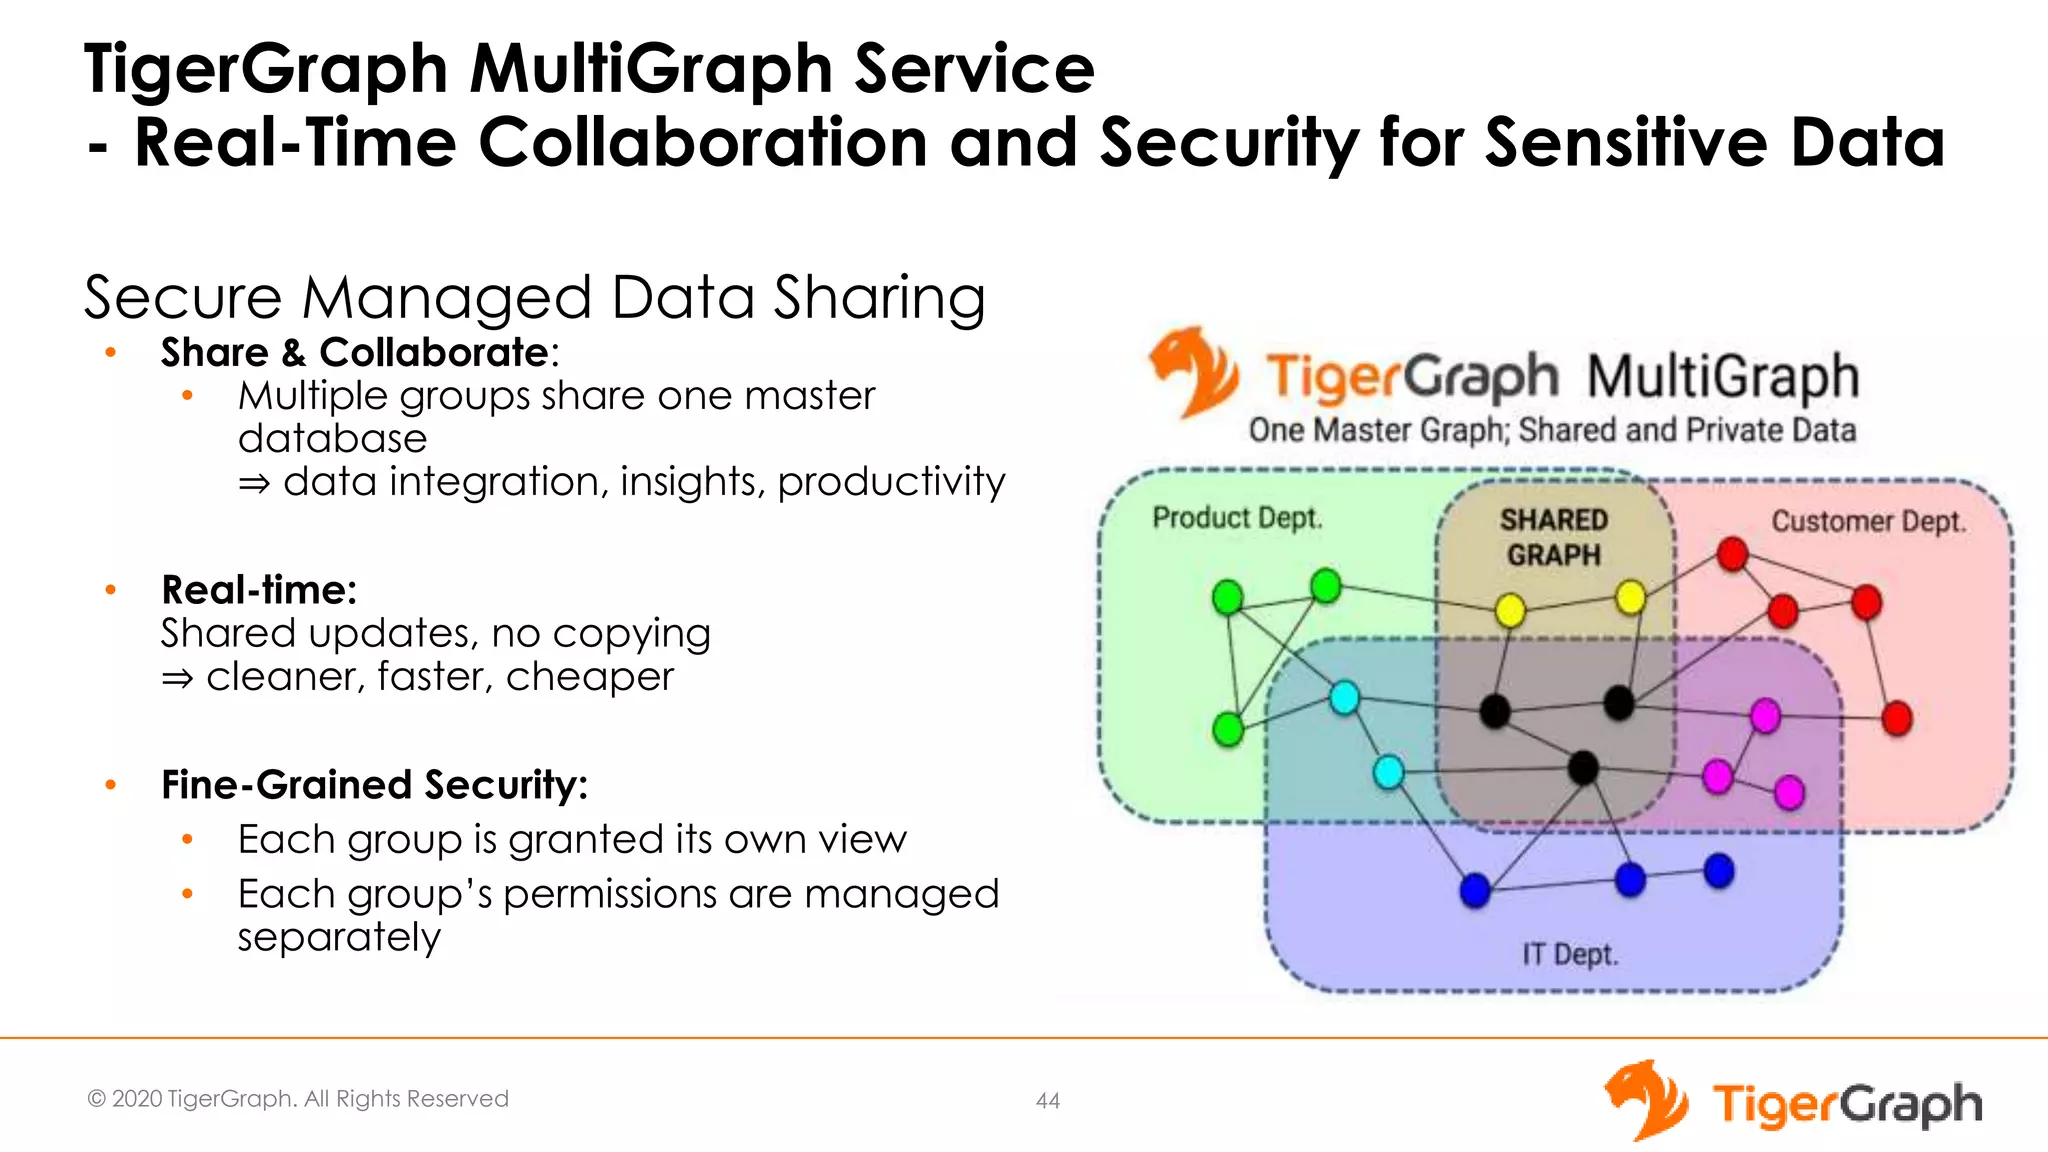
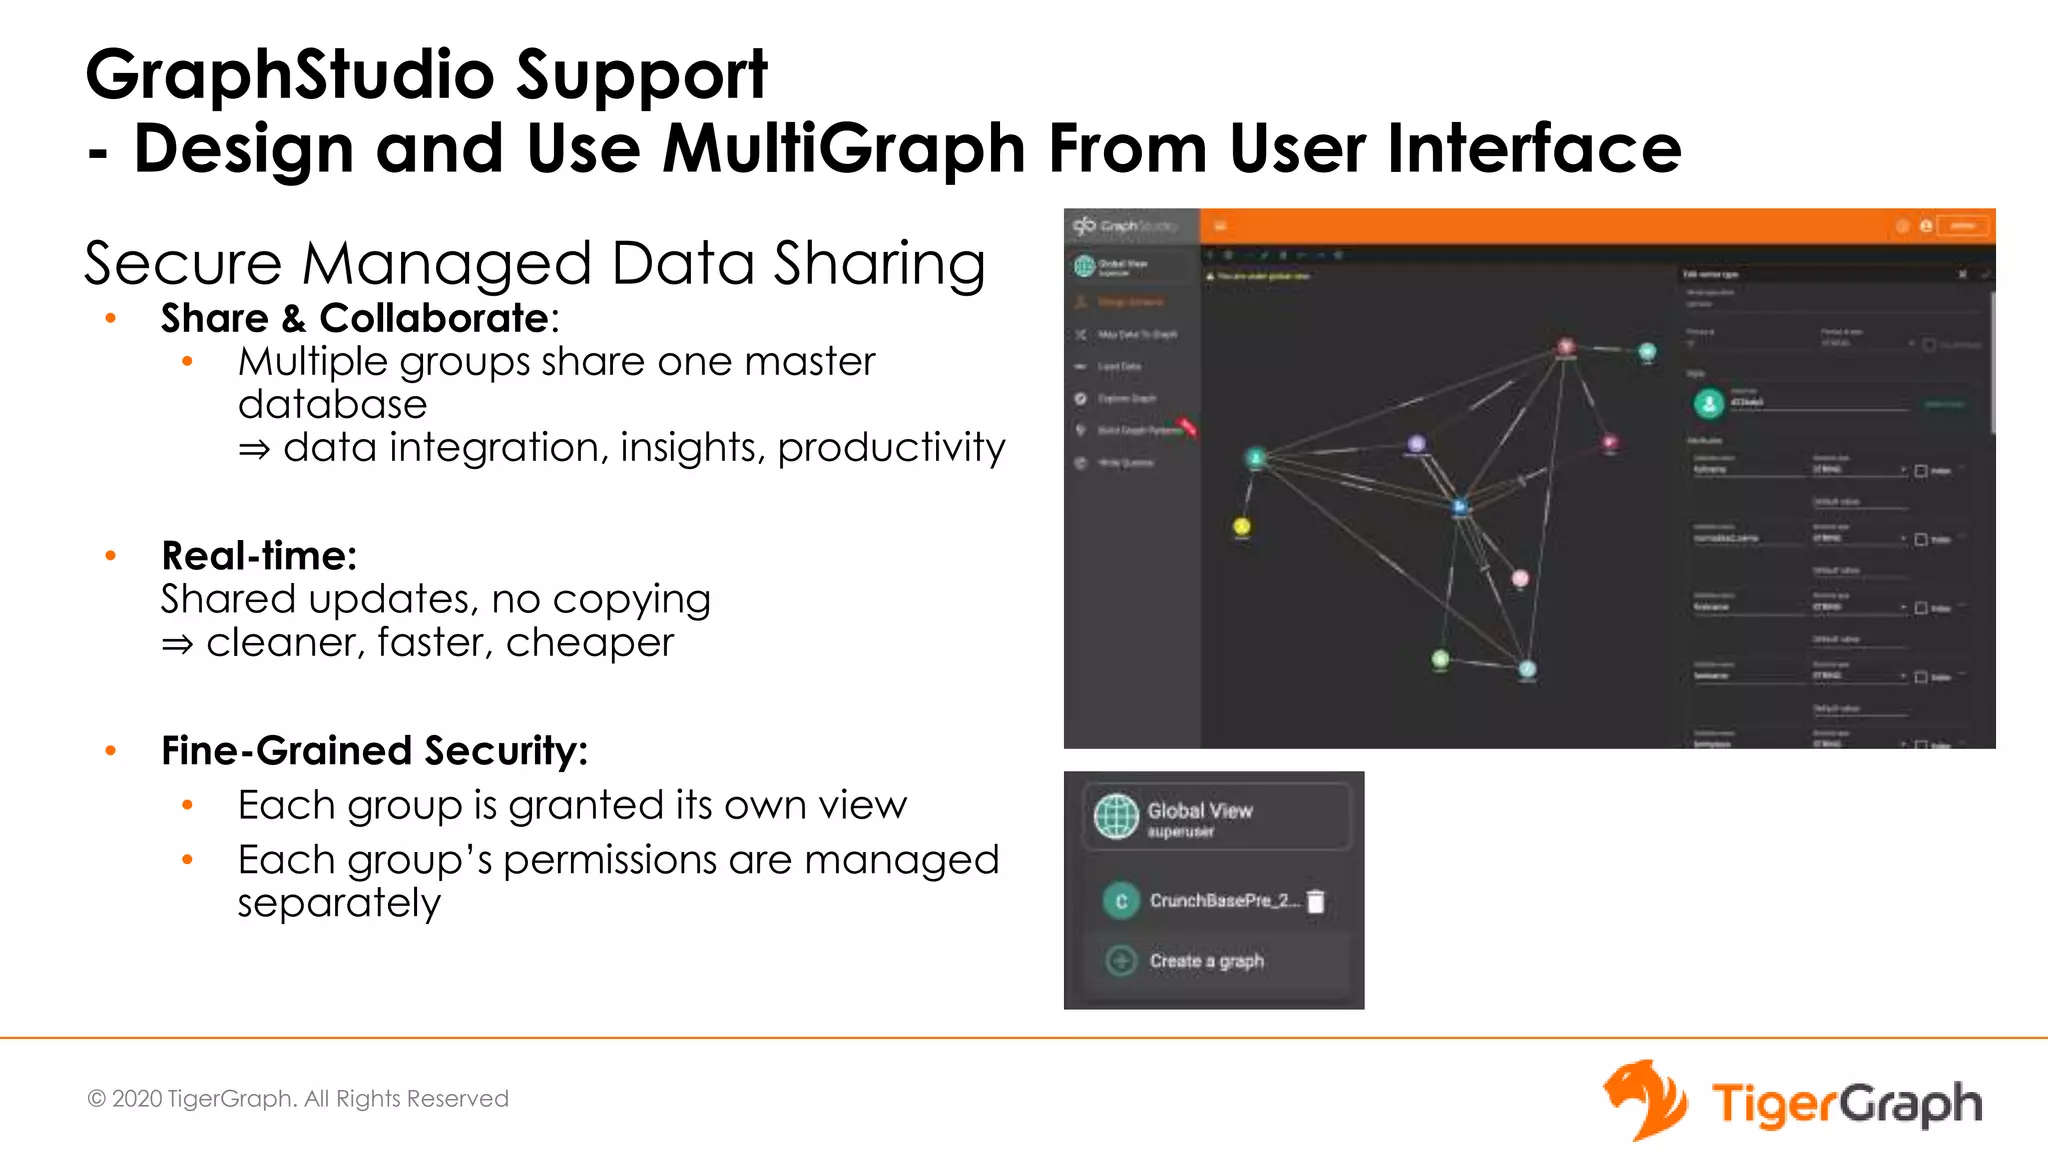
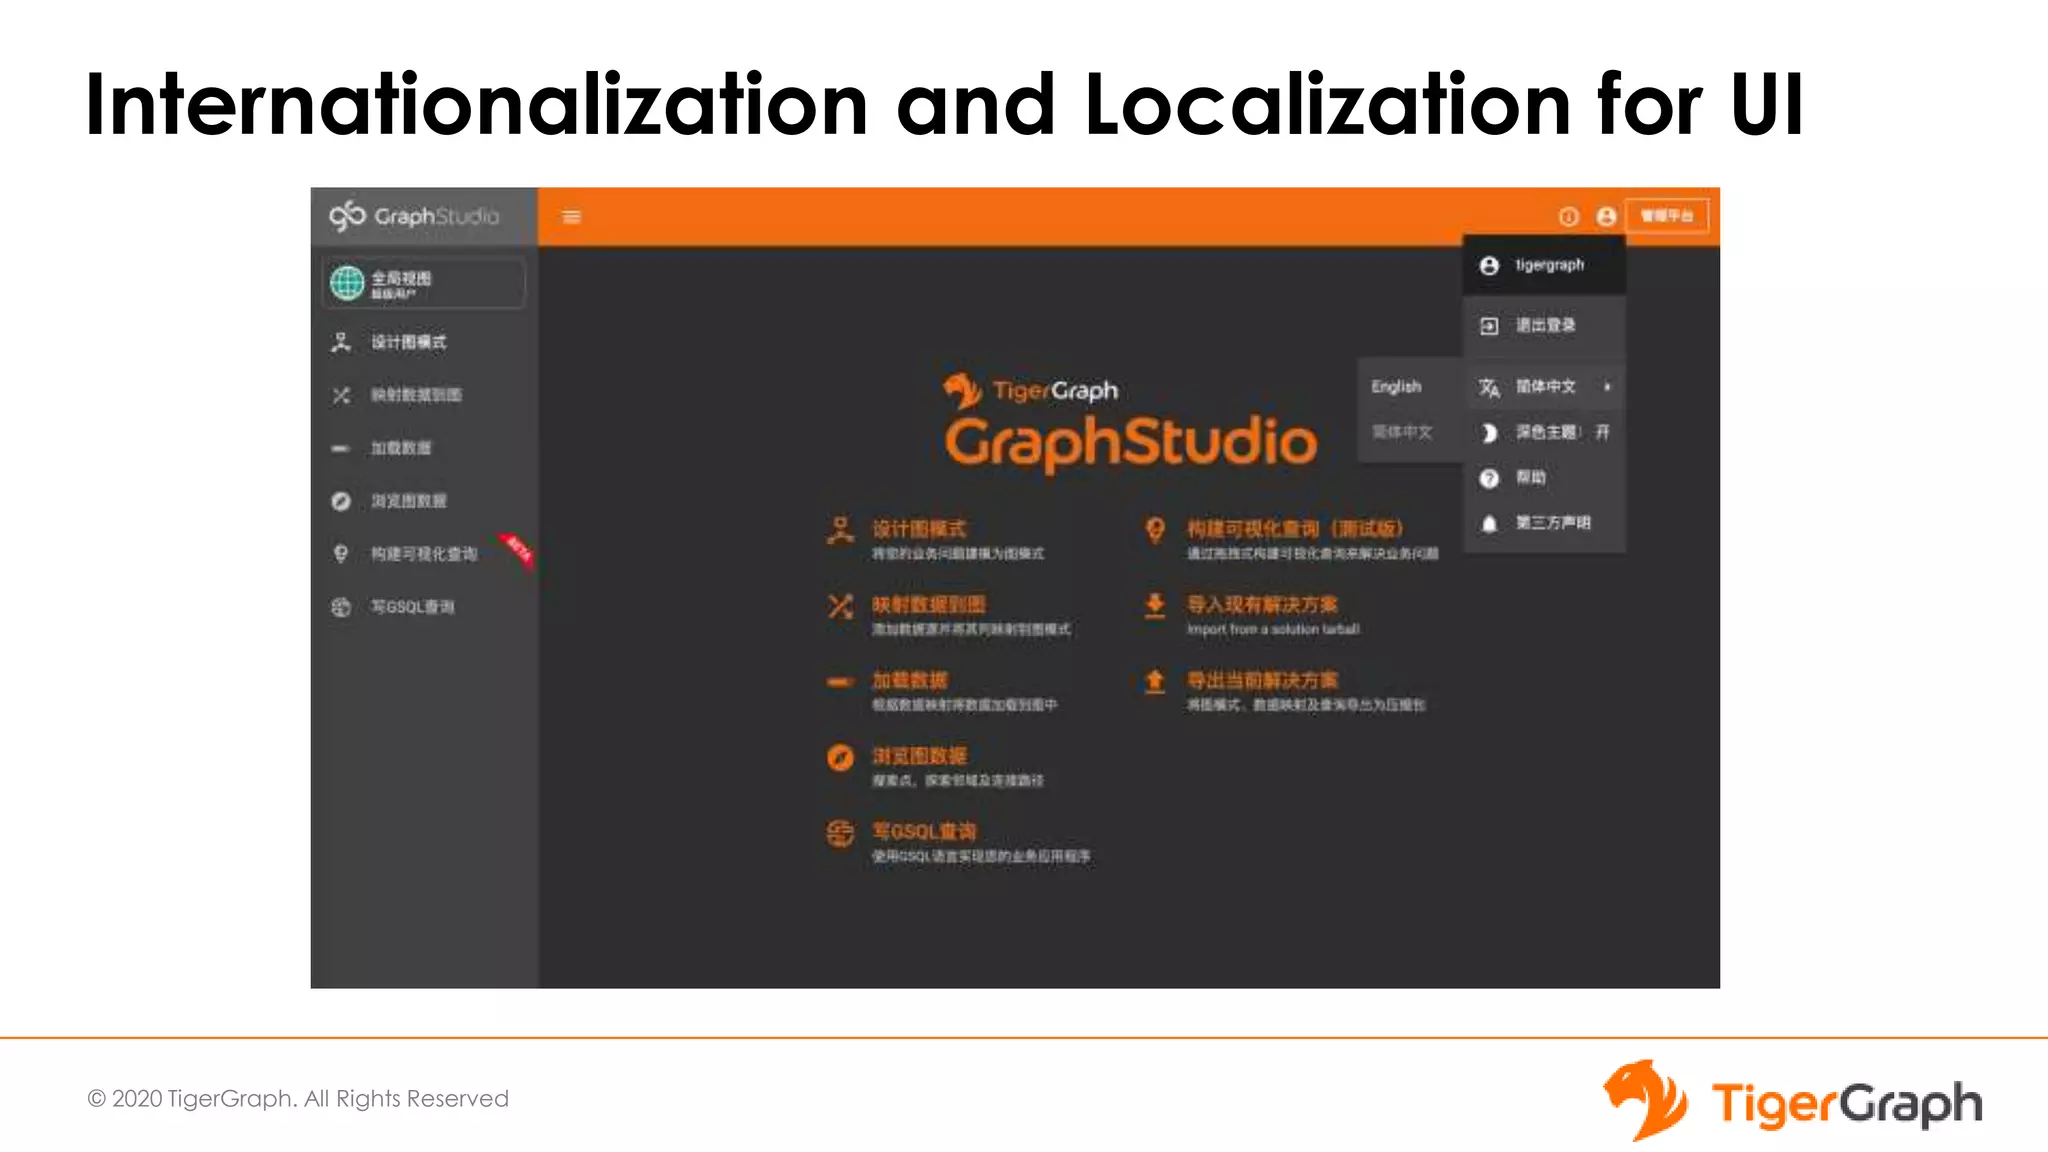
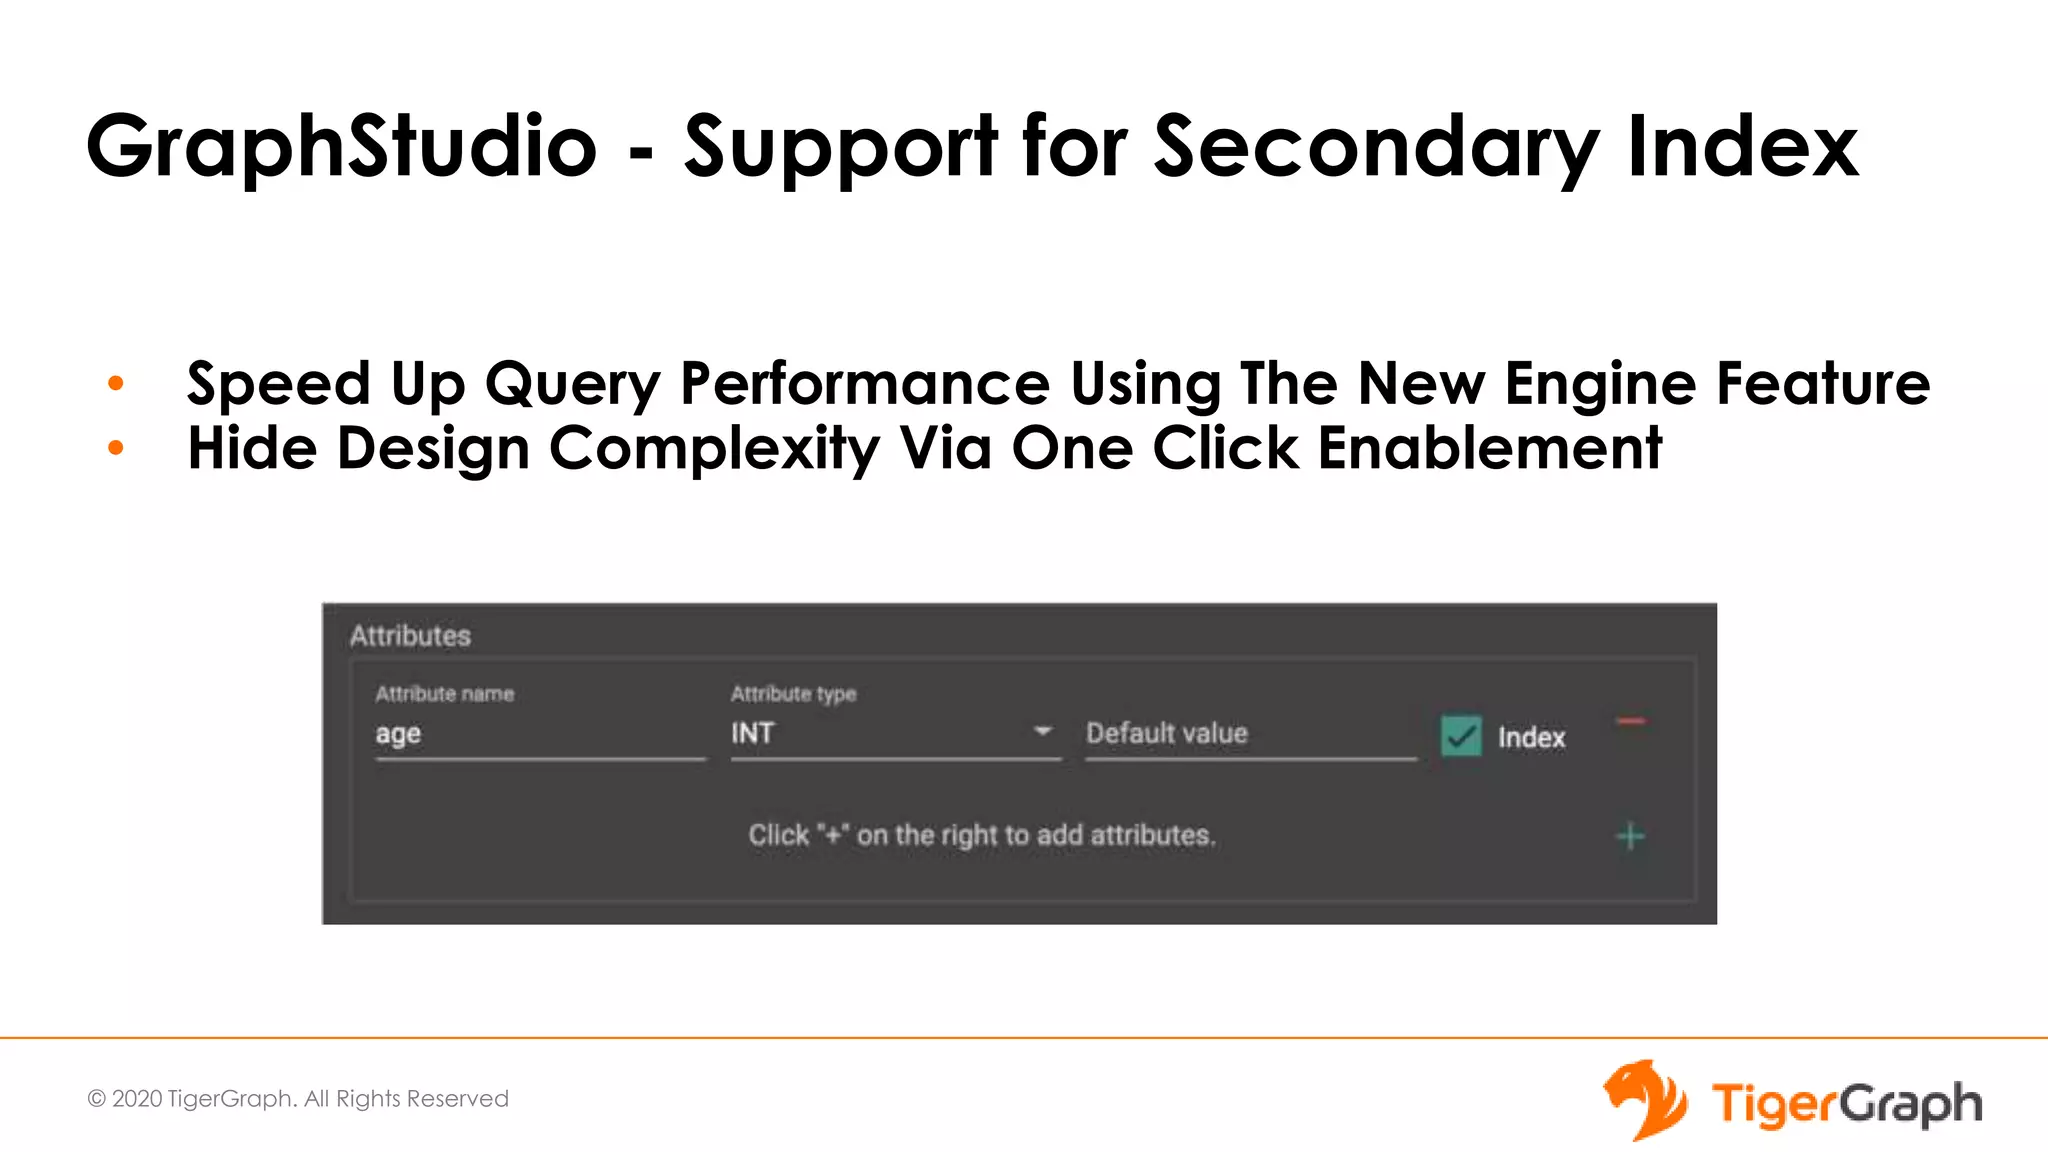
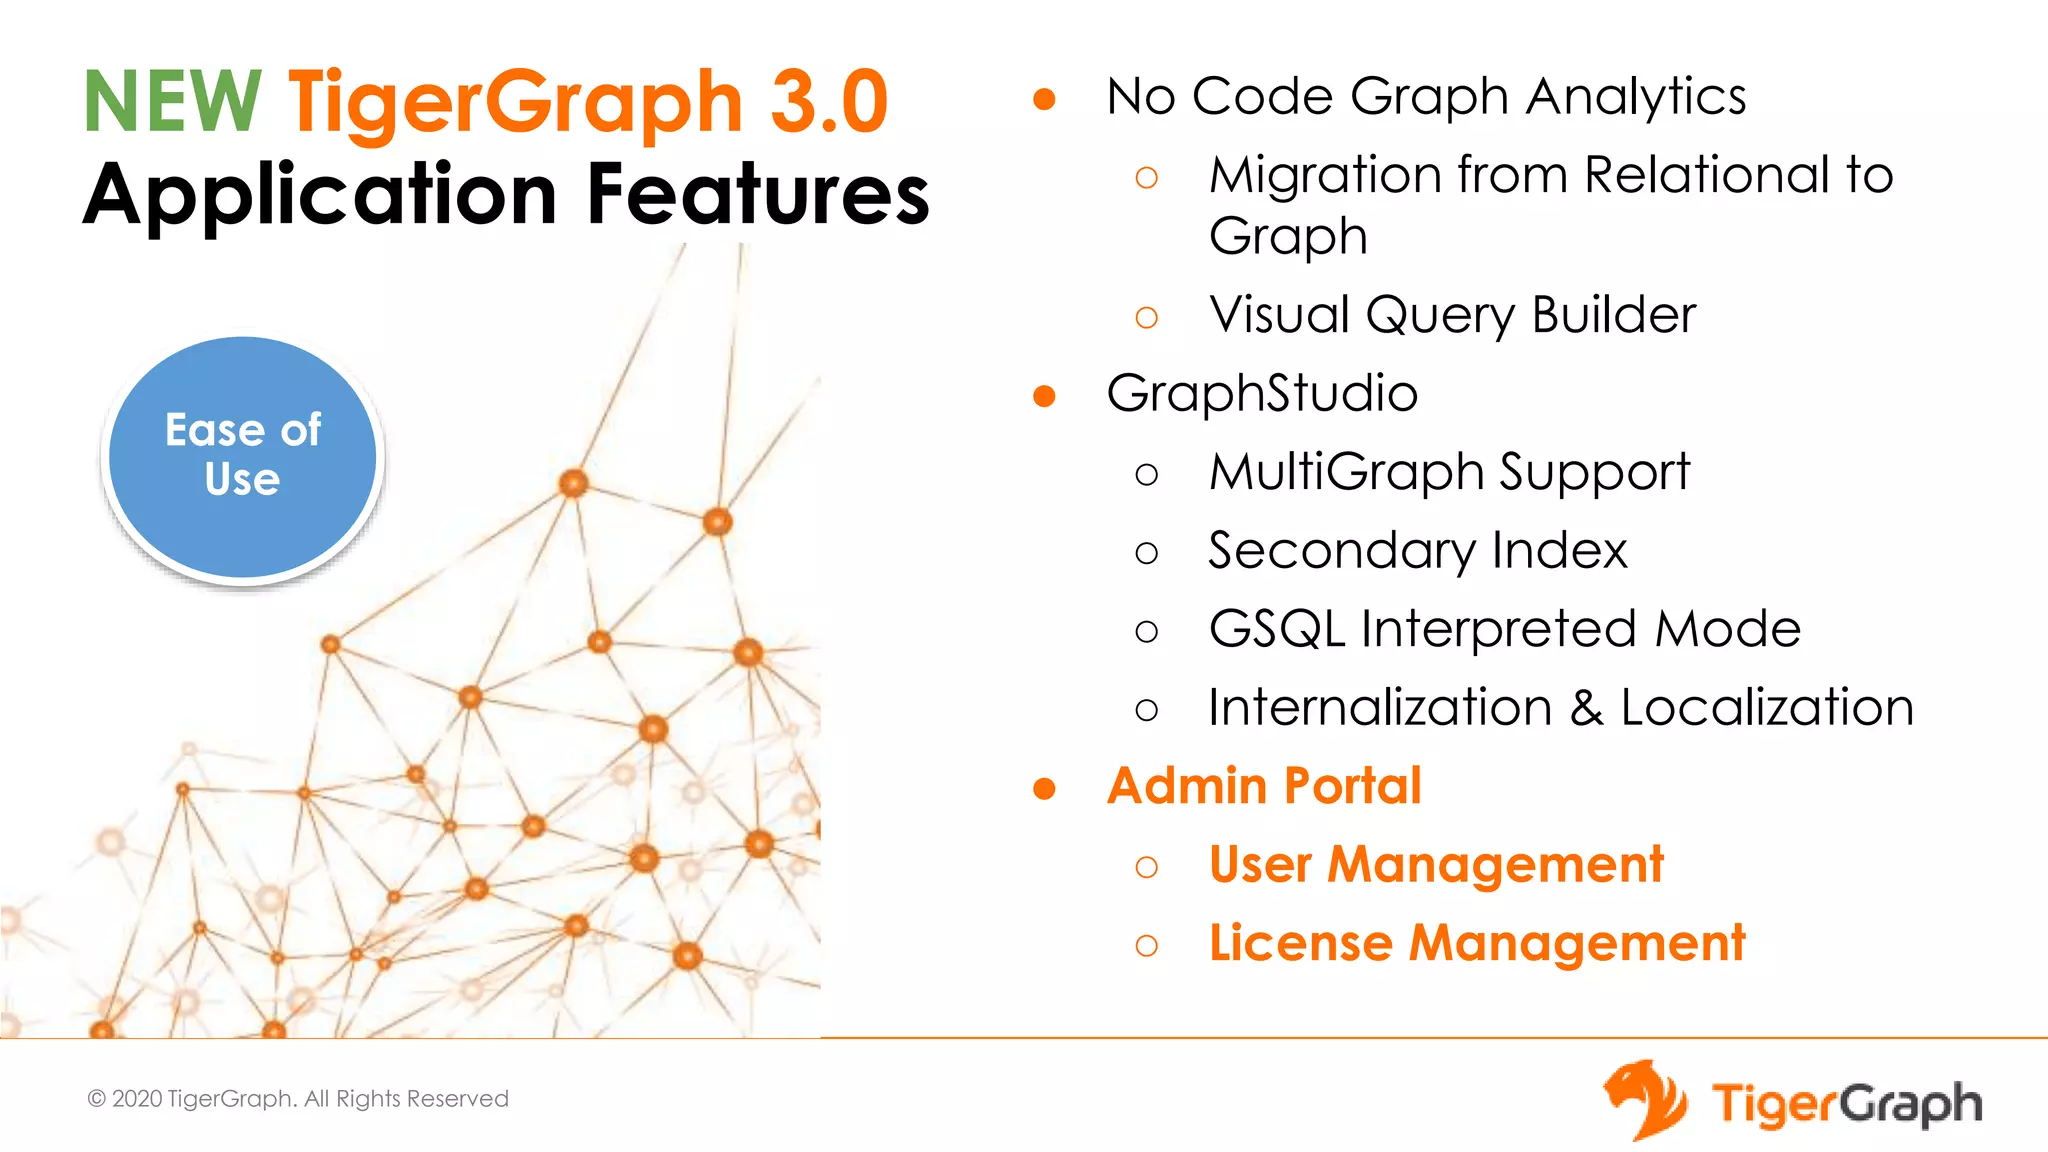
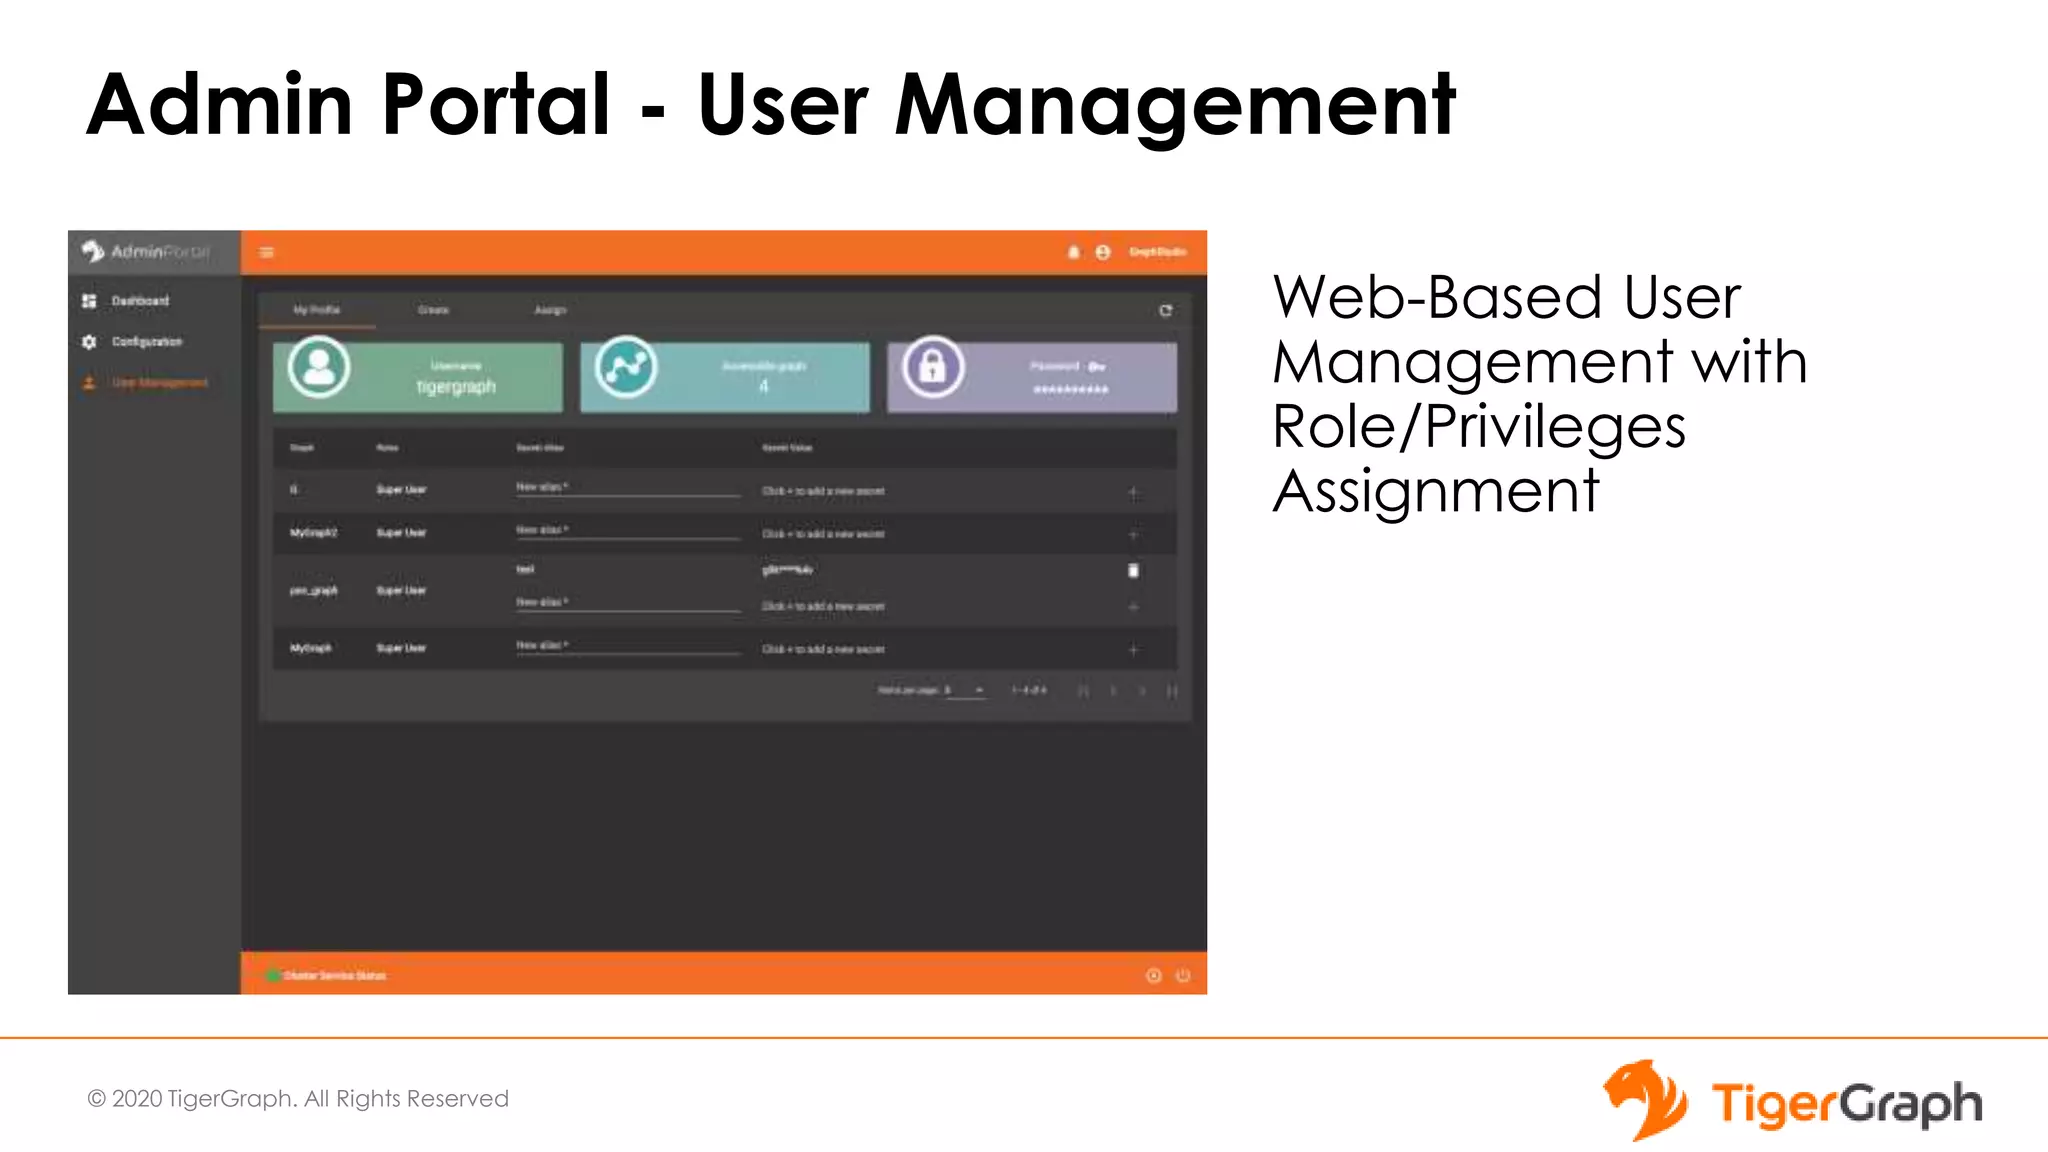
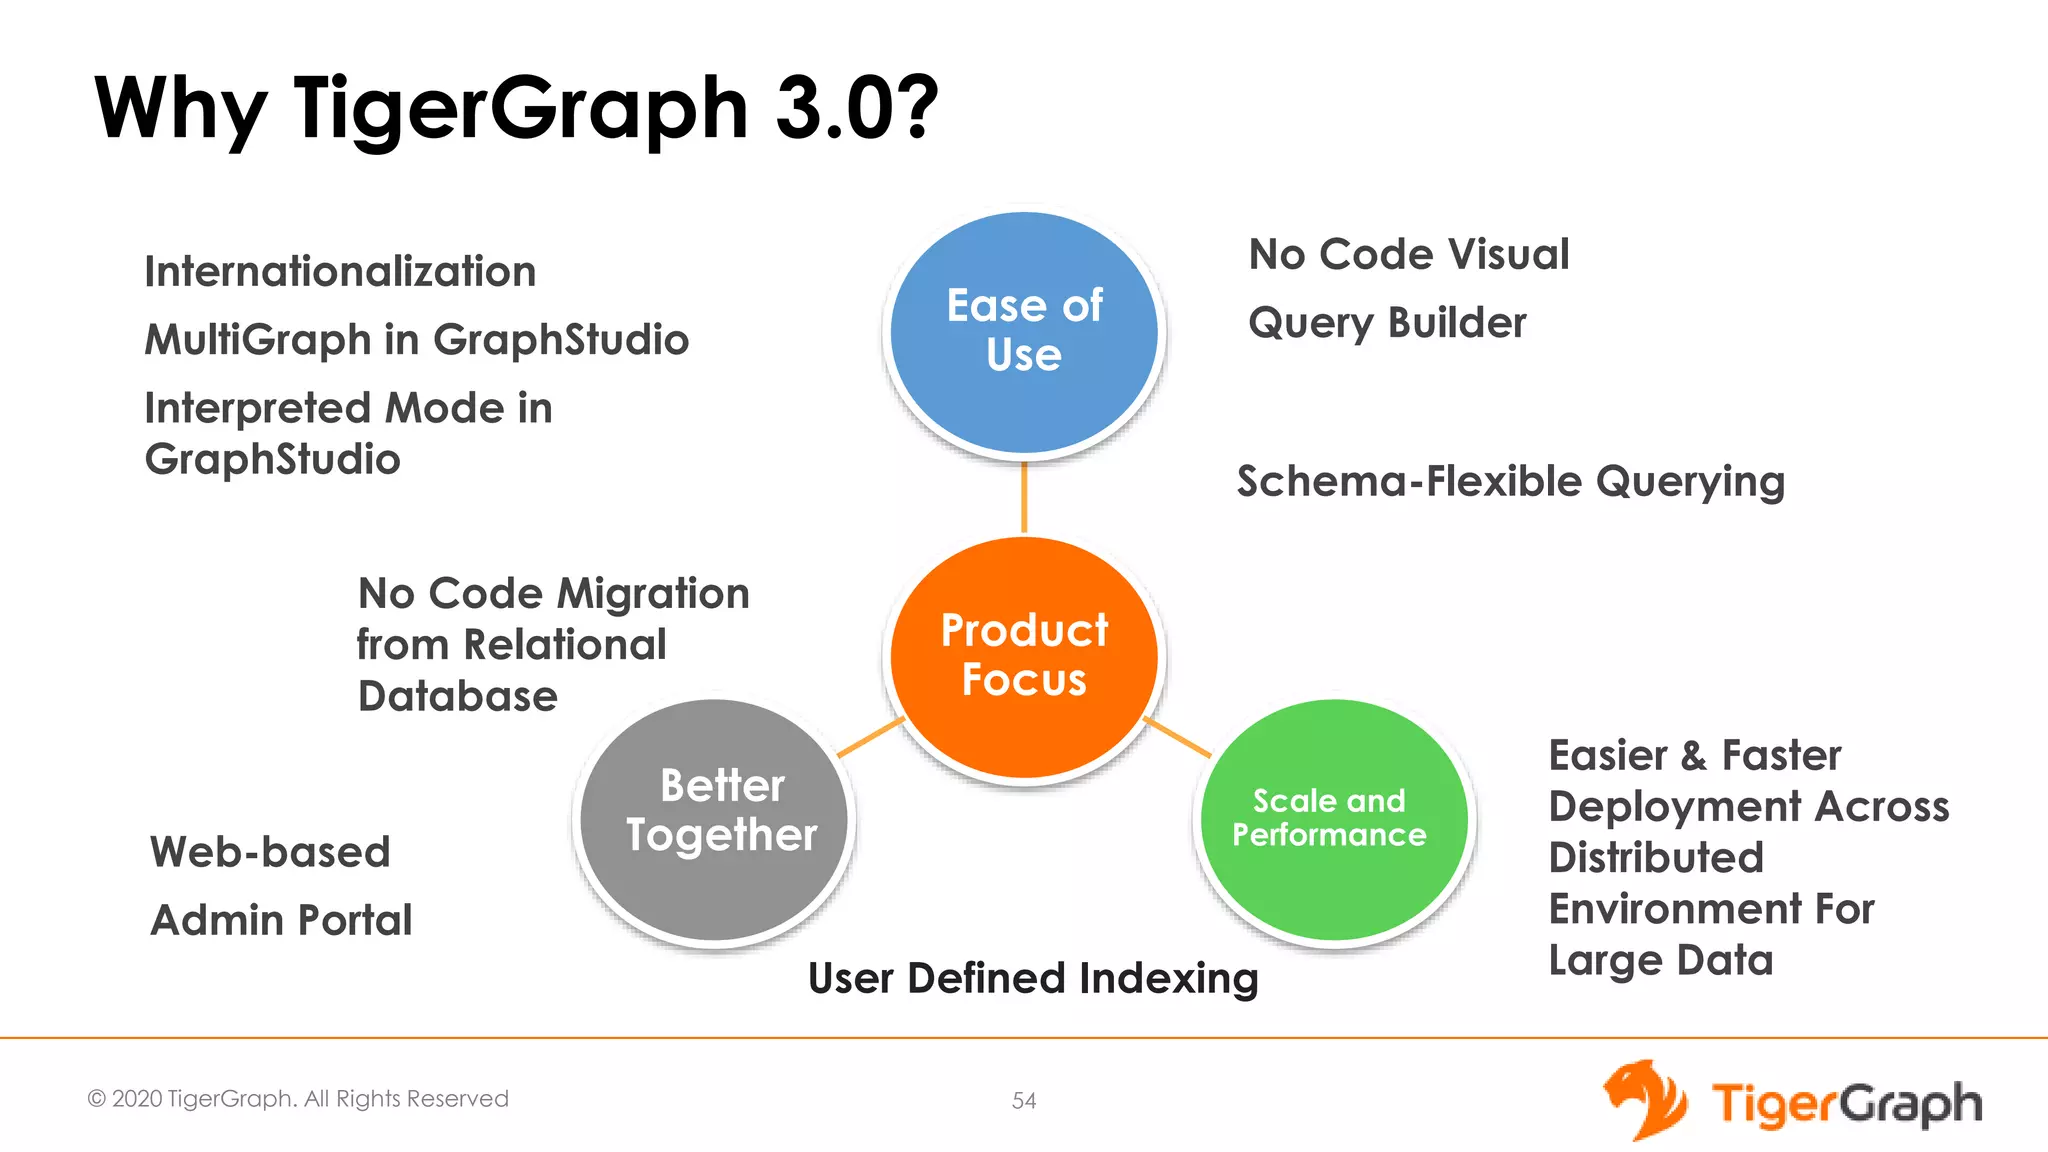


The document introduces TigerGraph 3.0, highlighting its no-code graph analytics capabilities designed for ease of use and accessibility for non-technical users. Key features include improved integration with other applications, a parallel installer for faster upgrades, and significant enhancements in query performance and database management. It also emphasizes the advantages of migrating from relational databases to graph structure to support large datasets and complex data relationships.


![Tiger graph 2021 corporate overview [read only]](https://cdn.slidesharecdn.com/ss_thumbnails/tigergraph2021corporateoverviewread-only-211014093106-thumbnail.jpg?width=640&height=640&fit=bounds)


![[DSC Europe 25] Marija Vlajkovic & Andrea Radonjanin - Integration of AI tool...](https://cdn.slidesharecdn.com/ss_thumbnails/qf1jrglttoc3bm8s3aop-final-integration-of-ai-tools-251208151905-394f3a6a-thumbnail.jpg?width=640&height=640&fit=bounds)


![[DSC Europe 25] Goran Obradovic - The Rise of Sovereign AI: Building the Regi...](https://cdn.slidesharecdn.com/ss_thumbnails/7nw2xxixrxqdxvrb5wca-6-251205085714-ab09a2ac-thumbnail.jpg?width=640&height=640&fit=bounds)

![[DSC Europe 25] Jim Sterne - Adopting Generative AI Capabilities Into the Ent...](https://cdn.slidesharecdn.com/ss_thumbnails/sxhpofuorcagxsaulkmt-3-251204082258-7e66bc48-thumbnail.jpg?width=640&height=640&fit=bounds)


![[DSC Europe 25] Max Talanov - Non digital NNs.pptx](https://cdn.slidesharecdn.com/ss_thumbnails/wif8tr3gtua74qvtopke-non-digital-nns-251205090438-26b0eea6-thumbnail.jpg?width=640&height=640&fit=bounds)