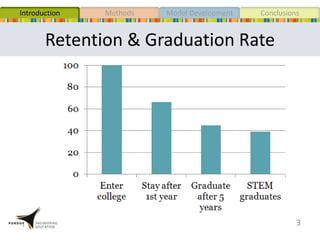
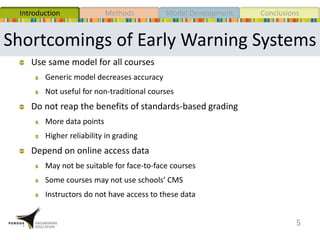
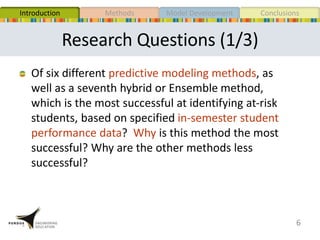
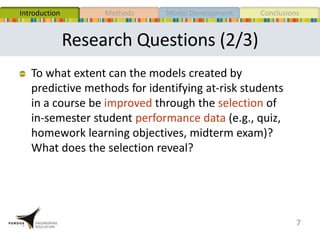
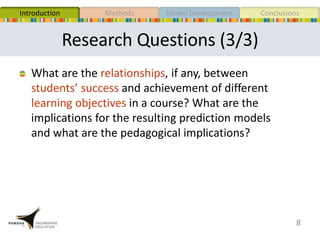
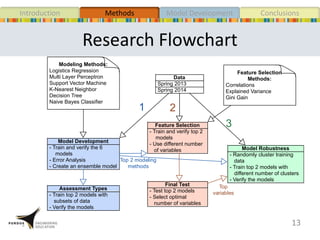
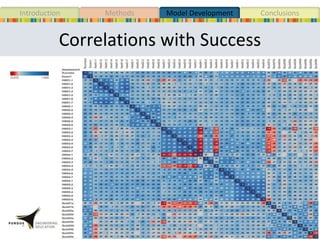
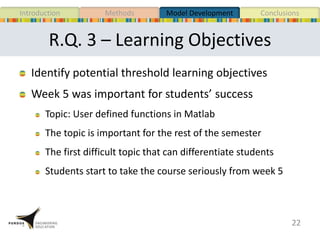
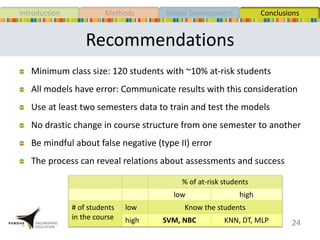
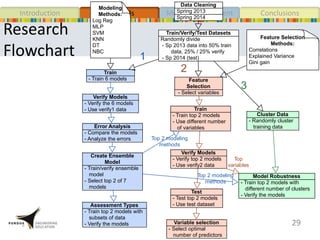
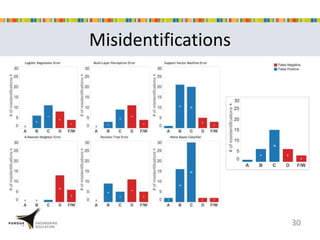
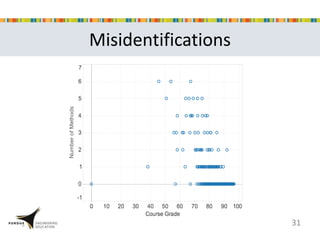
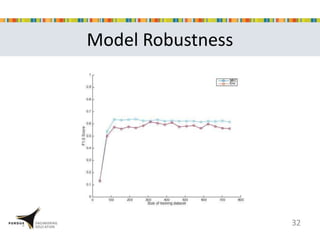
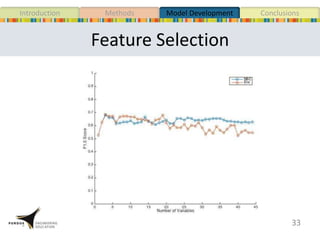
A Learning Objective-Based Model
to Predict Students’ Success
in a First-Year Engineering Course
Farshid Marbouti
Committee: Dr. Diefes-Dux, Dr. Madhavan
Dr. Main, Dr. Ohland
January 2016
INTRODUCTION
MethodsIntroduction
Retention & Graduation Rate
3
Model Development Conclusions
Solution
Analyze students’ performance data
(Huang & Fang, 2012; White, 2012)
Predict students’ success in a course and identify
at-risk students
(Jin, Imbrie, Lin, & Chen, 2011; Olani, 2009)
Use the prediction model as an early warning system
Inform both the instructor and the students of their
performance
(Arnold & Pistilli, 2012b; Essa & Hanan, 2012; Macfadyen & Dawson, 2010)
4
MethodsIntroduction Model Development Conclusions
Shortcomings of Early Warning Systems
Use same model for all courses
Generic model decreases accuracy
Not useful for non-traditional courses
Do not reap the benefits of standards-based grading
More data points
Higher reliability in grading
Depend on online access data
May not be suitable for face-to-face courses
Some courses may not use schools’ CMS
Instructors do not have access to these data
5
MethodsIntroduction Model Development Conclusions
Research Questions (1/3)
6
Of six different predictive modeling methods, as
well as a seventh hybrid or Ensemble method,
which is the most successful at identifying at-risk
students, based on specified in-semester student
performance data? Why is this method the most
successful? Why are the other methods less
successful?
MethodsIntroduction Model Development Conclusions
Research Questions (2/3)
7
To what extent can the models created by
predictive methods for identifying at-risk students
in a course be improved through the selection of
in-semester student performance data (e.g., quiz,
homework learning objectives, midterm exam)?
What does the selection reveal?
MethodsIntroduction Model Development Conclusions
Research Questions (3/3)
8
What are the relationships, if any, between
students’ success and achievement of different
learning objectives in a course? What are the
implications for the resulting prediction models
and what are the pedagogical implications?
MethodsIntroduction Model Development Conclusions
METHODS
Settings & Data
10
50% training
25% Verify1
25% Verify2
Final Test
MethodsIntroduction Model Development Conclusions
ENGR 132
Prediction Modeling Methods
11
Input
Students’ learning objective scores (HW 1-5, 33 LOs)
Students’ grades on course assessments
Quiz: Weeks 1-5, 10 grades
Written Exam 1 (Midterm Exam): 1 grade
Output
At-risk (positive)
Successful (negative)
MethodsIntroduction Model Development Conclusions
Evaluating the Models
12
MethodsIntroduction Model Development Conclusions
Research Flowchart
13
MethodsIntroduction Model Development Conclusions
Spring 2014
Spring 2013
Data
Modeling Methods:
Logistics Regression
Multi Layer Perceptron
Support Vector Machine
K-Nearest Neighbor
Decision Tree
Naive Bayes Classifier
- Train and verify the 6
models
- Error Analysis
- Create an ensemble model
Model Development
- Train and verify top 2
models
- Use different number
of variables
Feature Selection
- Test top 2 models
- Select optimal
number of variables
Final Test
- Randomly cluster training
data
- Train top 2 models with
different number of clusters
- Verify the models
Model Robustness
- Train top 2 models with
subsets of data
- Verify the models
Assessment Types
Feature Selection
Methods:
Correlations
Explained Variance
Gini Gain
1 2
3
Top
variables
Top 2 modeling
methods
MODEL DEVELOPMENT
Training and Verifying the Models
15
MethodsIntroduction Model Development Conclusions
Ensemble Model
16
KNN, SVM, NBC
MethodsIntroduction Model Development Conclusions
R.Q. 1 – Best Prediction Model(s)
NBC & Ensemble
Low % of students fail -> small sample size
Bias: Inaccurate assumptions in the learning algorithm
Variance: Sensitivity of the model to small changes
Models with high bias/low variance perform better
17
MethodsIntroduction Model Development Conclusions
Predictive Power of Assessments
18
MethodsIntroduction Model Development Conclusions
Feature Selection - Final Test
19
MethodsIntroduction Model Development Conclusions
R.Q. 2 – Data Selection
Models with only two variables
Simple models have high bias/low variance
20
MethodsIntroduction Model Development Conclusions
Correlations with Success
21
MethodsIntroduction Model Development Conclusions
R.Q. 3 – Learning Objectives
Identify potential threshold learning objectives
Week 5 was important for students’ success
Topic: User defined functions in Matlab
The topic is important for the rest of the semester
The first difficult topic that can differentiate students
Students start to take the course seriously from week 5
22
MethodsIntroduction Model Development Conclusions
CONCLUSIONS
23
Recommendations
Minimum class size: 120 students with ~10% at-risk students
All models have error: Communicate results with this consideration
Use at least two semesters data to train and test the models
No drastic change in course structure from one semester to another
Be mindful about false negative (type II) error
The process can reveal relations about assessments and success
24
% of at-risk students
low high
# of students
in the course
low Know the students
high SVM, NBC KNN, DT, MLP
MethodsIntroduction Model Development Conclusions
Limitations
Models Errors
Pedagogical decisions (e.g. only HW was graded by SBG)
Quality of performance data
Mid-size classes (40-120)
25
MethodsIntroduction Model Development Conclusions
Future Work
How to use the models?
Predict students performance during the semester
Investigate what leads students to success in a course
26
MethodsIntroduction Model Development Conclusions
Thank You…
 My Advisers Dr. Diefes-Dux & Dr. Madhavan
 My committee members: Dr. Ohland and Dr. Main
 My wife
 Friends who were part of my journey
Questions?
Research
Flowchart
29
MethodsIntroduction Model Development ConclusionsSpring 2014
Spring 2013
Data Cleaning
Randomly divide
- Sp 2013 data into 50% train
data, 25% / 25% verify
- Sp 2014 (test)
Train/Verify/Test Datasets
Modeling
Methods:
Log Reg
MLP
SVM
KNN
DT
NBC
- Train 6 models
Train
- Select variables
Feature
Selection
- Verify the 6 models
- Use verify1 data
Verify Models
- Compare the models
- Analyze the errors
Error Analysis
- Train/verify ensemble
model
- Select top 2 of 7
models
Create Ensemble
Model
- Train top 2 models
- Use different number
of variables
Train
- Test top 2 models
- Use test dataset
Test
- Train top 2 models with
different number of clusters
- Verify the models
Model Robustness
- Train top 2 models with
subsets of data
- Verify the models
Assessment Types
- Randomly cluster
training data
Cluster Data
- Verify top 2 models
- Use verify2 data
Verify Models
- Select optimal
number of predictors
Variable selection
Feature Selection
Methods:
Correlations
Explained Variance
Gini gain
1
2
3
Top 2 modeling
methods
Top
variables
Top 2 modeling
methods
Misidentifications
30
Misidentifications
31
Model Robustness
32
Feature Selection
33
MethodsIntroduction Model Development Conclusions
LO
Correlations
34

Farshid_Defense

  • 1.
    A Learning Objective-BasedModel to Predict Students’ Success in a First-Year Engineering Course Farshid Marbouti Committee: Dr. Diefes-Dux, Dr. Madhavan Dr. Main, Dr. Ohland January 2016
  • 2.
  • 3.
    MethodsIntroduction Retention & GraduationRate 3 Model Development Conclusions
  • 4.
    Solution Analyze students’ performancedata (Huang & Fang, 2012; White, 2012) Predict students’ success in a course and identify at-risk students (Jin, Imbrie, Lin, & Chen, 2011; Olani, 2009) Use the prediction model as an early warning system Inform both the instructor and the students of their performance (Arnold & Pistilli, 2012b; Essa & Hanan, 2012; Macfadyen & Dawson, 2010) 4 MethodsIntroduction Model Development Conclusions
  • 5.
    Shortcomings of EarlyWarning Systems Use same model for all courses Generic model decreases accuracy Not useful for non-traditional courses Do not reap the benefits of standards-based grading More data points Higher reliability in grading Depend on online access data May not be suitable for face-to-face courses Some courses may not use schools’ CMS Instructors do not have access to these data 5 MethodsIntroduction Model Development Conclusions
  • 6.
    Research Questions (1/3) 6 Ofsix different predictive modeling methods, as well as a seventh hybrid or Ensemble method, which is the most successful at identifying at-risk students, based on specified in-semester student performance data? Why is this method the most successful? Why are the other methods less successful? MethodsIntroduction Model Development Conclusions
  • 7.
    Research Questions (2/3) 7 Towhat extent can the models created by predictive methods for identifying at-risk students in a course be improved through the selection of in-semester student performance data (e.g., quiz, homework learning objectives, midterm exam)? What does the selection reveal? MethodsIntroduction Model Development Conclusions
  • 8.
    Research Questions (3/3) 8 Whatare the relationships, if any, between students’ success and achievement of different learning objectives in a course? What are the implications for the resulting prediction models and what are the pedagogical implications? MethodsIntroduction Model Development Conclusions
  • 9.
  • 10.
    Settings & Data 10 50%training 25% Verify1 25% Verify2 Final Test MethodsIntroduction Model Development Conclusions ENGR 132
  • 11.
    Prediction Modeling Methods 11 Input Students’learning objective scores (HW 1-5, 33 LOs) Students’ grades on course assessments Quiz: Weeks 1-5, 10 grades Written Exam 1 (Midterm Exam): 1 grade Output At-risk (positive) Successful (negative) MethodsIntroduction Model Development Conclusions
  • 12.
    Evaluating the Models 12 MethodsIntroductionModel Development Conclusions
  • 13.
    Research Flowchart 13 MethodsIntroduction ModelDevelopment Conclusions Spring 2014 Spring 2013 Data Modeling Methods: Logistics Regression Multi Layer Perceptron Support Vector Machine K-Nearest Neighbor Decision Tree Naive Bayes Classifier - Train and verify the 6 models - Error Analysis - Create an ensemble model Model Development - Train and verify top 2 models - Use different number of variables Feature Selection - Test top 2 models - Select optimal number of variables Final Test - Randomly cluster training data - Train top 2 models with different number of clusters - Verify the models Model Robustness - Train top 2 models with subsets of data - Verify the models Assessment Types Feature Selection Methods: Correlations Explained Variance Gini Gain 1 2 3 Top variables Top 2 modeling methods
  • 14.
  • 15.
    Training and Verifyingthe Models 15 MethodsIntroduction Model Development Conclusions
  • 16.
    Ensemble Model 16 KNN, SVM,NBC MethodsIntroduction Model Development Conclusions
  • 17.
    R.Q. 1 –Best Prediction Model(s) NBC & Ensemble Low % of students fail -> small sample size Bias: Inaccurate assumptions in the learning algorithm Variance: Sensitivity of the model to small changes Models with high bias/low variance perform better 17 MethodsIntroduction Model Development Conclusions
  • 18.
    Predictive Power ofAssessments 18 MethodsIntroduction Model Development Conclusions
  • 19.
    Feature Selection -Final Test 19 MethodsIntroduction Model Development Conclusions
  • 20.
    R.Q. 2 –Data Selection Models with only two variables Simple models have high bias/low variance 20 MethodsIntroduction Model Development Conclusions
  • 21.
  • 22.
    R.Q. 3 –Learning Objectives Identify potential threshold learning objectives Week 5 was important for students’ success Topic: User defined functions in Matlab The topic is important for the rest of the semester The first difficult topic that can differentiate students Students start to take the course seriously from week 5 22 MethodsIntroduction Model Development Conclusions
  • 23.
  • 24.
    Recommendations Minimum class size:120 students with ~10% at-risk students All models have error: Communicate results with this consideration Use at least two semesters data to train and test the models No drastic change in course structure from one semester to another Be mindful about false negative (type II) error The process can reveal relations about assessments and success 24 % of at-risk students low high # of students in the course low Know the students high SVM, NBC KNN, DT, MLP MethodsIntroduction Model Development Conclusions
  • 25.
    Limitations Models Errors Pedagogical decisions(e.g. only HW was graded by SBG) Quality of performance data Mid-size classes (40-120) 25 MethodsIntroduction Model Development Conclusions
  • 26.
    Future Work How touse the models? Predict students performance during the semester Investigate what leads students to success in a course 26 MethodsIntroduction Model Development Conclusions
  • 27.
    Thank You…  MyAdvisers Dr. Diefes-Dux & Dr. Madhavan  My committee members: Dr. Ohland and Dr. Main  My wife  Friends who were part of my journey
  • 28.
  • 29.
    Research Flowchart 29 MethodsIntroduction Model DevelopmentConclusionsSpring 2014 Spring 2013 Data Cleaning Randomly divide - Sp 2013 data into 50% train data, 25% / 25% verify - Sp 2014 (test) Train/Verify/Test Datasets Modeling Methods: Log Reg MLP SVM KNN DT NBC - Train 6 models Train - Select variables Feature Selection - Verify the 6 models - Use verify1 data Verify Models - Compare the models - Analyze the errors Error Analysis - Train/verify ensemble model - Select top 2 of 7 models Create Ensemble Model - Train top 2 models - Use different number of variables Train - Test top 2 models - Use test dataset Test - Train top 2 models with different number of clusters - Verify the models Model Robustness - Train top 2 models with subsets of data - Verify the models Assessment Types - Randomly cluster training data Cluster Data - Verify top 2 models - Use verify2 data Verify Models - Select optimal number of predictors Variable selection Feature Selection Methods: Correlations Explained Variance Gini gain 1 2 3 Top 2 modeling methods Top variables Top 2 modeling methods
  • 30.
  • 31.
  • 32.
  • 33.
  • 34.