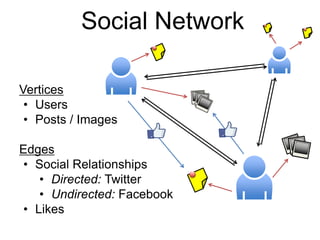
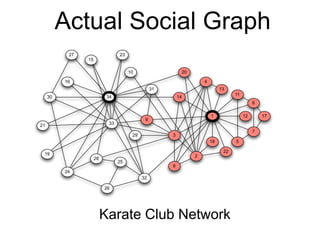
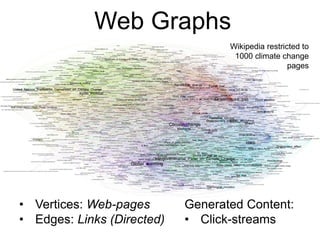
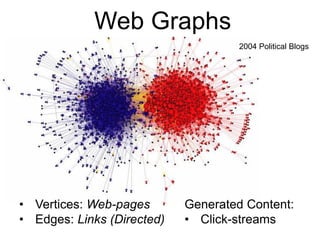
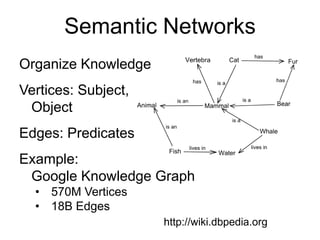
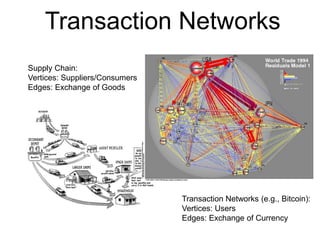
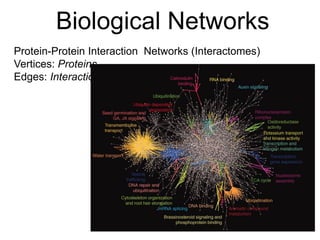
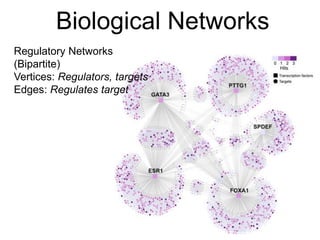
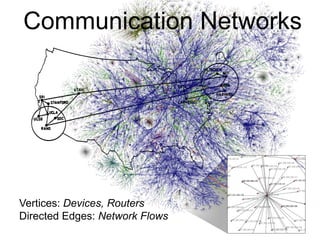
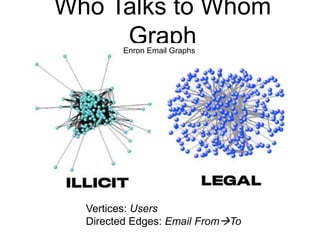
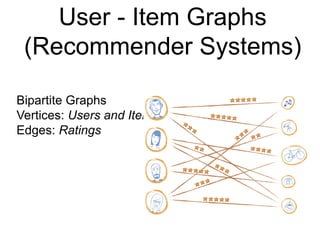
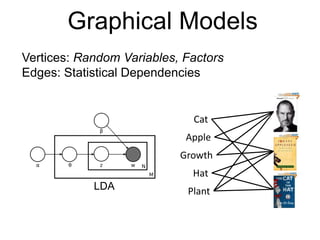
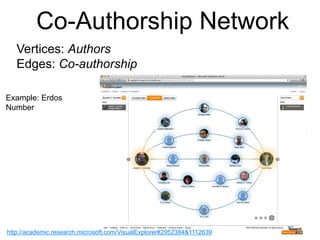
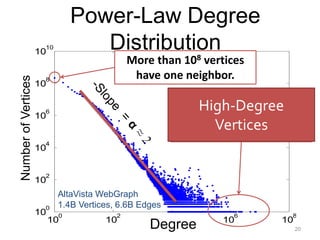
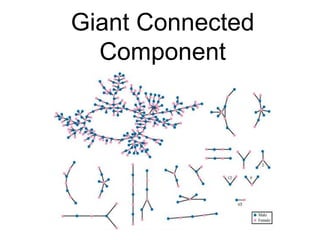
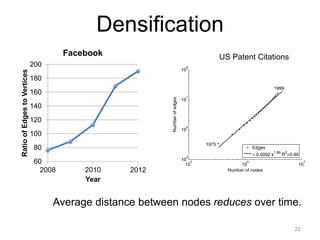
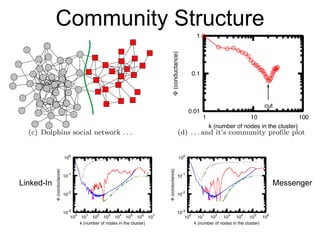
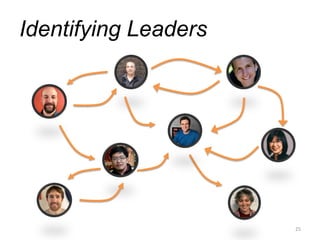
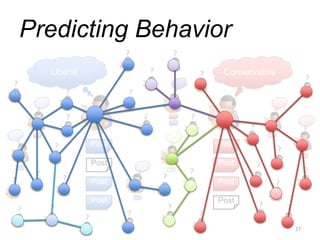
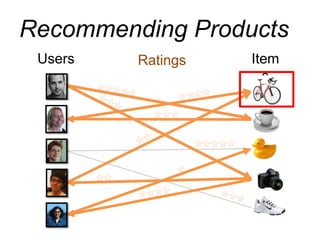
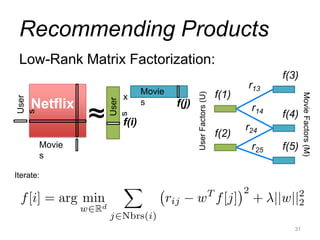
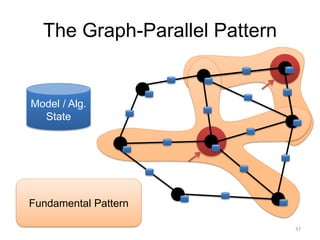
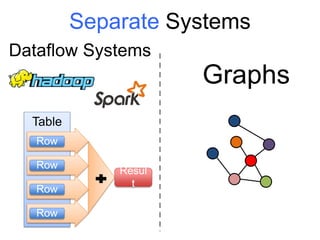
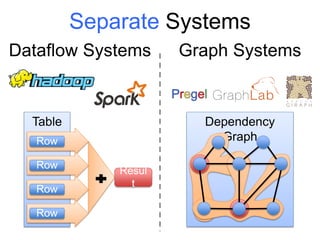
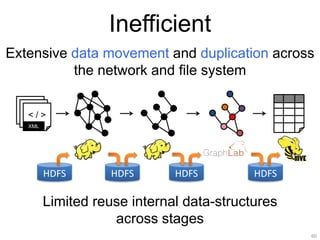
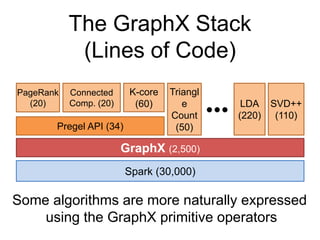
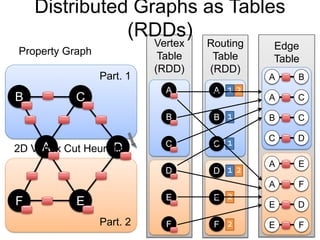
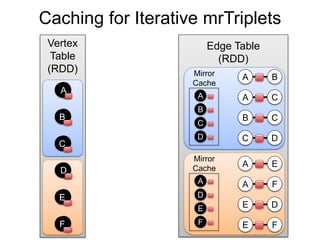
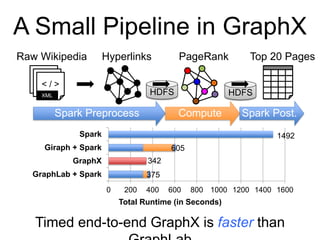
This document provides an introduction and overview of graph analytics and graph structured data. It discusses how graph data arises naturally from many real-world domains such as social networks, web graphs, and biological networks. It also outlines some common properties of graph data derived from natural phenomena, such as power-law degree distributions and community structure. Finally, it introduces common graph algorithms, graph processing systems, and the GraphX graph computation framework in Apache Spark.


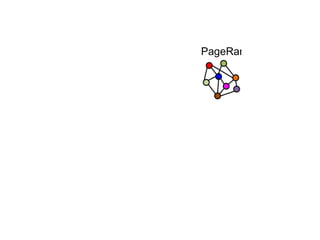
![PageRank (Centrality
Measures)
Recursive Relationship:
Where:
»α is the random reset probability (typically 0.15)
»L[j] is the number of links on page j
1 32
4 65
http://ilpubs.stanford.edu:8090/422/1/1999-66.pdf](https://image.slidesharecdn.com/f14lec12graphs-180414040251/85/F14-lec12graphs-26-320.jpg)
![Profile
Label Propagation
(Structured Prediction)
Social Arithmetic:
Recurrence Algorithm:
» iterate until convergence
Sue Ann
Carlos
Me
50% What I list on my profile
40% Sue Ann Likes
10% Carlos Like
40%
10%
50%
80% Cameras
20% Biking
30% Cameras
70% Biking
50% Cameras
50% Biking
I Like:
+
60% Cameras, 40% Biking
Likes[i]= Wij ´ Likes[ j]
jÎFriends[i]
å
http://www.cs.cmu.edu/~zhuxj/pub/CMU-CALD-02-107.pdf](https://image.slidesharecdn.com/f14lec12graphs-180414040251/85/F14-lec12graphs-28-320.jpg)
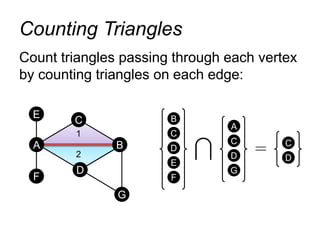
![Count triangles passing through each
vertex:
Measure “cohesiveness” of local community
1
2 3
4
Finding Communities
ClusterCoeff[i] =
2 * #Triangles[i]
Deg[i] * (Deg[i] – 1)](https://image.slidesharecdn.com/f14lec12graphs-180414040251/85/F14-lec12graphs-31-320.jpg)
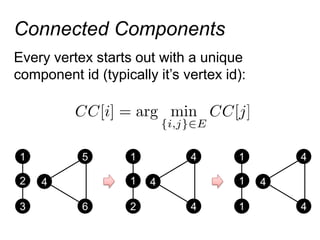
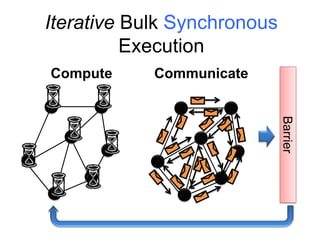
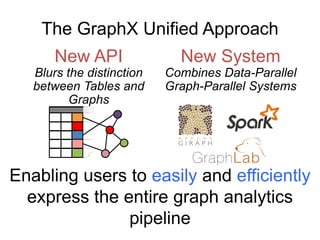
![The Vertex Program Abstraction
Vertex-Programs interact by sending messages.
iPregel_PageRank(i, messages) :
// Receive all the messages
total = 0
foreach( msg in messages) :
total = total + msg
// Update the rank of this vertex
R[i] = 0.15 + total
// Send new messages to neighbors
foreach(j in out_neighbors[i]) :
Send msg(R[i]) to vertex j
39Malewicz et al. [PODC’09, SIGMOD’10]](https://image.slidesharecdn.com/f14lec12graphs-180414040251/85/F14-lec12graphs-38-320.jpg)
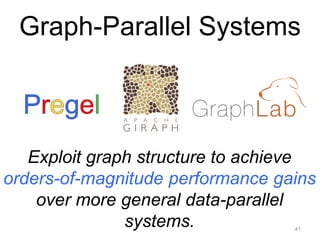
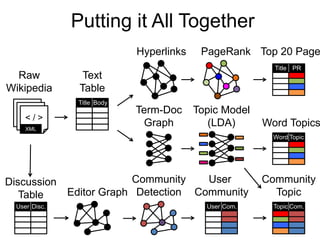
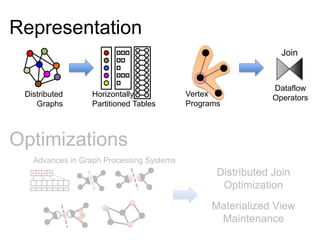
![Counted: 34.8 Billion
Triangles
50
Triangle Counting on Twitter
64 Machines
15 Seconds
1536 Machines
423 Minutes
Hadoop
[WWW’11]
S. Suri and S. Vassilvitskii, “Counting triangles and the curse of the last reducer,” WWW’11
1000 x
Faster
40M Users, 1.4 Billion Links](https://image.slidesharecdn.com/f14lec12graphs-180414040251/85/F14-lec12graphs-45-320.jpg)

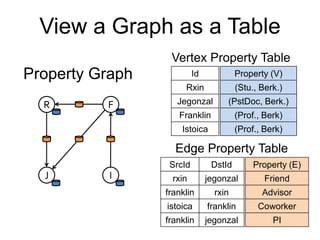
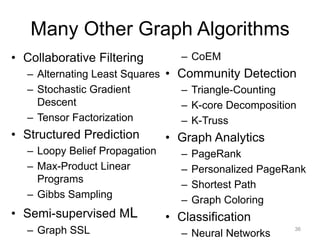
![class Graph [ V, E ] {
def Graph(vertices: Table[ (Id, V) ],
edges: Table[ (Id, Id, E) ])
// Table Views -----------------
def vertices: Table[ (Id, V) ]
def edges: Table[ (Id, Id, E) ]
def triplets: Table [ ((Id, V), (Id, V), E) ]
// Transformations ------------------------------
def reverse: Graph[V, E]
def subgraph(pV: (Id, V) => Boolean,
pE: Edge[V,E] => Boolean): Graph[V,E]
def mapV(m: (Id, V) => T ): Graph[T,E]
def mapE(m: Edge[V,E] => T ): Graph[V,T]
// Joins ----------------------------------------
def joinV(tbl: Table [(Id, T)]): Graph[(V, T), E ]
def joinE(tbl: Table [(Id, Id, T)]): Graph[V, (E, T)]
// Computation ----------------------------------
def mrTriplets(mapF: (Edge[V,E]) => List[(Id, T)],
reduceF: (T, T) => T): Graph[T, E]
}
Graph Operators (Scala)
65](https://image.slidesharecdn.com/f14lec12graphs-180414040251/85/F14-lec12graphs-60-320.jpg)
![class Graph [ V, E ] {
def Graph(vertices: Table[ (Id, V) ],
edges: Table[ (Id, Id, E) ])
// Table Views -----------------
def vertices: Table[ (Id, V) ]
def edges: Table[ (Id, Id, E) ]
def triplets: Table [ ((Id, V), (Id, V), E) ]
// Transformations ------------------------------
def reverse: Graph[V, E]
def subgraph(pV: (Id, V) => Boolean,
pE: Edge[V,E] => Boolean): Graph[V,E]
def mapV(m: (Id, V) => T ): Graph[T,E]
def mapE(m: Edge[V,E] => T ): Graph[V,T]
// Joins ----------------------------------------
def joinV(tbl: Table [(Id, T)]): Graph[(V, T), E ]
def joinE(tbl: Table [(Id, Id, T)]): Graph[V, (E, T)]
// Computation ----------------------------------
def mrTriplets(mapF: (Edge[V,E]) => List[(Id, T)],
reduceF: (T, T) => T): Graph[T, E]
}
Graph Operators (Scala)
66
def mrTriplets(mapF: (Edge[V,E]) => List[(Id, T)],
reduceF: (T, T) => T): Graph[T, E]
capture the Gather-Scatter pattern from
specialized graph-processing systems](https://image.slidesharecdn.com/f14lec12graphs-180414040251/85/F14-lec12graphs-61-320.jpg)
![Enhanced Pregel in GraphX
72Malewicz et al. [PODC’09, SIGMOD’10]
pregelPR(i, messageList ):
// Receive all the messages
total = 0
foreach( msg in messageList) :
total = total + msg
// Update the rank of this vertex
R[i] = 0.15 + total
// Send new messages to neighbors
foreach(j in out_neighbors[i]) :
Send msg(R[i]/E[i,j]) to vertex
Require Message
CombinersmessageSum
messageSum
Remove Message
Computation
from the
Vertex Program
sendMsg(ij, R[i], R[j], E[i,j]):
// Compute single message
return msg(R[i]/E[i,j])
combineMsg(a, b):
// Compute sum of two messages
return a + b](https://image.slidesharecdn.com/f14lec12graphs-180414040251/85/F14-lec12graphs-67-320.jpg)


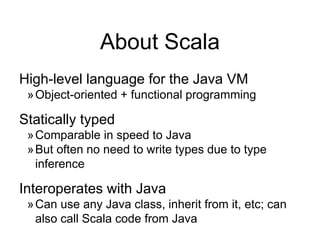

var lst = List(1, 2, 3)
// type of lst is List[Int]
Java equivalent:
int[] arr = new int[8];
List<Integer> lst =
new ArrayList<Integer>();
lst.add(...)
Indexing:
arr(5) = 7
println(lst(5))
Java equivalent:
arr[5] = 7;
System.out.println(lst.get(5));](https://image.slidesharecdn.com/f14lec12graphs-180414040251/85/F14-lec12graphs-83-320.jpg)
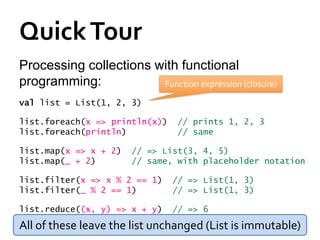
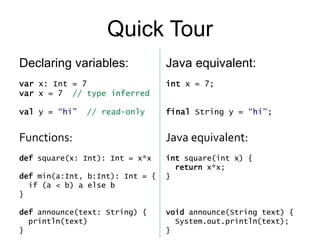
![Other Collection Methods
Scala collections provide many other
functional methods; for example, Google for
“Scala Seq”Method on Seq[T] Explanation
map(f: T => U): Seq[U] Pass each element through f
flatMap(f: T => Seq[U]): Seq[U] One-to-many map
filter(f: T => Boolean): Seq[T] Keep elements passing f
exists(f: T => Boolean): Boolean True if one element passes
forall(f: T => Boolean): Boolean True if all elements pass
reduce(f: (T, T) => T): T Merge elements using f
groupBy(f: T => K): Map[K,List[T]] Group elements by f(element)
sortBy(f: T => K): Seq[T] Sort elements by f(element)
. . .](https://image.slidesharecdn.com/f14lec12graphs-180414040251/85/F14-lec12graphs-85-320.jpg)