Downloaded 54 times
![Introduction
The cross-border trade between India and Bangladesh began in post
independence era itself. But there was no significant improvement in the
trade between the two countries at the initial stage. Following adoption
of new economic reforms by India in 1991, the trade relations between
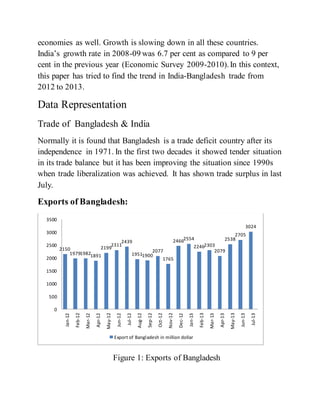
India and Bangladesh witnessed a significant improvement, and it has
been growing gradually. In 2012-13, two-way trade crossed the $
551500000 mark as a result of a significant increase in Bangladesh's
exports to India (68 percent over the previous year) and India's exports
to Bangladesh (43 percent over the previous year). Bangladesh's exports
to India in 2012-13 was $.10250000,and India's exports to Bangladesh
in the same period was $.91730000.India is the largest export
destination for Bangladesh outside the Western world comprising USA
and Europe. Bangladesh is surrounded by four-north-eastern states
which all together share a 1,880 km border with Bangladesh with 1,434
km on land and 446 km riverine [I].North-east India may serve a gate-
way for Bangladesh’s access to Indian markets and in the course of time
may act as a game changer in the Bangladesh-India trade relations.
Bangladesh is one of the largest export markets for Indian trade. The
bilateral trade between the two nations is carried out as per guidelines
given in the Bangladesh Trade Agreement with India [II], which
provides beneficial arrangement for the use of waterways, railways and
roadways passage of goods between two places in one country through
the territory of the other. There are factors contributing to the growth of
trade between India and Bangladesh. These factors jointly point to the
locational advantages, i.e proximity between the two countries and
coordination between the two governments at the political level. In
2008, global recession has struck worldwide. It has changed the global
trade. The impact of the financial crisis is felt by the developing](https://image.slidesharecdn.com/exportimportbetweenbdind-150608174346-lva1-app6892/85/Export-import-between-Bangladesh-India-4-320.jpg)
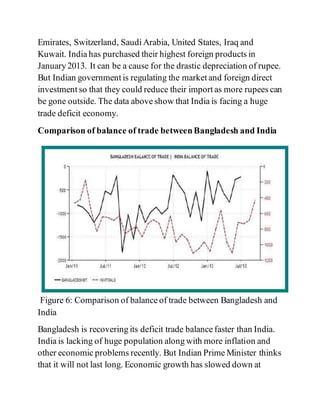
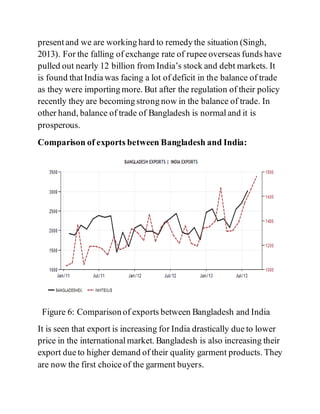
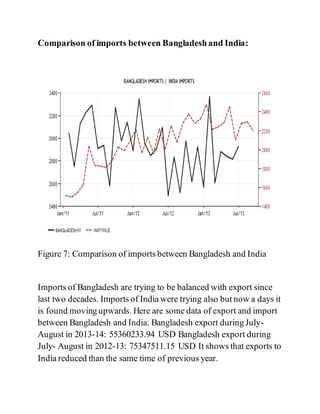

This document discusses trends in trade between India and Bangladesh from 2012-2013. It finds that while both countries have faced trade deficits, India's deficit is larger due to higher inflation and economic issues. The document analyzes export and import data and finds that while Bangladesh has been able to balance its trade, India's imports have increased more than its exports. However, the depreciation of the Indian rupee has made Indian exports more competitive. The document suggests both countries should cooperate to promote bilateral trade and consider India's northeast states as an opportunity for Bangladeshi access to Indian markets.


