Download as PDF, PPTX


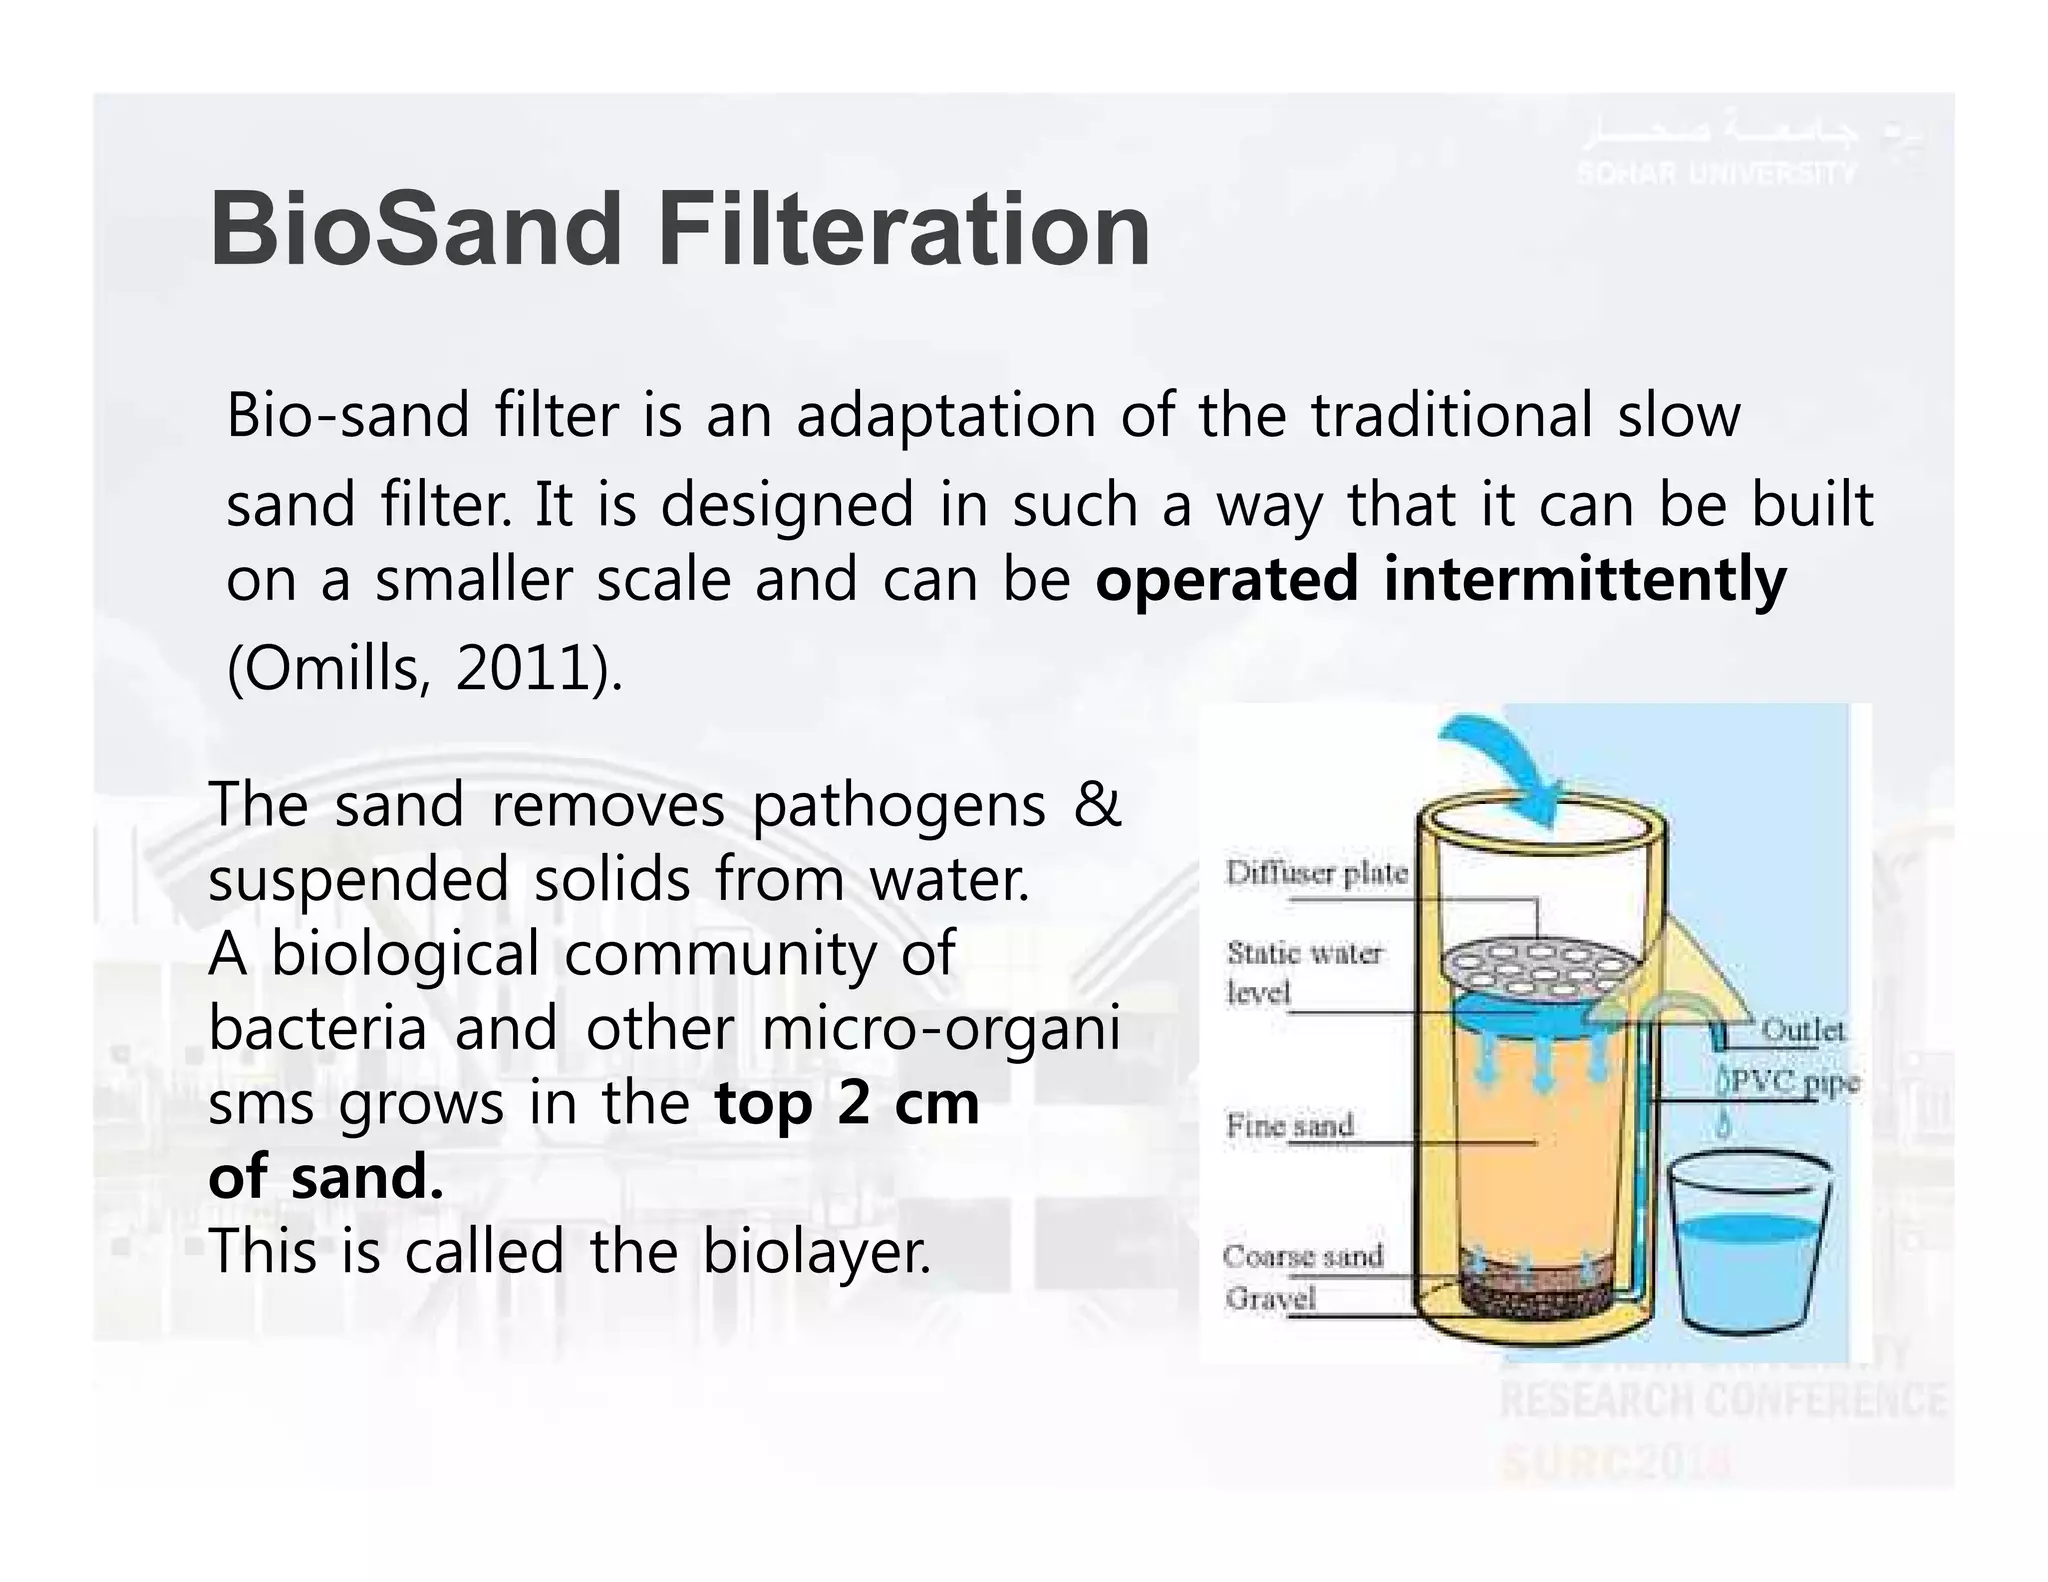
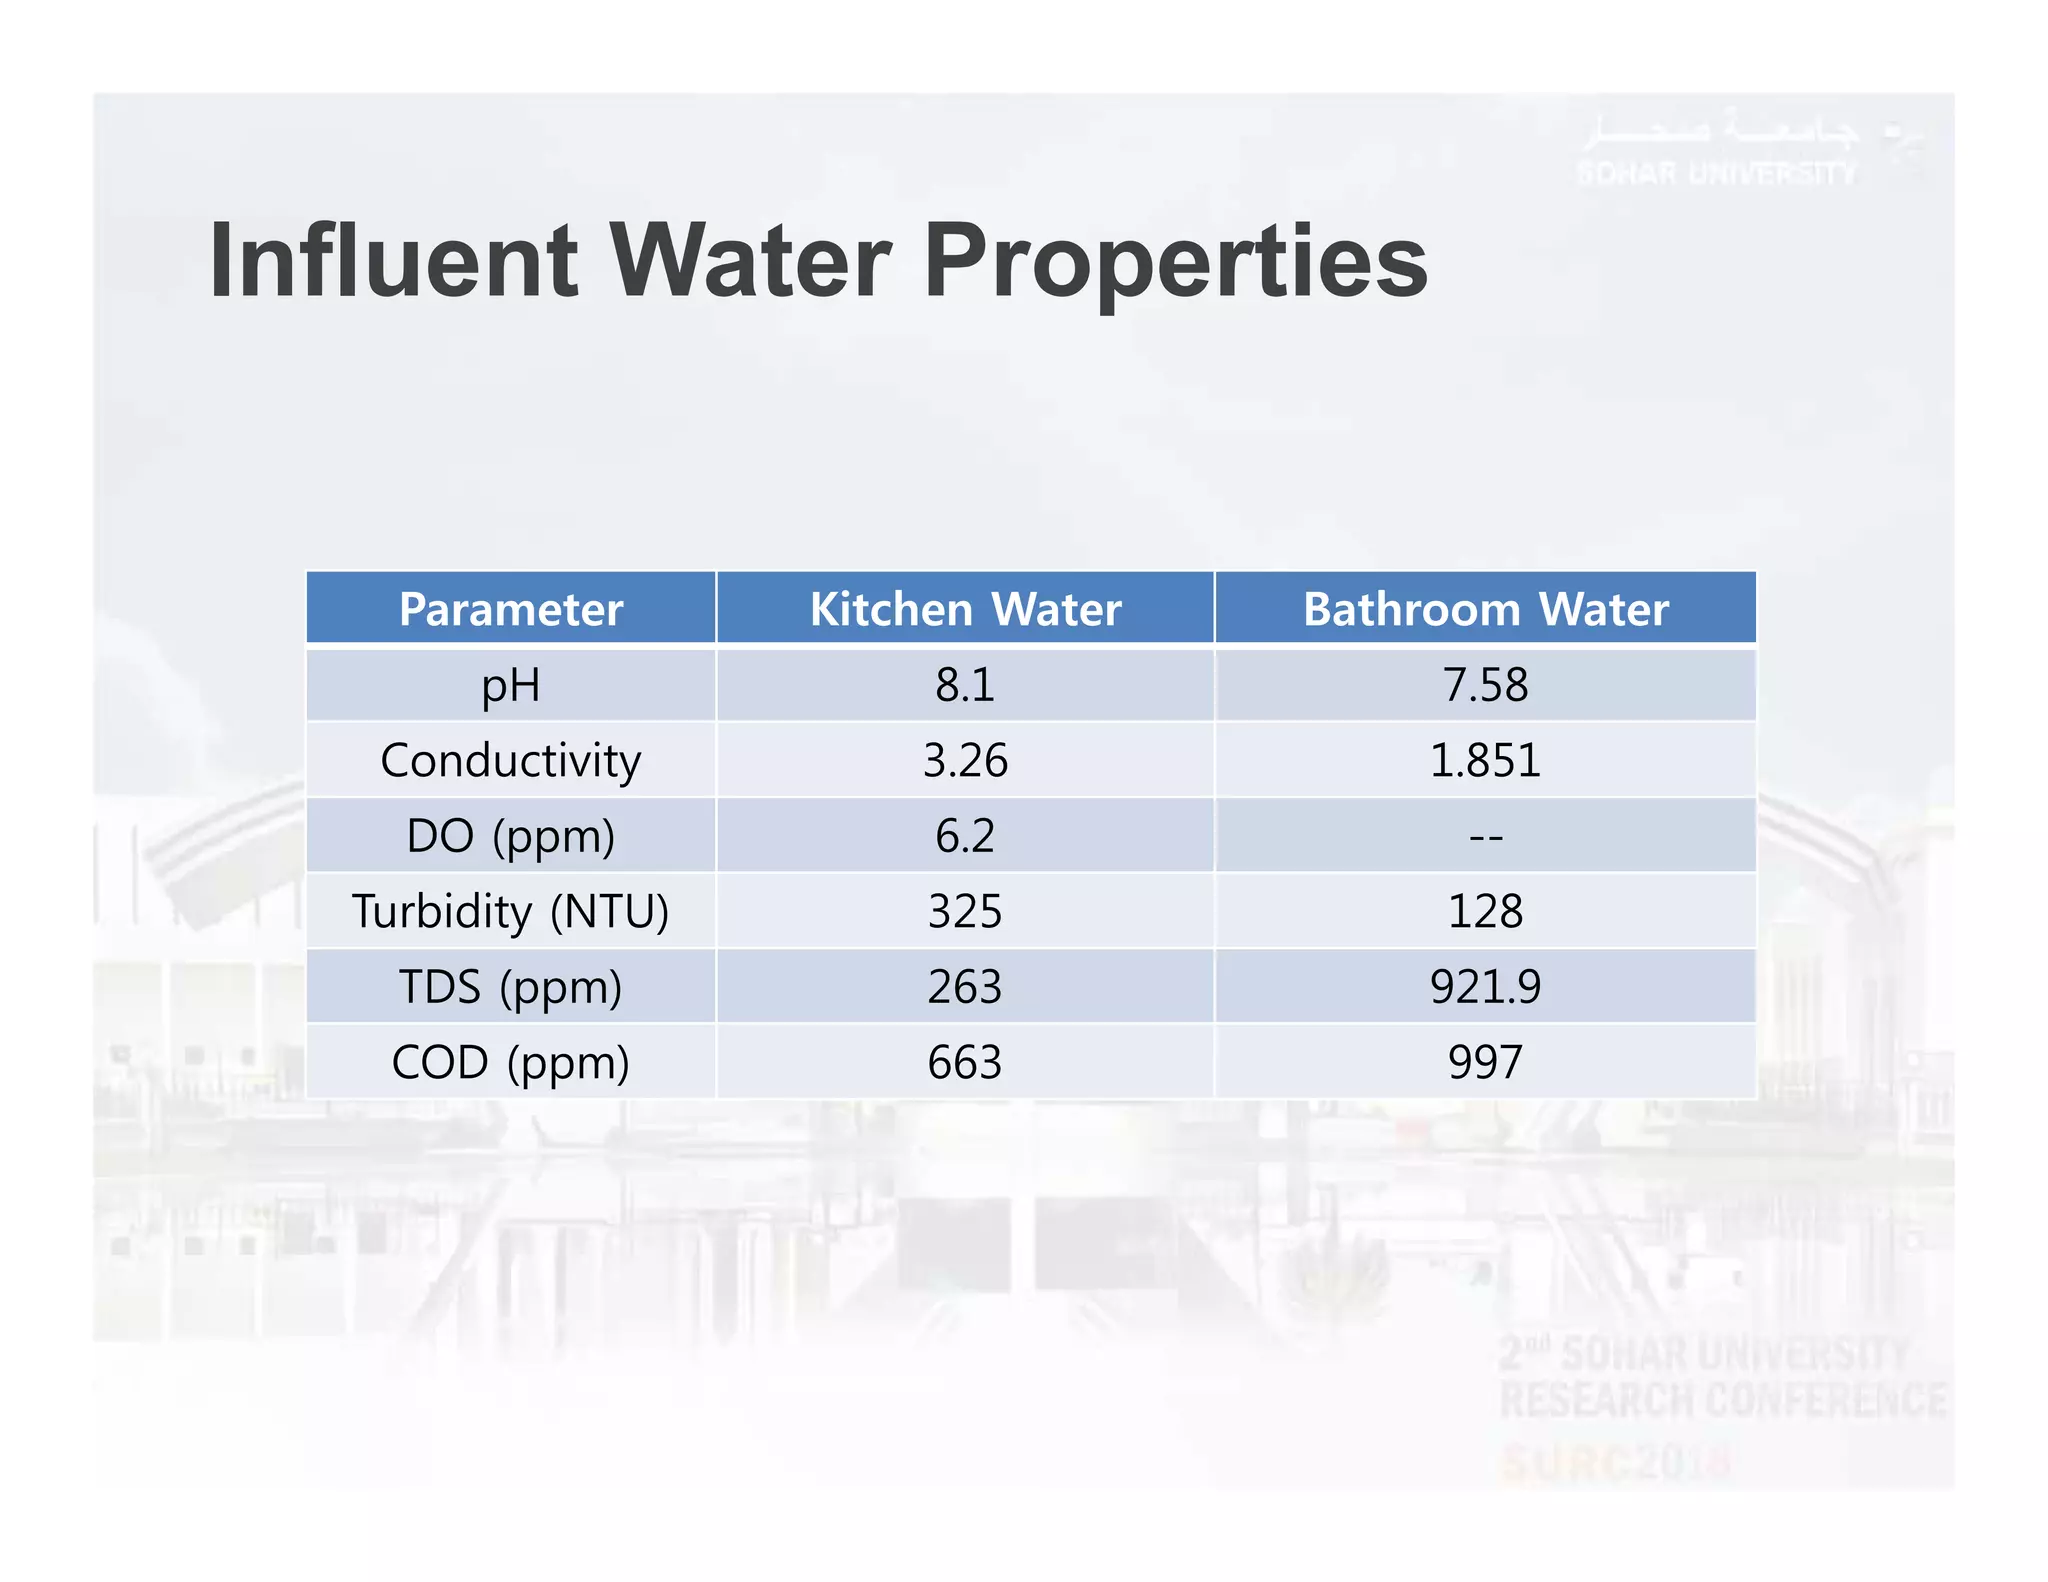
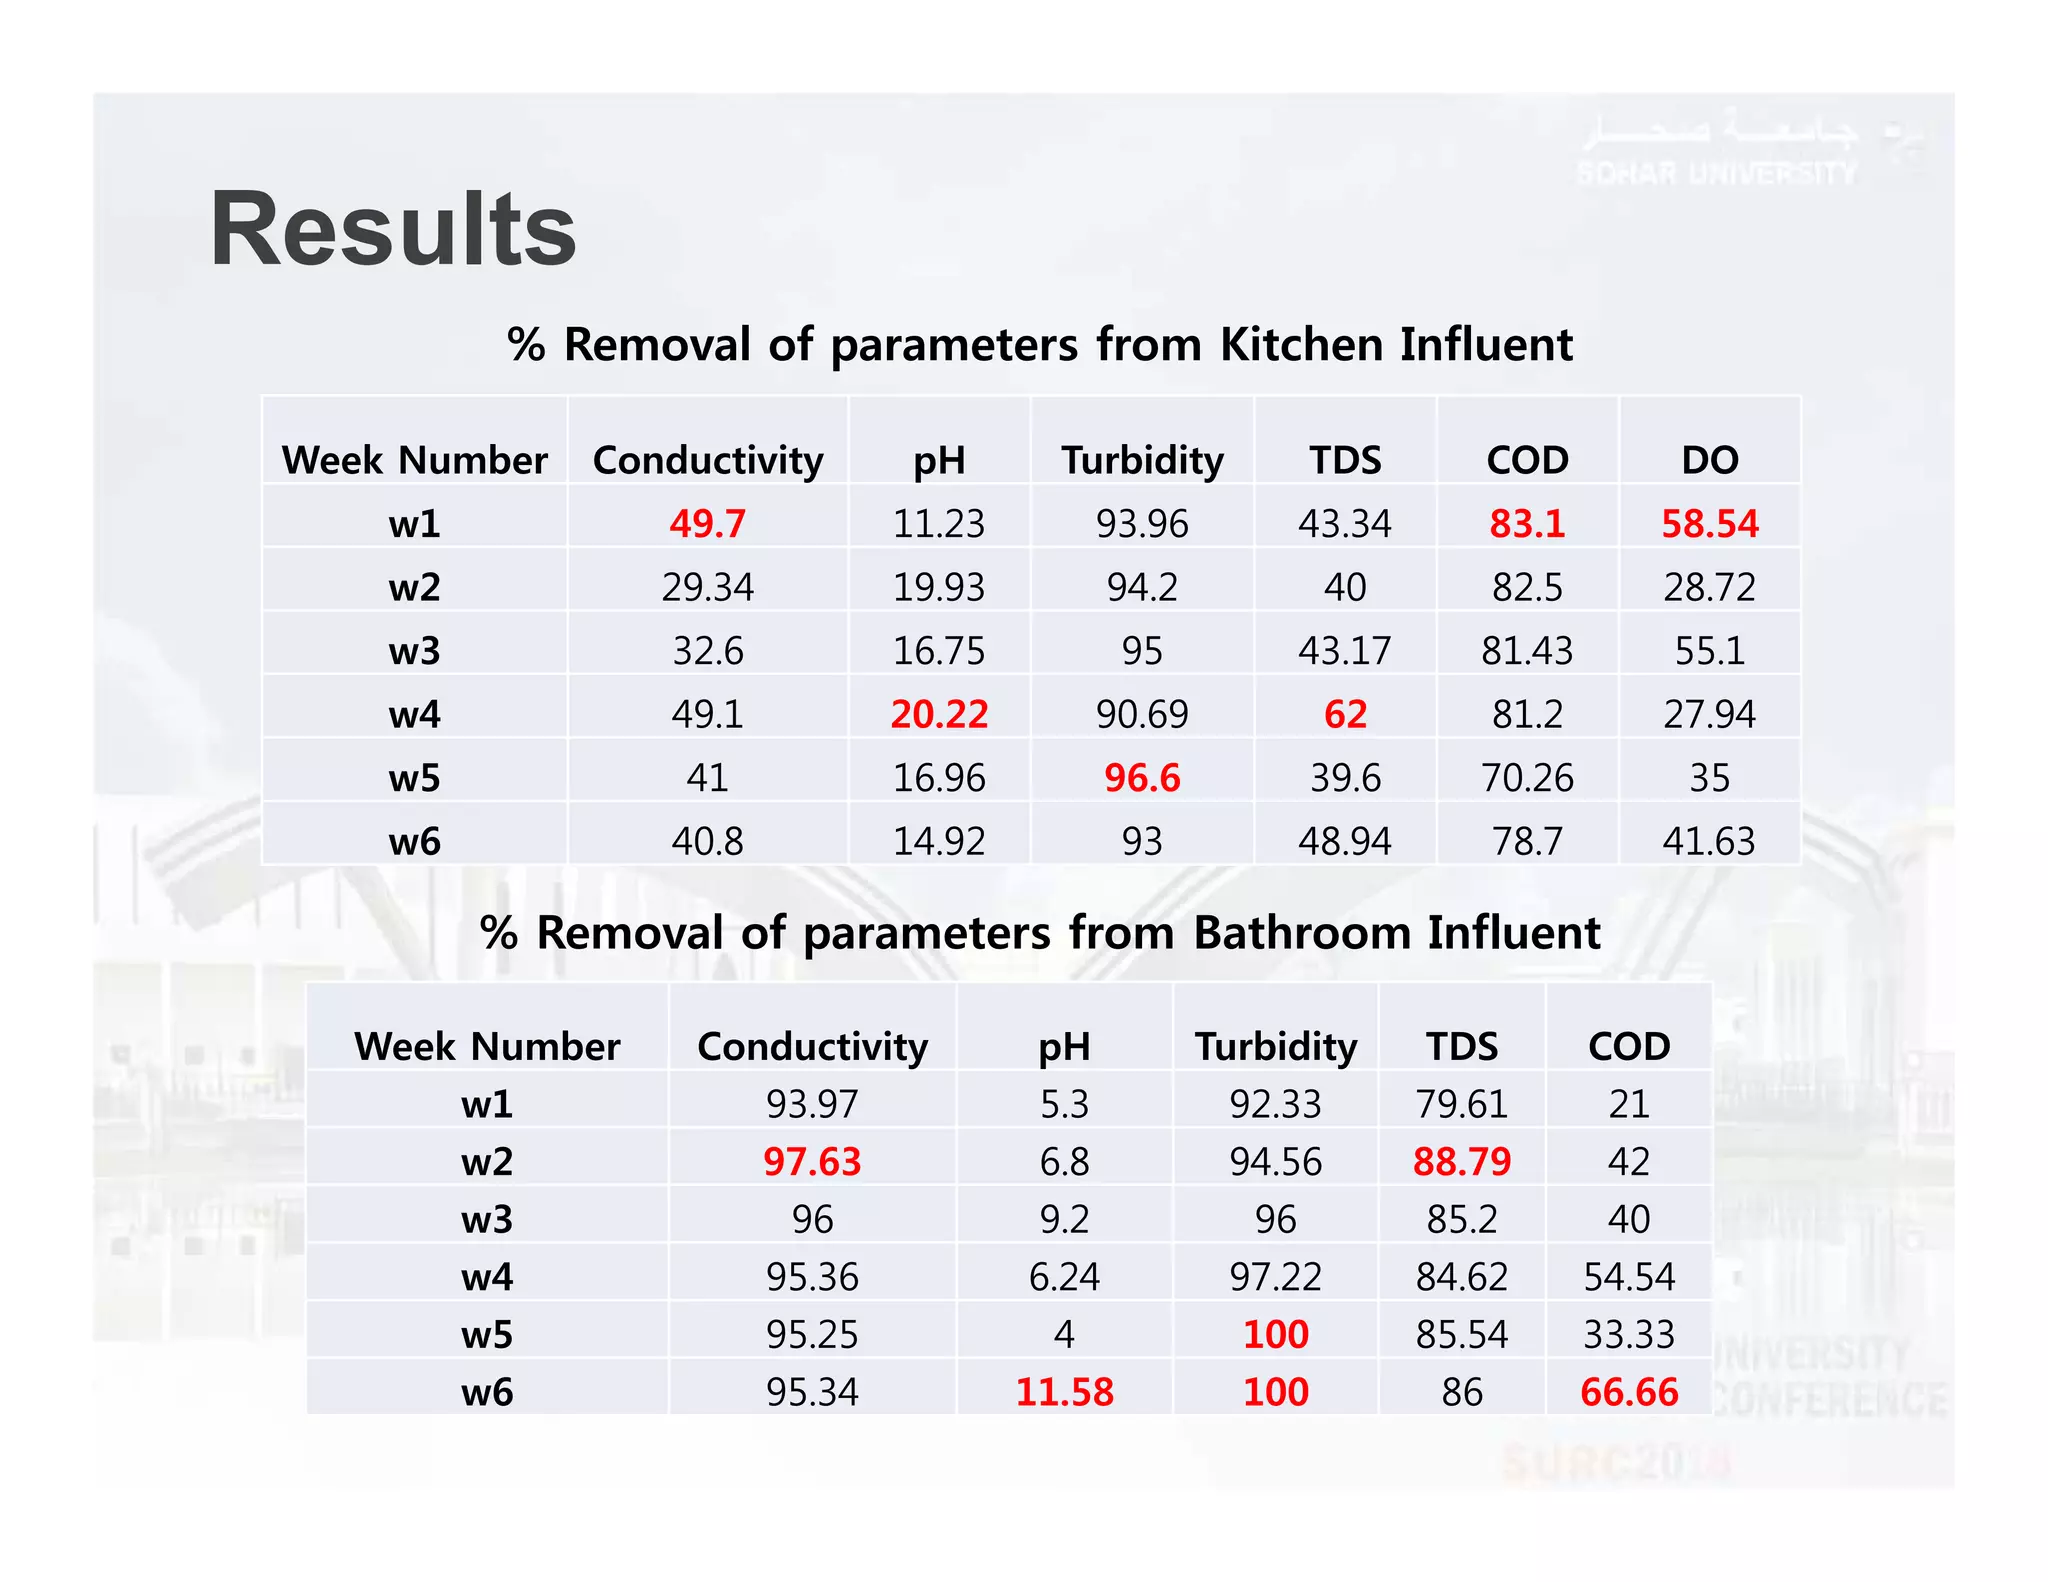
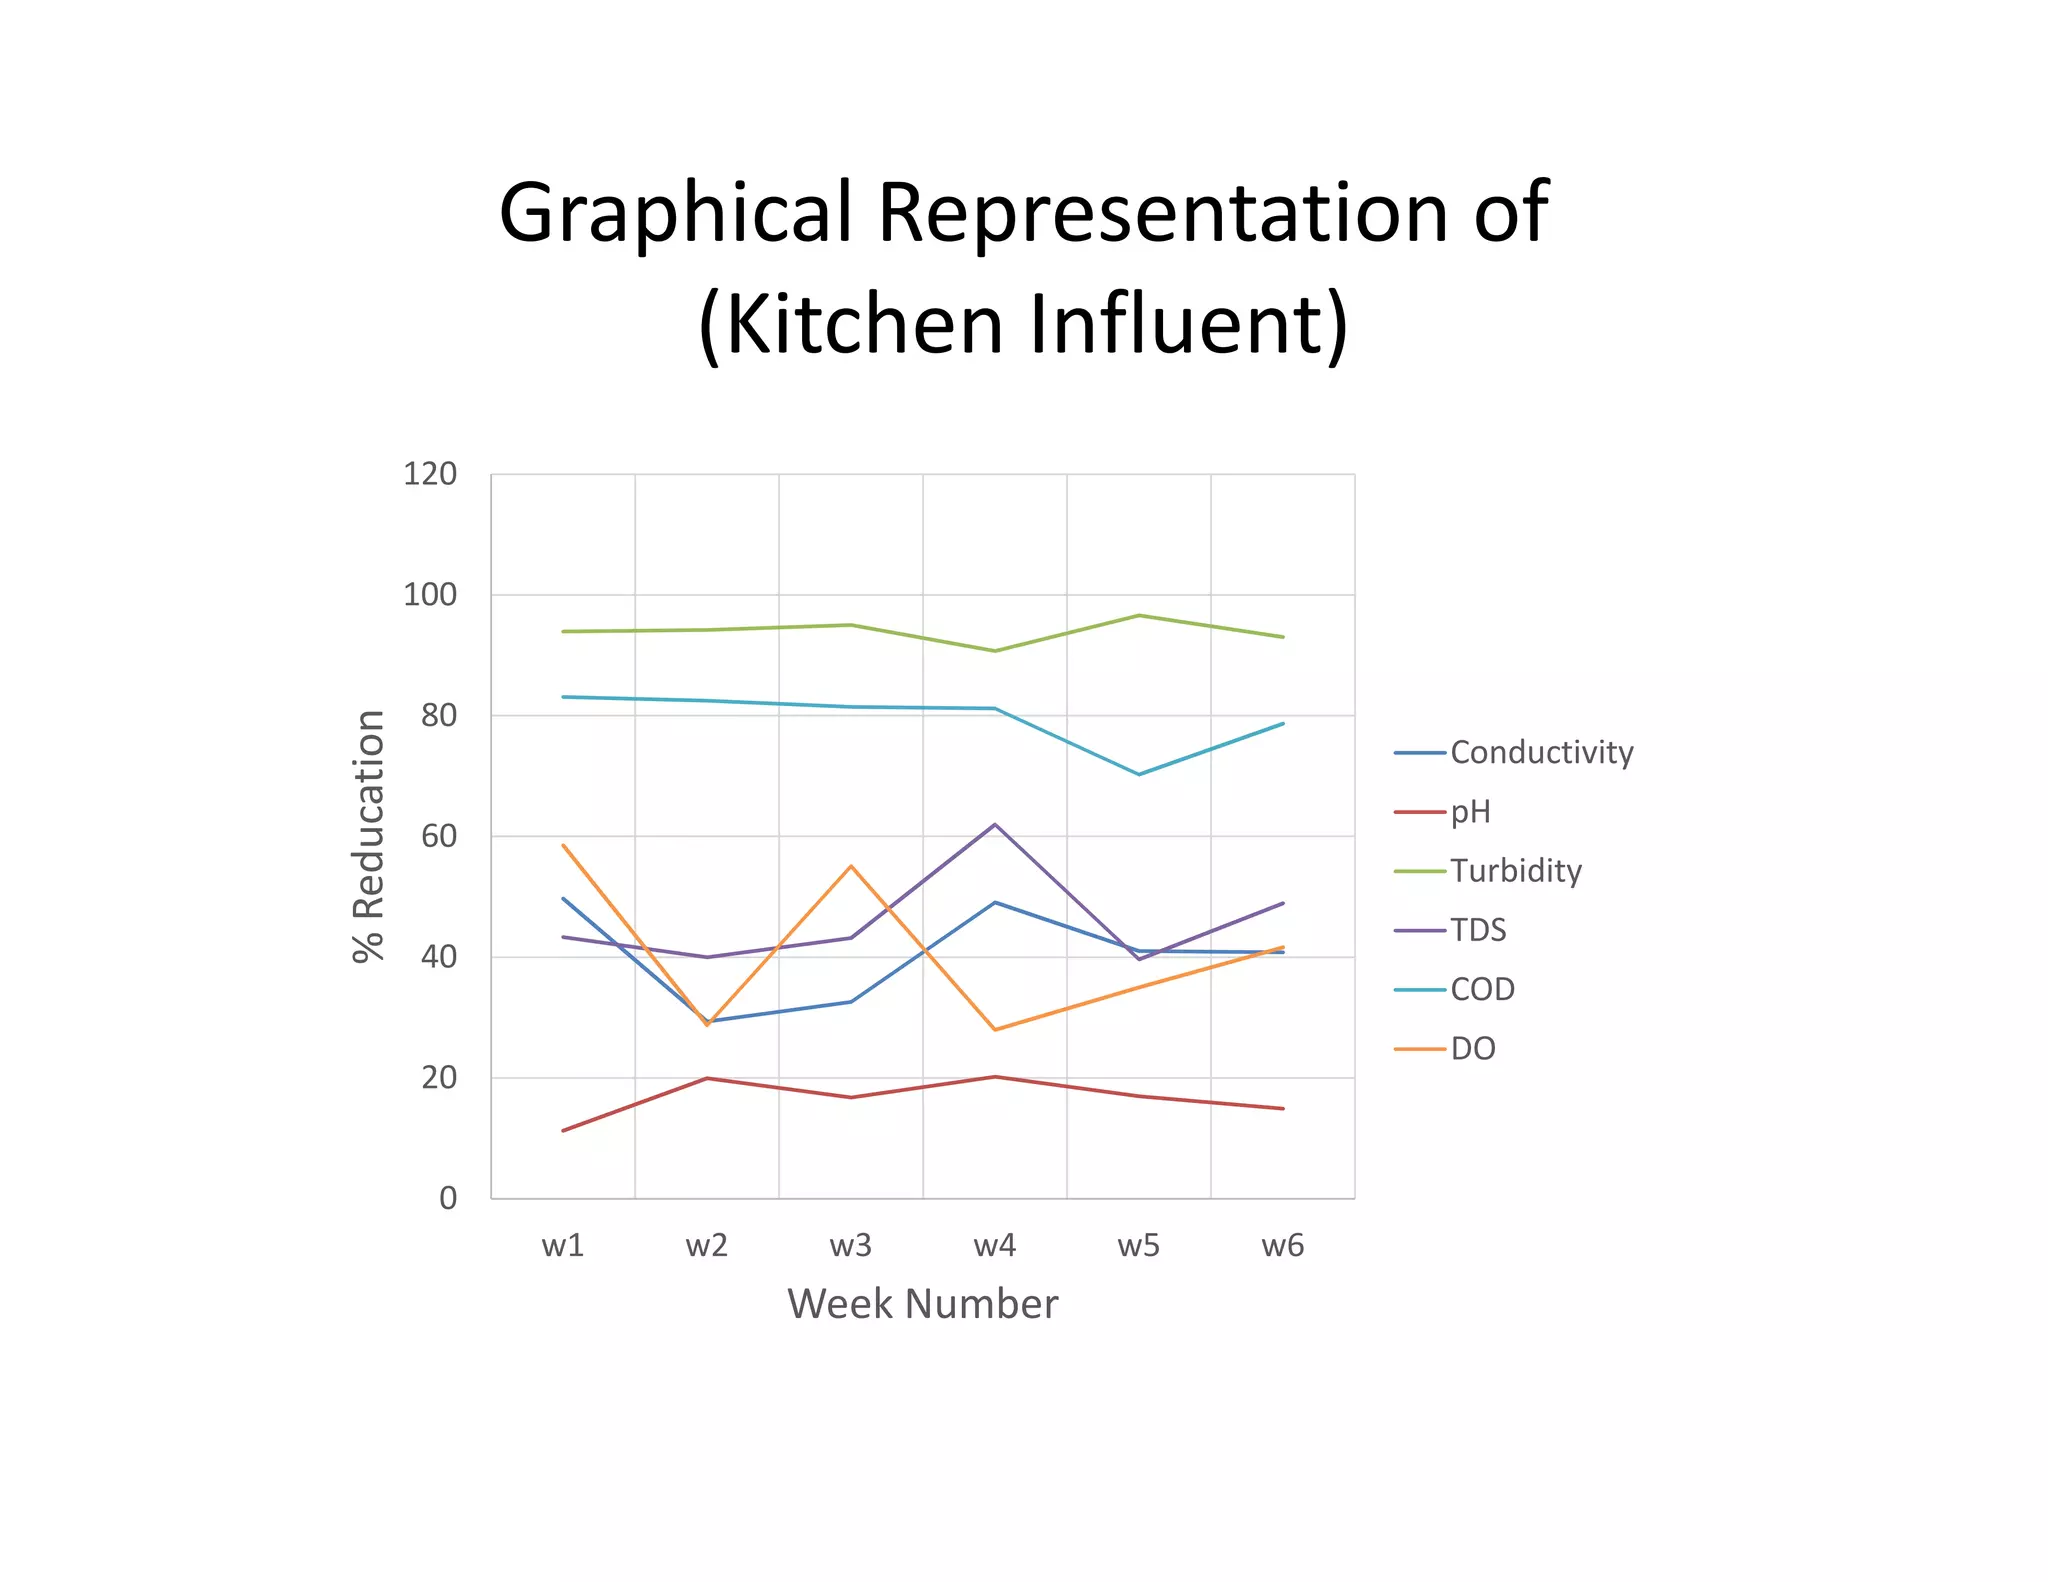
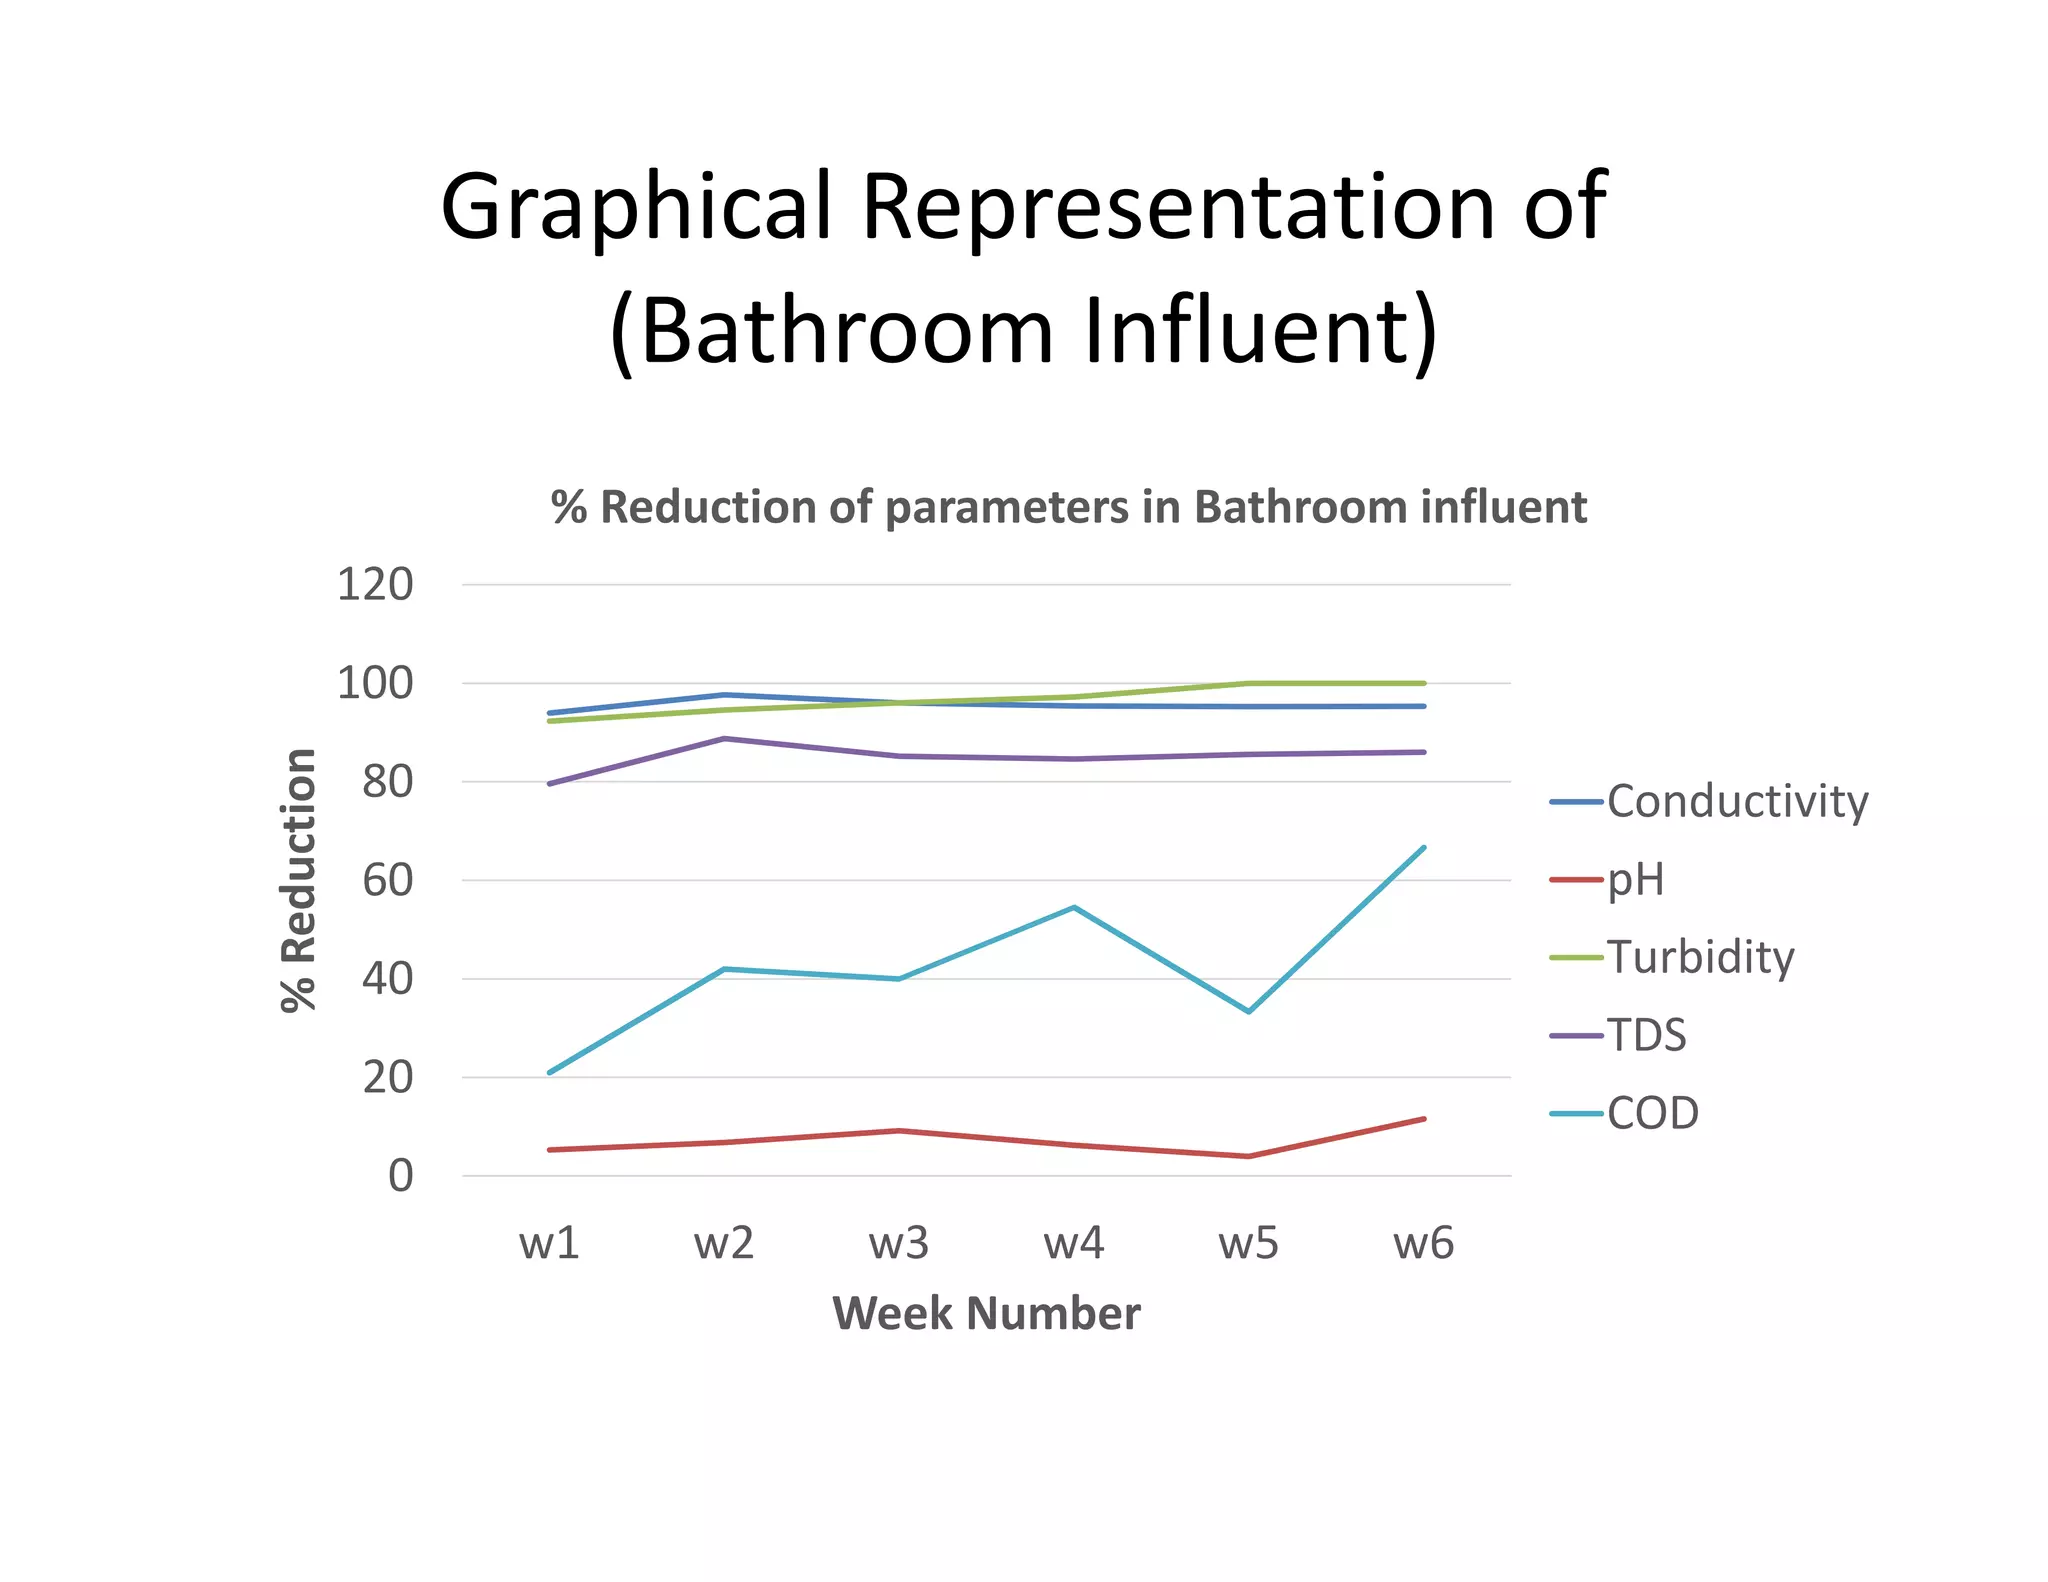
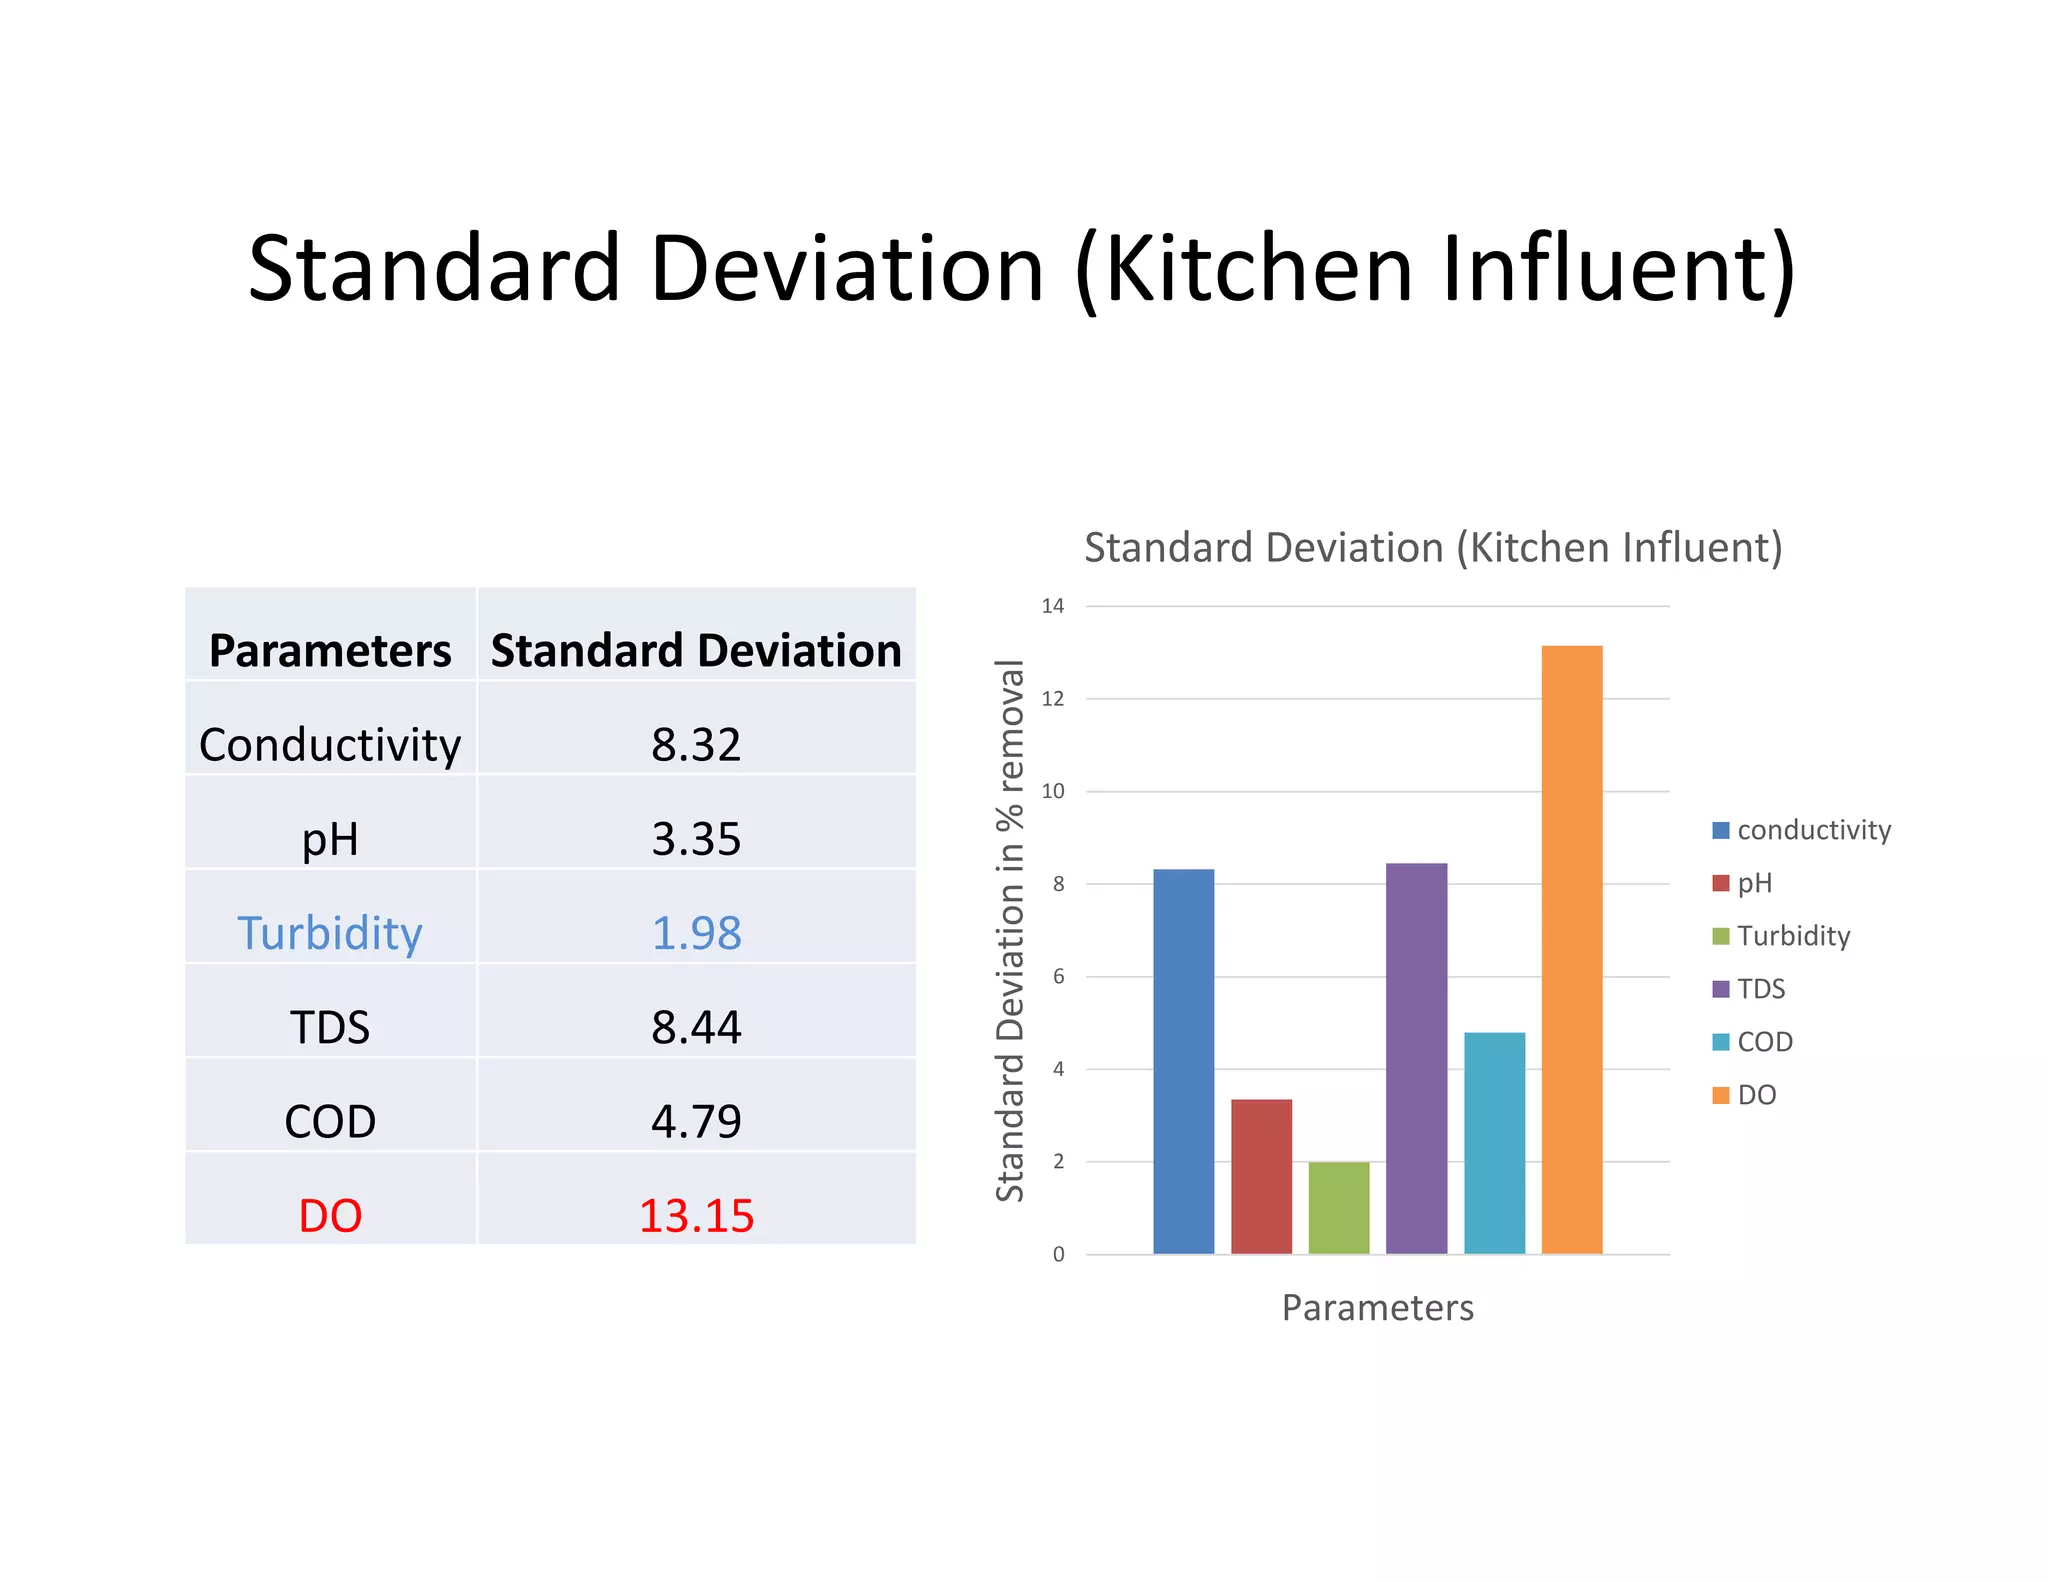

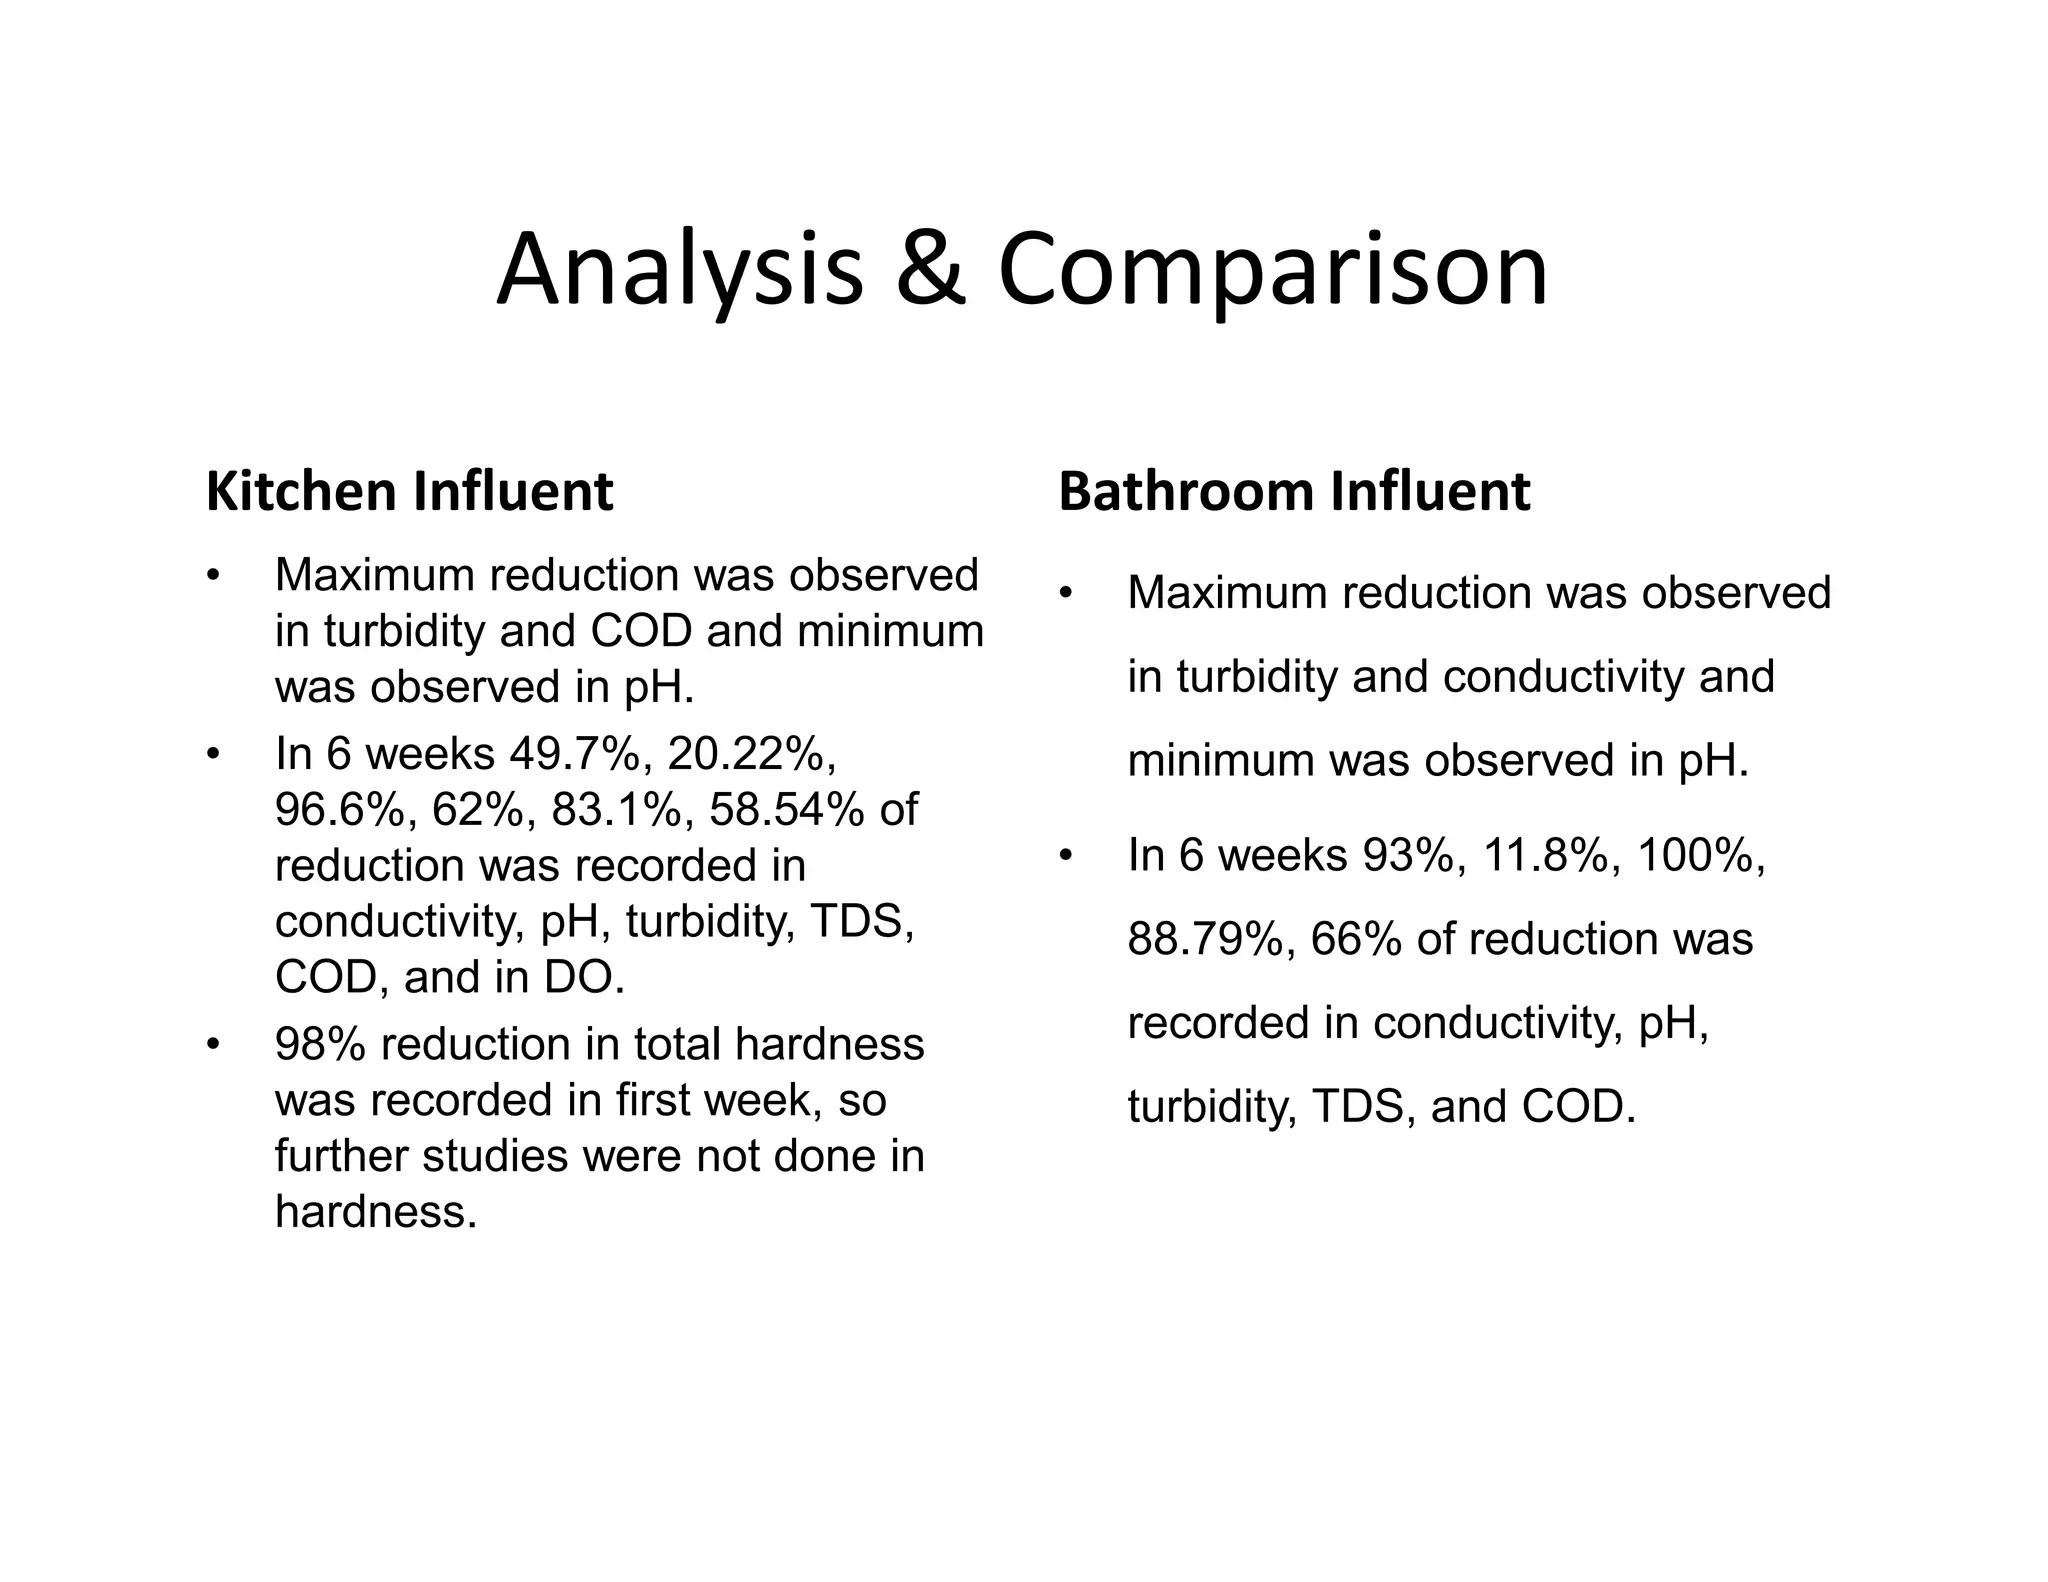

This study investigates the efficacy of biosand filters for recycling grey water from domestic kitchens and bathrooms, aiming to address water pollution and scarcity. The results demonstrate significant reductions in various pollutants, with the system achieving up to 96.6% removal of turbidity and substantial reductions in other parameters. The research highlights the biosand filter's potential as an efficient method for treating domestic wastewater, although it notes limitations in study duration and scale.


