NO1 Verified kala jadu karne wale ka contact number kala jadu karne wale baba...
Webster1996
1. Biofiltrationof Odors, Toxics and Volatile Organic
Compoundsfrom Publicly Owned TreatmentWorks
ToddS. Webster andJosephS. Devinny
Departmentof Civil Engineering, Environmental Engineering Program,University of SouthernCalifornia,Los Angeles, CA 90089
EdwardM.Torres andShabbirS. Basai
County Sanitation Districk of Orange County,Environmental Management Division, 10844Ellis Avenue, Fountain Valley, CA 92728
Increasing federal arid state regulation has made it
necessary to apply ar'r pollution control measures at
publicly owned treatment works (POTWd. Traditional
control technologiesmay not be suitablefor treating the
low and variable contaminant concentrations often
found in P O W off-gases. An alternative control tech-
nology, biofiltration, was studied. An experiment using
bench- and pilot-scale reactors established optimal op
erating conditions for*a full-scale conceptual design.
The waste airstream containedppmv levels of hydrogen
suede and ppbv levels of specgic volatile oeanic com-
pounds {VOCs). Granular activated carbon (GAO and
yard waste compost CYWO were tested aspossiblebiofil-
ter media with and withoutpH control. The 16-month
field study bench reactorsachieved 99h removal of b y
drogen suuide, 53 to 98% removal of aromatic hydm
carbons, 37 to 99h removal of aldehydes and ketones,
and 0 to 89h removal of chlorinated compounds. The
GAC and YWCpilot reactors removed more than 80%
and 6 9 ?of the total VOCsat 1 7second and 70second
empty bed retention times, respectively. The YWC reac-
torspeformedpoorly at empty bed retention timesof 30
and 45 seconds, removing less than 40% of total VOCs.
Declining pH bad little negative effect on contaminant
removal, suggesting co.stly control measures may not be
necessary.Biofiltration appears to be afeasible alterna-
tive to traditional control technologies in treating off-
gasesfrom POWs.
INTRODUCTION
Publicly Owned TreatmentWorks (POTWs) have histori-
cally been concerned *ith odors. Recently, federal, state
and local government agencies have imposed stringent
regulationson volatile organic compound (VOC) emissions
from POTWs, and new technologies are needed to ensure
compliance. The low and variable contaminant concentra-
tions in P O W off-gasesmake traditionaltechnologiessuch
as thermal oxidation or carbon adsorption costly. Biofiltra-
tion m a y be a more suitable and cost-effective technology
for simultaneously removing VOC and odor emissions.
Environmental Progress (Vol. 15, No. 3)
Biofiltration is a process in which contaminated air is
passed through a porous packed medium that supports a
thriving population of microorganisms. The contaminants
are first absorbed from the air to the water/biofilm phase
of the medium. The degree of absorption is a function of
the chemical characteristics of the specific contaminant
(water solubility, Henry's Constant, molecular weight) [81.
Once the contaminants are absorbed, the microorganisms
convert them to carbon dioxide, water, inorganic products
and biomass.
Biofiltersuccess is dependent on the degradabilityof the
contaminants [8, 91.Anthropogeniccompounds may con-
tain complex bonding structures that resist microbial enzy-
matic reactions. Oxidation may not be complete, and may
even form degradation by-products more toxic than the
original compounds [21. For example, during the aerobic
transformation of trichloroethylene, the highly toxic by-
product vinyl chloride may be formed [ 111.
A successful biofilter must also provide a benign envi-
ronment for microorganisms. The moisture content of the
medium should be maintained at optimalvalues to support
microbial growth without clogging the pores. Acceptable
values of medium pH, at which microoganisms can thrive,
must be known.
The University of Southern California (USC), the County
Sanitation Districts of Orange County (CSDOC), and Hunt-
ingdon EnvironmentalEngineering,Inc. performed experi-
mentsto assessbiofiltertechnologyfor POTWs.Bench- and
pilot-scale biofilters were used to simultaneously remove
odors, VOCs and toxics from air emissions. The data pro-
duced allowed for conceptual design of a full-scale unit.
APPROACH
The experiment was performed at the Orange County
Sanitation District's wastewater treatment facility in Foun-
tain Valley,California.It included nine bench-scaleand two
pilot-scalereactors,and proceeded in twophases [121.This
paper addresses only those reactors used in both phases of
the experiment(Table 1).Phase 1of the experiment,which
was conducted from August 1993 to April 1994, used three
bench-scale reactors (Bl,B2, B9) containing granular acti-
Fall, 1996 141
2. TABLE 1. BiofiltrationExperimentalRunMatrix
Bench (B) Bench (B)
Pilot (P) Phase 1 Pilot (P) Phase 2
B1 Medium:GAC, pH = 7 B1 Medium: GAC, pH = no control
B2 Medium: GAC, pH = 7 B2 Medium:GAC, pH = 7 (attempted control)
B3
B4
B9
Medium:Yard waste Compost,pH = 7
Medium:Yard waste Compost,pH = 7
Medium:GAC, pH = 1to 2
B3
B4
B9
P1
P2
Medium:Yard waste Compost,pH = no control
Medium:Yard waste Compost,pH = 7
Medium:GAC, pH = 1to 2
Medium:Yard waste Compost,pH = no control
Medium:GAC, pH = no control
vated carbon (GAC) and two bench-scale reactors (B3, B4)
containing yard waste compost (YWC). Neutral conditions
were maintained in four of the reactors (Bl-B4). One
bench-scale reactor (B9) was acidified to determine the ef-
fects of low pH on contaminant removal.
During phase 2 of the experiment, conducted from April
1994toJanuary 1995,continued pH control was attempted
on one bench-scale reactorof each medium (B2, B4), while
the pH in the others (Bl, B3) was allowed to decline as a
result of biological acid production. To determine long term
pollutant removal capabilitiesat a low pH condition, oper-
ation of the acidified GAC bench reactor continued during
phase 2. The two pilot-scale reactors (Pl, Pa), one of each
medium type, operated at various retention times with no
pH control. Due to difficulties with the original YWC
medium of PI, the reactor was restarted 200 days after P2.
The restarted P1 data are presented here.
METHODS
Materials
A positive displacement blower, designed to deliver 7.0
mymin of air at 17.0kPa pressure, delivered gas from the
headworks off-gas main duct into the bench and pilot
biofilters(Figure 1).Each bench-scale reactorwas a tube of
clear acrylic plastic, with an overall length of 150 cm, an
inner diameterof 7.5cm, and an empty-bedvolume of 6600
cm3. The filter bed filled 100 cm of the reactor length, or
4500 cm3of volume. Flows for all reactorswere set at 4000
ml/min, resulting in an empty-bed retention time of 1.15
minutes. The fiberglass pilot reactors had an internal diam-
eter of 1m and a filter-bedheight of 1m. Flow rates ranged
from 0.7 to 2.8 m3/min, giving empty-bed retention times
rangingfrom 70 to 17seconds.
FIGURE 1 Experimental Apparatus
142 Fall, 1996
For both the bench and pilot-scale reactors, fourteen 0.3-
cm-sampling ports, drilled 7 cm apart, were used for ex-
tracting air samples from the biofilters to measure contami-
nant concentrations along the reactor length. A flow meter
and ball valve were used for monitoringand controllingthe
air flow through each reactor.The pressure drop across the
reactor was measured with a u-tube water manometer.
The granular carbon, KP-601 Activated Carbon (Wheele-
brator, Inc., Los Angeles, CAI, was uniform in shape and
diameter (8 mm), while the yard waste compost (BFI, Inc.,
Irvine, CA), was sieved to diameters between 25 and 50
mm. Activated sludge from the dissolved air flotation units
of the plant provided seed microorganismsto all media (70
L/m3 for the bench reactors and 15L/m3 for the pilot reac-
tors). Medium and small size wood bark were added to the
compost media to enhance porosity.
The low pH GAC reactor was inoculated with a one liter
suspension of microorganismsfrom a sulfide-richcorrosive
environment, including some tentatively identified as
7biobacillus thioxidans. Alkalinitywas exhausted by recir-
culating a N HC1 solution over the medium until a
pH of 2 was reached.
The medium moisture content in the bench-scale reac-
tors was controlled by direct water irrigation. A peristaltic
pump with a separate pump head for each reactor, oper-
ated by an automatic timer, watered the filters daily.
Dechlorinated water from the secondary effluent of the
treatment plant was added at a rate of 1.0liter of water per
4.5 liters of medium each week. The peristalic pump was
also used to control pH in the bench reactors by irrigating
the media with sodium biocarbonate solutions M to
lo-' M).
A peristalic pump supplied the water to four sprinklers
in each pilot-scale reactor. These sprinklers uniformly wa-
tered the filter bed surface. Water addition was 1 liter per
5.5 liters of medium each week.
Contaminant Concentrations
The inlet airstreams contained a wide variety of com-
pounds released from the headworks of the treatment op-
eration. The contaminants included aromatics, chlorinated
hydrocarbons, aldehydes, and ketones in concentrations of
1to 75 ppbv. The inlet stream also contained 1to 10ppmv
of hydrogensulfide gas (Table 2). As a general indicator of
the total VOC content in the waste stream, Total Gaseous
measured.
sulfide load of 0.02 mg H,S/min, while the organic load
Non-Methane Organics (TGNMO) concentrationswere also
Each bench-scale reactor received an average hydrogen
Environmental Progress (Vol. 15, No. 3)
3. ~~~ ~~~ ~
TABLE 2. Target CompoundsandObserved
Concentrations(ppbv)
AVERAGE
CONCENTRATION
TARGETCOMPOUNDS COMPOUND
(ppbv)
CHLORINATED HYDKOCARBONS
1,l,I-Trichloroethane 14
Carbon Tetrachloride 1
Chloroform 11
MethyleneChloride 20
Tetrachloroethylene 53
Trichloroethylene 2
Vinyl Chloride 1
ALDEHYDES/KETONES
Acetaldehyde
Formaldehyde
Acetone
Methyl Ethyl Ketone
Methyl Isobutvl Ketone
10
11
71
35
2
AROMATICS
Benzene 4
Toluene 26
o-Xylene 6
p/m-Xylene 12
VOC
TGNMO (ppmv) 26
ODOROlJS COMPOUNDS
HydrogenSulfide(ppmv) 3
was 0.07 mg VOC/min (as methane). The pilot reactors re-
ceived a maximumof 13 mg H,S/min and 52 mg VOC/min
(as methane).
Inlet air samples were taken from a common inlet mani-
fold for all the reactors. The removal efficiencies for each
compound were monitored by taking gas samples from the
effluent of each reactor.One sampling method involvedan
automatic sampling system to draw air samples into stain-
less steel canisters (6 L) for analysis at both in-house and
outside laboratories.Another samplingsystem used was an
automated pump which delivered 20-30 liters of air over a
30 minute period through C18-based dinitro phenyl hydra-
zine (DNPH) impregnatedcartridges.Air samples were an-
alyzed using Modified South Coast Air Quality Manage-
ment District (SCAQMD) Method 25.2, and Environmental
Protection Agency (EPA) Methods TO-11 and TO-14. H,S
analysis was performed using a portable Jerome H,S Gas
Meter (Jerome.AZ).
Medium Characterization
Biodegradation of the contaminants occurred primarily
near the inlet of the reactors (top 30 cm), so the majority of
medium samples was taken there for pH, alkalinity and
moisture content analysis. Occasionally, medium samples
were extracted from bed depths of 46 cm and 92 cm. A
sterilized steel spatula was used to obtain all medium sam-
ples through ports in the reactor wall. Five grams of
medium sample were mixed with distilled water, and the
pH of the water was measured. Back titration of water with
Environmental Progress (Vol. 15, No. 3)
a 0.1 N HCl acid determined total alkalinity. Moisture con-
tents of reactor media were determined by drying at 105°C.
ANALYTICAL RESULTS AND DISCUSSION
Contaminant Removal
The cumulative masses of contaminant entering and
leaving the biofilters during each phase were used to cal-
culate average removal rates (Table 3). Simple adsorption
of contaminant to the medium dominates removal during
an initial period of any biofilter operation. It is important
that this not be erroneously counted as part of the
biodegradation performance of the system. Initial pollutant
adsorption periods were conservatively calculated for the
GAC bench and pilot reactors to be less than 65 and 28
days, respectively. The adsorption period of the compost
media, with their lower adsorptive capacity, was expected
to be much less than the adsorption period of the GAC.
Data collection for the bench-scale experiments began af-
ter 35 days of operation and continued for over 480 days,
while the pilot-scale data collection began at day 14 of op-
eration and continued for over 270 days. This assures the
dominant removal mechanism in both systems during the
experiment was biodegradation.
In general, the bench-scale reactors with pH control and
without pH control achieved similar removal efficiencies.
The effectiveness of the biofilters at low pH was unex-
pected. However, it is known that i75iobacillu.s sp. is ac-
companied by acidophylic heterotrophs [ 71. Indeed, they
are necessary for the survival of the Tbiobacillussp. be-
cause they degrade organic waste products which are oth-
erwise self-inhibitory. Presumably, these same het-
erotrophs are capable of degrading the organic contami-
nants in the air stream.
The GAC and compost pilot-scale reactors, operating re-
spectivelyat 30 and 70 second empty-bed retention times,
demonstrated removals similar to those of the bench reac-
tors. The pilot-scale GAC reactor successfully removed hy-
drogen sulfide (> 99%) and VOCs (> 84% TGNMO) at an
empty-bed retention time of 17 seconds. The compost pilot
reactor, operating at retention times of 30 and 45 seconds,
removed less VOC (<40% TGNMO), and the medium
acidified rapidly.
The reactors removed hydrogen sulfide most efficiently.
Removal was successively lower for aromatics, then alde-
hydes and ketones, and finally chlorinated compounds.
Hydrogen Sulflde
Completeoxidation of hydrogen sulfide was seen for all
bench-scale reactors within the first 20 cm of bed length.
This acidified the upper portions of the biofilters, but did
not affect the pH in the middle or lower portions of the
beds.
The pilot-scale reactors also oxidized the hydrogen sul-
fide effectively.At the lower retention time of 70 seconds,
complete oxidation of hydrogen sulfide again occurred
within the upper 30 cm of the compost reactor. However,
as retention time was decreased, sulfides penetrated more
deeply, and filter bed acidificationwas observed at greater
depths. This rapid acidification caused slight decreases in
hydrogen sulfide removal (down to 95%). The GAC pilot-
scale reactor showed a pattern of acidification like that of
the compost pilot bed, but performed like the low pH
bench-scale reactor (B9).
Fall, 1776 143
4. TABLE 3. RemovalEfficiencyDatafor Benchand PilotReactors
Bench-Scale Pilot-Scale
GAC GAC YWC YWC GAC GAC GAC GAC YWC YWC YWC
Compound C Unc C Unc Low RT=30 RT=20 RT=17 RT=30 RT=45 RT=70
1,1,l-Trichloroethane
Carbon Tetrachloride
Chloroform
MethyleneChloride
Tetrachloroethylene
Trichloroethylene
Vinyl Chloride
Acetaldehyde
Formaldehyde
Acetone
Methylethylketone
Methylisobutylketone
Benzene
Toluene
o-Xylene
p/m-Xylene
TGNMO
Hydrogen Sulfide
0
0
21
40
85
63
0
85
77
85
94
68
87
98
95
96
89
100
0
1
4
44
83
58
0
82
80
80
85
77
92
98
94
93
82
100
C = pH control
Unc = no pH control
Low = low pH condition
N/M = not measured
RT = media retention time (seconds)
4
15
28
67
23
14
0
37
76
85
95
66
89
97
93
92
77
100
31
24
19
49
38
43
0
86
81
91
87
75
89
97
95
96
87
100
0
0
6
0
66
59
48
43
74
82
93
65
53
94
95
95
67
100
0
21
0
19
98
47
4
N/M
N/M
N/M
N/M
N/M
88
98
95
94
88
99
0
25
0
0
91
82
56
N/M
N/M
N/M
N/M
N/M
93
99
91
N/M
99
100
0
0
9
0
94
68
0
N/M
N/M
N/M
N/M
N/M
90
97
93
96
84
100
0
0
11
35
0
11
0
N/M
N/M
N/M
N/M
N/M
36
57
0
96
0
95
Aromatic Hydrocarbons
Aromatichydrocarbon removal for all bench reactorswas
moderately effective (53-98%). Limited GC/MS analysis
performed on air samples taken along the length of the re-
actors indicated that aromatic hydrocarbon removal also
occurred in the upper 30 cm of the reactorbed (not shown).
Xylene and toluene removals were above 90% for all
bench-scale reactors, while benzene removal ranged from
53 to 92%. No difference in treatment was attributed to
medium type. For example, the reactors with gradually de-
clining pH removed benzene (89-92%) similarly to the
controlled-pH reactors (87-89%). This indicates that ben-
zene degrading microorganismscan adjust to slow pH de-
clines.
The GAC pilot-scale reactor achieved effective removal
of aromatics at all three retention times (>88% for ben-
zene, toluene and xylene), while the compost pilot reactor
was less effective at retention times of 30 and 45 seconds
(< 51% for benzene). At a 70 second retention time, the
compost reactor removed more than 70% of the aromatics.
AIdebydes and Ketones
Aldehyde and ketone removal by all bench-scale reac-
tors was between 37 and 96%. No effect was attributed to
mediumtype or pH regime.Overall,acetone and MEK were
removed most effectively (>80%). However, some reac-
tors showed poorer removal of other aldehyde and ketone
compounds (as low as 37%).The poor degradation of the
MIBK may be attributable to its branched structure.
CblorinatedHydrocarbons
Removal of the chlorinated compounds varied greatly
with medium type but not with pH control. Generally, the
more soluble chlorinated compounds were removed more
effectively.The bench reactors were ineffective in remov-
ing l,,l,l-trichloroethane, carbon tetrachloride and vinyl
chloride. Limited removal of methylene chloride and chlo-
roform was evident in all bench-scale reactors (0 to 67%),
with almost no removal in the pilot-scale reactors (0 to
35%).Trichloroethyleneand tetrachloroethylenewere well
removed in the GAC bench and pilot-scale reactors
(14-98%), but were not effectively removed in the yard
waste compost reactors (<44%). Removal of these com-
pounds likelyoccurred in anaerobic zones withinthe highly
porous GAC particles, by reductive dehalogenation [3,4,
G]. Presumably,this did not occur as much in the compost
reactors because of the lower porosity of the compost
particles.
Medium Analyses
Mediump H and Alkalinity
The oxidation of hydrogen sulfide gas produces sulfuric
acid. No obvious deposits of elementalsulfurwere seen (by
visual inspection of media), perhaps because of'the low
feed concentrations of hydrogen sulfide [I.?]. Acid forma-
tion eventually exhausts the alkalinity of the medium and
causes the pH to decline. To test for the effects of the bio-
logicallygenerated acid on the variousfiltermedia, medium
samples were taken monthlyfrom the upper portions of the
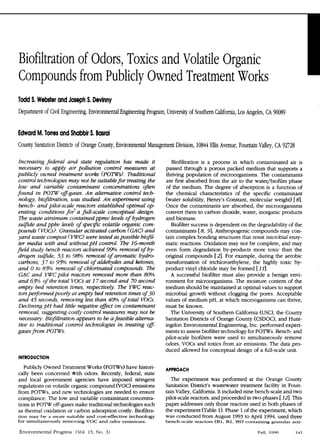
reactors forpH analysis (Figures 2 and 3).
144 Fall, 1996 Environmental Progress (Vol. 15, No. 3)
5. Phase 1 I Philse2 R
8
7
6
5
r p 4
3
2
1
0 50 1CO 150 200 2 5 0 300 350 400 450 500 550
Elapsed Time (days)
FIGURE2 pH vs. Time (Bl-B4, B9)
-8 4
--'-BQ
0-: I
Elapsed 'rime (days)
150 200 1 5 0 300 350 400 450 so0 550
FIGURE3 pH vs. Time (PI, P2)
The effects of the sulfuric acid formation were seen
within the first forty days of biofilteroperation. In an effort
to control the decliningpH and alkalinity,the reactorswere
periodically flooded with sodium biocarbonate solutions
ranging from lop3 to lop2M. This had little effect on the
pH decline in the upper portions of the GAC reactors.While
pH could presumably have been controlled by continu-
ously monitored addition of base, such a system would not
be economically feasible on a full-scale unit.
During phase 2, pH control was continued only for reac-
tors B2 (GAC) and B4 (YWC), using a sodium bicarbonate
solution in concentrations up to a lo-' M. Reactor B4 re-
sponded better to the pH control efforts.The pH of reactor
B2 closely followed the pH in the uncontrolled reactors,
decliningthrough the end of the experiment on day 503. It
is likely that the acid on the surface of the carbon reacted
with the added base, while the sulfuricacid within the GAC
particles was left untreated. This acid diffused to the sur-
face of the particles, exhaustingthe added alkalinityshortly
after the treatment. Compost,with a lower porosity,did not
resist pH control.
The pH declined gradually in the upper 30 cm of all other
reactors during phase 2. Values approached an apparently
steady-state pH of two. The middle regions (at 46 cm) and
lower regions (at 92 cm) remained at neutral pH. The
pilot-scale reactors acidified more quickly and further into
the bed depths compared to the bench-scale reactors be-
cause of the higher air flow rates. This exceptionallyrapid
acidification may have upset the microbial process, giving
poor removal efficiencies in the compost pilot reactor. It is
also possible that the acids caused deterioration of the
compost mixture and air flow channeling. This was not
seen with the GAC reactors, indicating that the uniform,
acid resistant materialmay have prevented channelingfrom
occurring.
Removalefficienciesof both hydrogen sulfide and VOCs
were unaffected by slow pH declines. Sulfuroxidizingbac-
teria, such as 7biobacillussp., can grow in environments
where the pH ranges from 1 to 8 [ 3, 51. It is likely that as
the pH declines, various sulfur oxidizingspecies dominate
in the degradation process. Previous studies have shown
declines in hydrogen sulfide removal as the pH drops be-
low a value of 3.2 [ I.?]. This may occur at higher concen-
trations of hydrogen sulfide (100-400 ppmv), but such
conditionswill likely not exist in a P O W waste air stream.
For low concentrations of hydrogen sulfide ( < 5 ppmv), a
medium pH as low as 2.0 appears to have no effect on mi-
crobial degradation of contaminants.
Eventually, further declines in pH will kill the microor-
ganisms.Therefore,it is importantto maintainthe pH above
or at a value of two. Theoretically, this can be done by
simply washing out the generated acids as they are pro-
duced. The amount of water needed can be calculated by
assuming that all of the hydrogen sulfide is oxidized, and
the wash water carries away hydrogen ions at the concen-
tration indicated by the medium pH. For the hydrogen sul-
fide loads on the bench-scale reactors utilized in this ex-
periment, 0.15 liters/day of water would maintain the sys-
tem pH at a value of 2.0. Approximately 15,000 liters of
water/day would be needed to maintain a pH of 7.0. Be-
cause larger quantities of water are needed to maintain the
system at a higher pH, and removal performanceis similar,
operating costs can be reduced if the system is maintained
at the lower pH.
Mdshrre Content and Pressure h p
The success of biofiltration is contingent on maintaining
optimal moisture contents while minimizingpressure drop
across the bed. Average moisture content and pressure
drop values for reactor media during both phases of the
experiment were measured (Table 4). Optimum moisture
contents have been reported to range from 40 to 65% for
composts, and 40 to 50% for inorganicmedia such as GAC
[9, 101.For both runs of the experiment, moisture content
values for most of the bench-scale reactors were kept ap-
proximately constant and within the cited ranges. How-
ever, during phase 2, the GAC reactors (Bl, B2, B9) did oc-
TABLE4. Average MoistureContentsand PressureDrops(kPa/ meter)for Media
B1 B2 B3 B4 B9 PI P2
MoistureYo 41.9 41.8 67.9 66.5 45.3 N/A N/A
Pressure Drop (kPa) 0.09 0.16 0.17 0.24 0.15 N/A N/A
Phase 1
Phase 2
Moisture?4 32.1 33.9 61.3 64.2 38.6 33.5 23.5
PressureDrop (kPa) 0.12 0.10 0.05 0.25 0.14 0.08 0.04
Environmental Progress (Vol 15, No 3) Fall, 1996 145
6. casionally dry to moisture contents below these cited
ranges. These declines were only seen at the inlets of the
reactors. Samples from lower portions of these beds had
water contents within the optimum ranges.
The pilot-scale reactors of phase 2 showed varying re-
sults. Water content values in P1 ranged from 20% to 50%,
while P2 ranged from 10%to 45%.The averagevalues were
below the cited optimum ranges. However, visual inspec-
tion of the media, as well as microbial enumeration tech-
niques (not described here), indicated microorganism
growth was adequate. Even though optimal moisture con-
tent conditions were not always maintained, hydrogen sul-
fide and VOC removal remained consistently good.
All reactors during both phases of the experiment
showed average pressure drops of less than 0.25 kPa per
meter of bed material. The outlet ports of the compost re-
actors occasionally clogged. This created large pressure
drops in these columns which do not represent the actual
performance of the filter bed. These blockages were man-
ually removed. Excessive microbial growth was not a fac-
tor during the experiment, presumablybecause the organic
loading was low.
CONCLUSIONS
Biofiltration was effective in simultaneously removing
hydrogen sulfide, VOCs and toxic air emissions from dis-
charges of publicly owned treatment works. In terms of
degradability, data suggest that the order of removal effi-
ciency appears to be hydrogen sulfide > aromatics >
aldehydes and ketones > chlorinated hydrocarbons. The
preference for compounds with low molecular weights,
higher solubilitiesand less complex structures was evident
in the data.
For both the bench and pilot-scale reactors,TGNMOdata
suggest greater than 65% removal is possible regardless of
reactor pH conditions. Removal efficiencies for aromatics
ranged from 53 to 98%, aldehydes and ketones from 43 to
96% and chlorinated compounds from 0 to 98%. Complete
oxidation of hydrogen sulfide occurred at both the bench-
and pilot-scale levels.
An important differencebetween the bench-scale reactor
media was seen in the removal of some of the chlorinated
hydrocarbons. Tetrachloroethylene and trichloroethylene
removals by the GAC biofilters were greater than 66% and
58%, respectively. The compost reactors achieved limited
removal of these compounds (<44%). The formation of
anaerobic zones where reductive dehalogenation occurs
may explain the tetrachloroethylene and trichloroethylene
removals seen in the GAC reactors.
The pH-controlled and pH-uncontrolled bench reactors
were surprisinglysimilar in contaminant removal perform-
ance. The low pH GAC bench reactor was less effective in
benzene removal, but overall compared well with the pH-
controlled reactors. This suggests that POTWs may be able
to avoid the capital and operating costs needed to maintain
moderate pH values (5-7) using caustic while still achiev-
ing adequate odor and VOC removal.
For the pilot-scale reactors, at retention times less than
or equal to 70 seconds, the oxidation of hydrogen sulfide
was spread to greater depths in the filter material. This hy-
drogen sulfide oxidation promoted subsequent acidifica-
tion of the filter material. In the case of the compost bed
pilot-scale reactor, VOC removal performance was bin-
146 Fall, 1996
dered. This did not occur with the GAC pilot reactor,which
demonstrated adequate removal of VOCs (> 80%)at reten-
tion times as low as 17 seconds. This suggests that the high
capital costs of GAC may ultimately be justified for a full-
scale application because shorter retention times may be
used and less space will be required. The low capital costs
of the compost may be offset by the longer retention times
needed for adequate VOC removal and deterioration of the
medium.
The moisture contents of the biofilter media varied dur-
ing the experiments, but this variability did not effect the
pollutant removal capabilities of the reactors. Pressure
drops across the filter beds were below 0.25 kPa per me-
ter. This low pressure drop indicates that power consump-
tion will not be cost prohibitive in applications.
Overall, biofiltration of P O W waste air appears to be
effective, while being very resistant to changing environ-
mental conditions. This increases confidence in a technol-
ogy which must be used under conditions which are not
always optimal.
ACKNOWLEDGEMENTS
This research was partially funded by the Water Environ-
ment Research Foundation, County Sanitation Districts of
Orange County,Southern California Edison, and the South-
ern California Air Quality Management District. Special
thanks are due Chad Newton for his assistance with
medium analyses.
LITERATURECITED
1.
2.
3.
4.
5.
6.
7.
Bmck, T. D., and Madigan, M. T., Biology of MZ-
crooqanisms, Sixth Edition. Prentice Hall Inc., Engle-
wood Cliffs, NJ, p. 578 (1991).
Devinny,J., and D. Hodge, “Formationof Acidic and
Toxic Intermediates in Overloaded Ethanol Biofilters,”
J. Air & Waste Manage. Assoc., 45(2), pp. 125-131
(February 1995).
Devinny,J., Webster, T., Torres,E., and Basrai, S.,
“PCEand TCE Removalin AerobicBiofilters,”J. ofHaz.
Wasteand Haz. Materials, 12(3),pp. 283-293 (1995).
Enzien, M. V., Picardal,F., Hazen, T. C., Arnold, R.
G., and Fliermans, C. B., “ReductiveDechlorination
of Trichloroethylene and Tetrachloroethylene under
Aerobic Conditionsin a Sediment Column,” Appl. En-
viron. Microbiol., 60(6),p. 2200-2204 Oune 1994).
Furusawa,N.,Togashi,I., Hirai, M., Makato, S., and
Kubota, H., “Removal of Hydrogen Sulfide by a
Biofilter with Fibrous Peat,” J. Ferment. Technol.,
62(6),pp. 589-594 (1984).
Govind, R,mad,P. S. R V., and Bishop, D. F.,
“Studies on Anaerobic/Aerobic Degradation of Recal-
citrant Volatile Chlorinated Chemicals in a Gel-Bio-
mass Encapsulated Biofilter,” Presented at the IGT
Symposium on Gas, Oil, and Environmental Biotech-
nology, Institute of Gas Technology, Des Plaines, Illi-
nois (December 1994).
Islander, R. L,Devinny,J. S., Mansfeld, F., Postyn,
As,and S m ,H-, “MicrobialEcology of Crown corro-
sion in Sewers,” J Environment.Engineer.,117(8),pp,
751-770 (1991).
Environmental Progress (Vol. 15, No. 3)
7. 8.
9.
10.
Leson, G., and Winer, A. M., “Biofiltration:An Inno-
vative Air Pollution ControlTechnologyfor VOC Emis-
sions,” J. .4ir & Wmte Manage. Assoc., 41(8), pp.
1045-1054 (1991).
Medina,V. F., Webster, T., Ramaratnam, M., and
Devinny, J., “Treatment of Gasoline Residuals by
Granular Activated Carbon Based Biological Filtration,”
J. Environment. Science and Health, A30(2), pp.
407-422 (February l995).
Schroeder,E. D., Ergas, S. J., Chang, D. P. Y., and
Morton,R., “Controlof VOC Emissionsfrom a P O W
using a Compost Eiofilter,” Proceedings of the 65th
Annual Conference and Exposition of the WaterEnvi-
ronment Federation, New Orleans, Louisiana, (Sep-
tember 1992).
Environmental Progress (Vol. 15, No. 3)
11. Speitel, G. E., and McChy, D. S., “Biofilm Reactors
for Treatment of Gas Streams Containing Chlorinated
Solvents,” J. Environment. Engineering, 119(4), pp.
658-678 (April 1990).
12. Webster, T. S., Torres,E. M., and Basrai, S., “Study
of Biofiltration for Control of Odor, VOC and Toxic
Emissions from Wastewater Treatment Plants-Phase
I1 Bench- and Pilot-ScaleExperiments,”Proceedingsof
the 1995 Conference on Biofiltration, Los Angeles,
California (October 1995).
13. Yang, Y., and Allen, E. R,“Biofiltration Control of
Hydrogen Sulfide 1. Design and Operational Parame-
ters,”J. Air & WasteManage. Assoc.,44(7), p. 863-868
Ouly 1994).
Fall. 1996 147