The document describes an experiment to create and validate a mathematical model of the growth curve of E. coli bacteria after exposure to thermal shock at different temperatures. It discusses how temperature, initial bacterial concentration, and other factors affect the growth and decay rate of E. coli. The experiment subjects E. coli to thermal shock at temperatures from 45-70°C and measures its growth curve at 37°C compared to a control group grown at 37°C. The data will be used to create a growth curve model and compare the experimental and modeled curves.
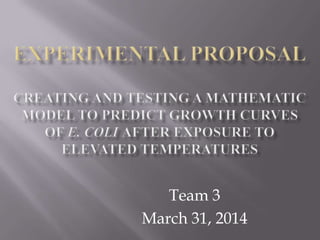


![WE WILL APPLY THIS
EQUATION TO CREATE THE
GROWTH CURVE MODEL[17]
Where:
(Nmin) = minimum
population of E.coli
(Nmax) = maximum
population of E.coli
r = Temperature-dependent
constant
C= Adjustment factor
N= number colonies at time t](https://image.slidesharecdn.com/experimentalproposalproblem3group3final-140403011939-phpapp02/85/BIOMED-Engineering-Experimental-proposal-for-Growth-E-Coli-7-320.jpg)


![[1] J. E. Bailey, "Mathematical Modeling and Analysis in Biochemical Engineering: Past Accomplishments and Future Opportunities,"
Institute of Biotechnology, 1998, pp. 8-20.
[2] J. Baranyi, "A non-autonomous differential equation to model bacterial growth," T. A. Roberts, ed., Food Microbiology, 1993, pp. 43-59.
[3] J. Baranyi, "A Review Paper: A Dynamic Approach to Predicting Bacterial Growth in Food," T. A. Roberts, ed., International Journal of
Food Microbiology, 1994, pp. 227-294.
[4] J. Baranyi, "Mathematics of predictive food microbiology," T. A. Roberts, ed., Food Microbiology, 1995, pp. 199-218.
[5] M. Berney, H. U. Weilenmann, J. Ihssen et al., “Specific growth rate determines the sensitivity of Escherichia coli to thermal, UVA, and
solar disinfection,” Applied and Environmental Microbiology, vol. 72, no. 4, pp. 2586-2593, Apr, 2006.
[6] M. P. Doyle, “ESCHERICHIA-COLI O157 - H7 AND ITS SIGNIFICANCE IN FOODS,” International Journal of Food Microbiology, vol.
12, no. 4, pp. 289-302, Apr, 1991.
[7] J. S. Edwards, "In silico predictions of Escherichia coli metabolic capabilities are consistent with experimental data," R. U. Ibarra, ed.,
Nature, 2001.
[8] H. Fujikawa, "A new logistic model for Escherichia coli growth at constant and dynamic temperatures,“ Morozumi, Satoshi A. Kai, ed.,
Food Microbiology, 2004, pp. 501-509.
[9] R. Ibarra, "Escherichia coli K-12 undergoes adaptive evolution to achieve in silico predicted optimal growth," J. S. Edwards, ed., Nature,
2002.
[10] A. G. Marr, "Growth Rate of Escherichia Coli," 2, American Society for Microbiology, 1991.
[11] J. M. Monk, P. Charusanti, R. K. Aziz et al., “Genome-scale metabolic reconstructions of multiple Escherichia coli strains highlight
strain-specific adaptations to nutritional environments,” Proceedings of the National Academy of Sciences of the United States of America,
vol. 110, no. 50, pp. 20338-20343, Dec, 2013.
[12] D.-H. Oh, "A New Secondary Model Developed for the Growth Rate of Escherichia coli O157:H7 in Broth," T. Ding, ed., Indian Journal
of Microbiology, 2012, pp. 99-101.
[13] M. O. Olanya, "Effects of temperatures and storage time on resting populations of Escherichia coli O157:H7 and Pseudomonas
fluorescens in vitro," D. O. Ukuku, ed., Food Control, 2014, pp. 128-134
[14] O. Rodriguez-Gonzalez, "Escherichia coli<font class=""> O157:H7 subjected to pulsed electric fields in milk," M. Walkling-Ribeiro, ed.,
International Dairy Journal, 2011, pp. 953-962.
[15] J. Samelis, and J. N. Sofos, “Role of glucose in enhancing the temperature-dependent growth inhibition of Escherichia coli O157 : H7
ATCC 43895 by a Pseudomonas sp,” Applied and Environmental Microbiology, vol. 68, no. 5, pp. 2600-2604, May, 2002.
[16] L. J. Tranvik, and M. G. Hofle, “BACTERIAL-GROWTH IN MIXED CULTURES ON DISSOLVED ORGANIC-CARBON FROM
HUMIC AND CLEAR WATERS,”Applied and Environmental Microbiology, vol. 53, no. 3, pp. 482-488, Mar, 1987.
[17] G. D. Wang, "Survival and growth of Escherichia coli O157:H7 in unpasteurized and pasteurized milk.," T. Zhao, ed., Journal of Food
Protection, 1997, pp. 610-613.
.](https://image.slidesharecdn.com/experimentalproposalproblem3group3final-140403011939-phpapp02/85/BIOMED-Engineering-Experimental-proposal-for-Growth-E-Coli-11-320.jpg)


