Downloaded 95 times

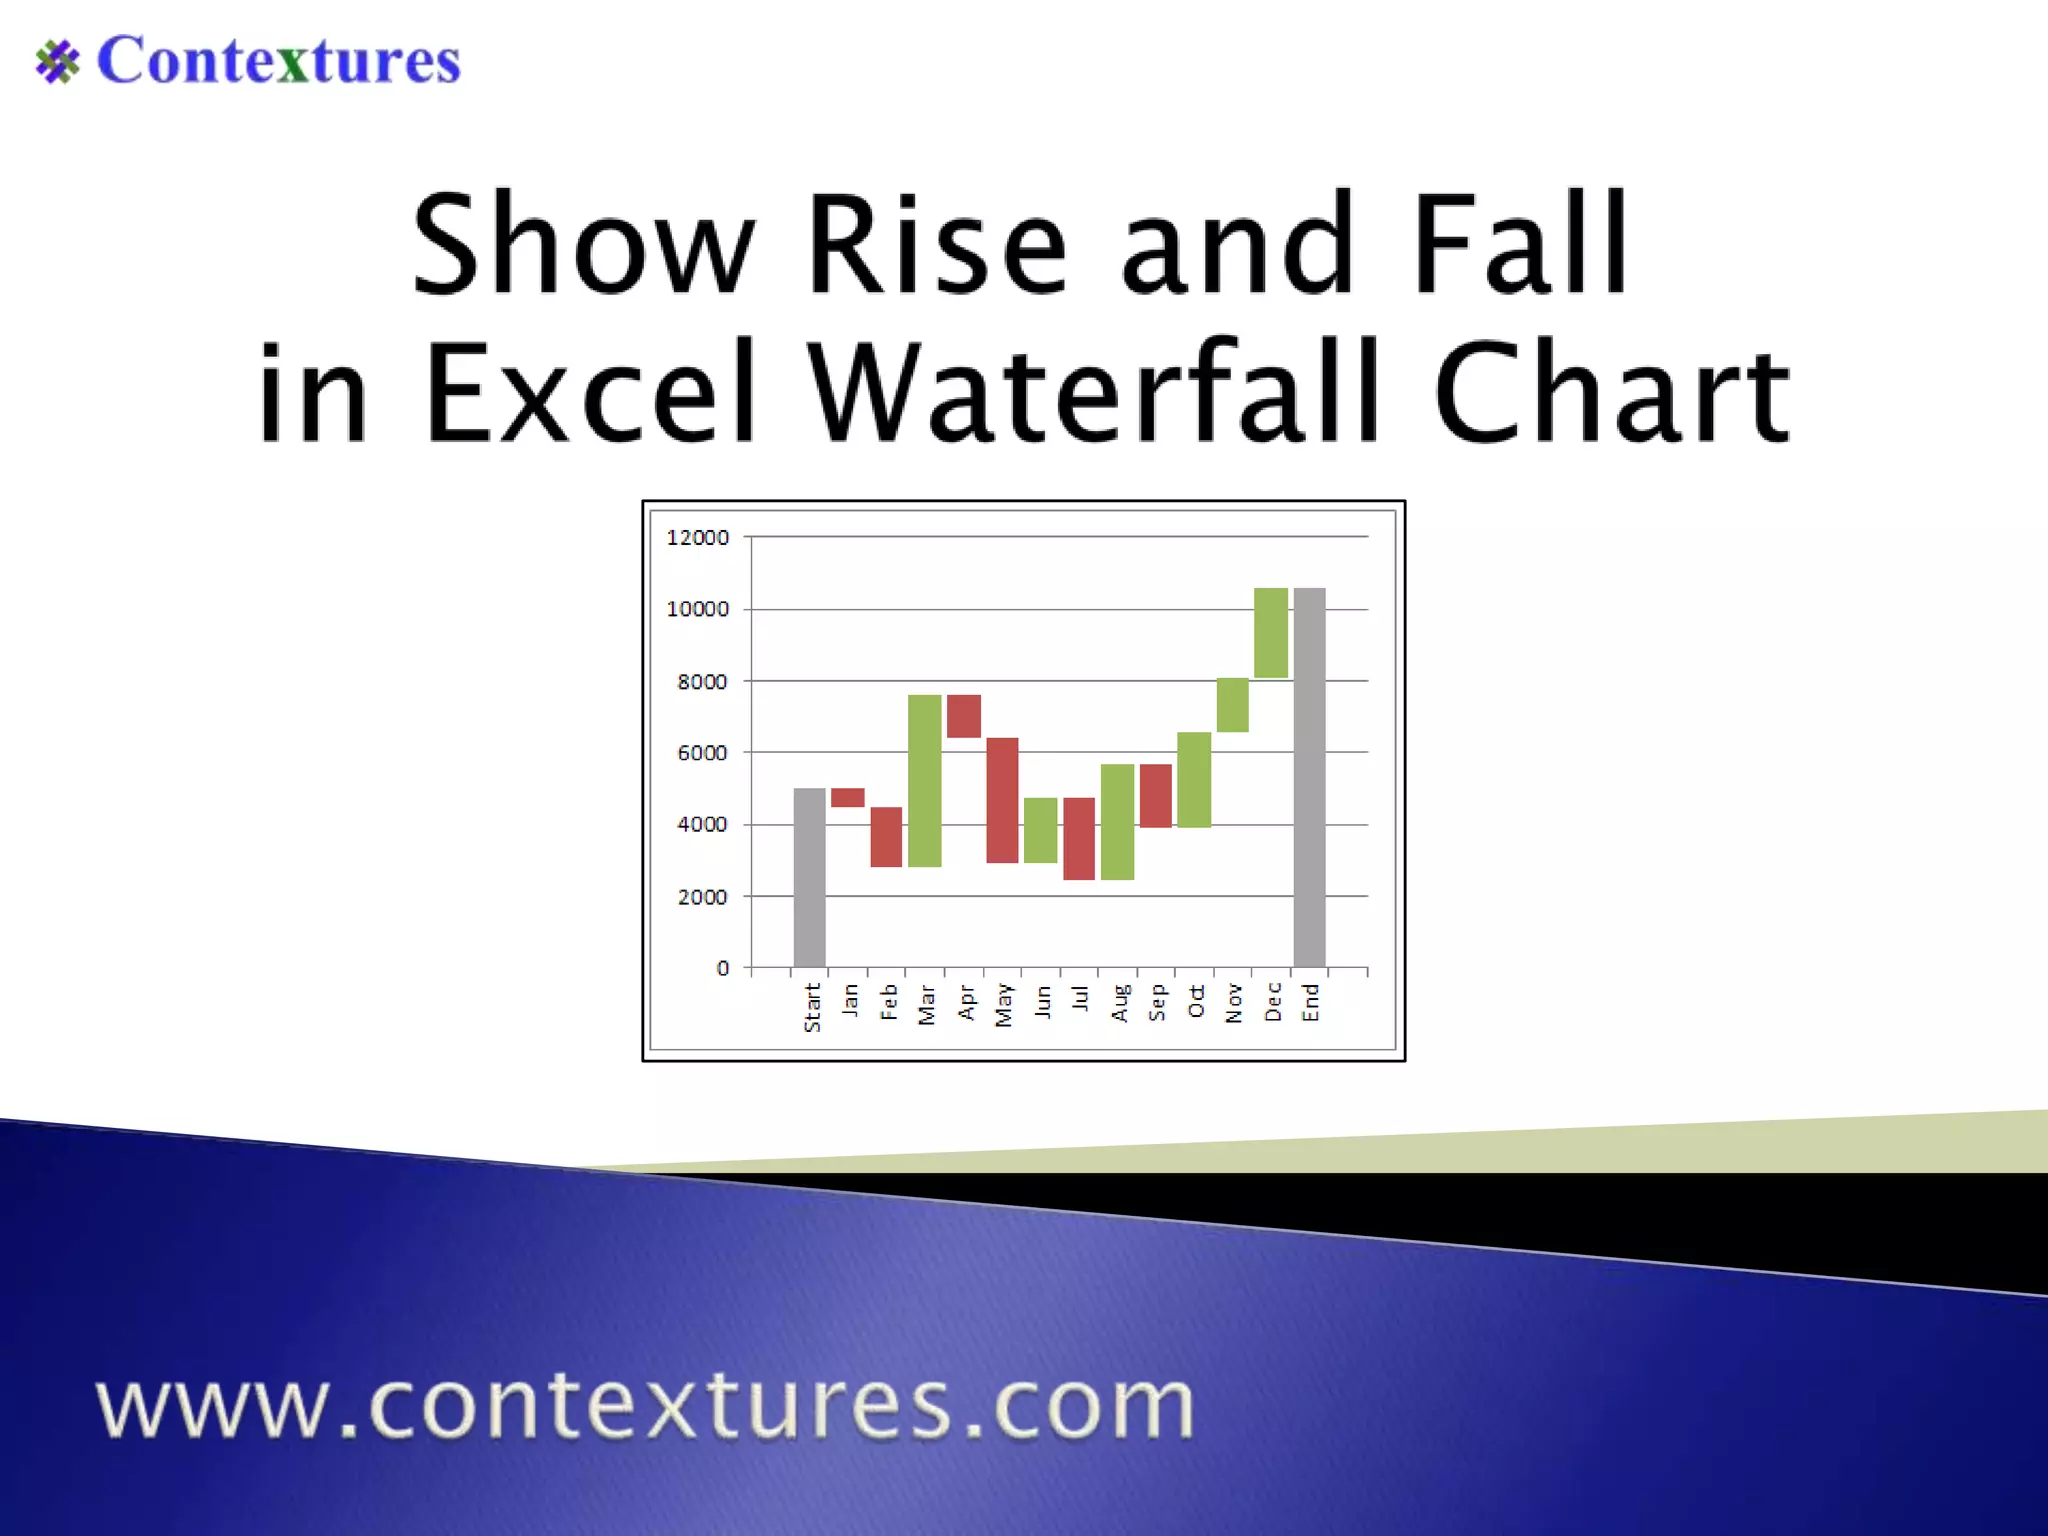
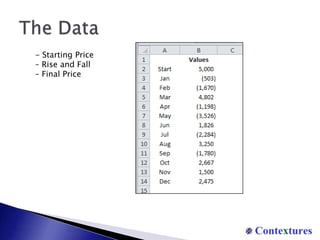
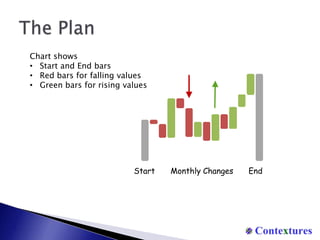
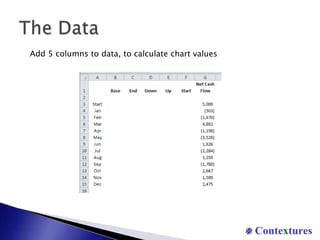
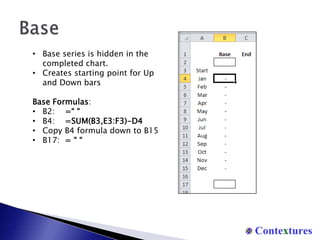
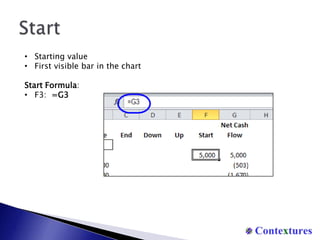
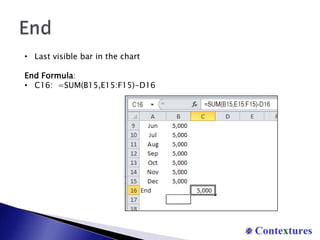
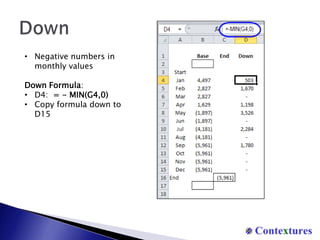
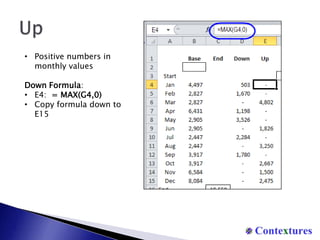
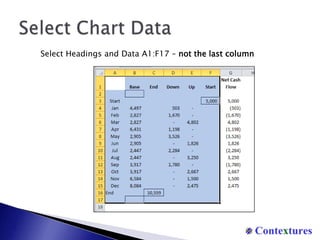
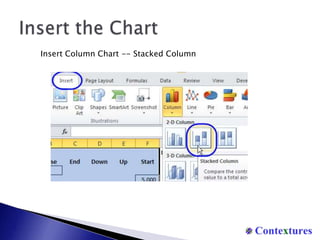
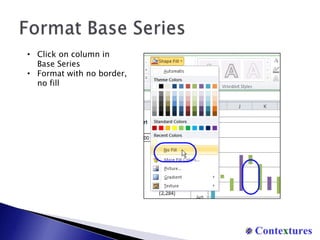
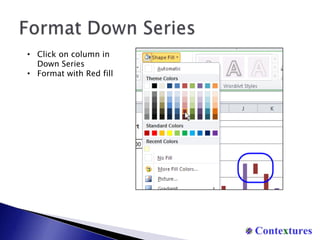
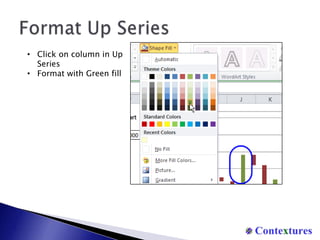
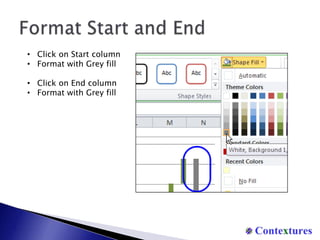
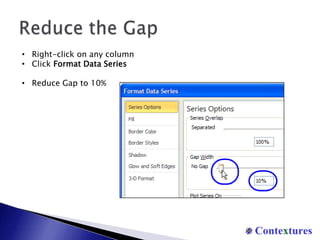

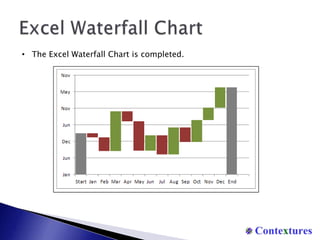


The document provides instructions for creating a waterfall chart in Excel to show rising and falling values over time. It describes adding columns to the data to calculate chart values, formatting the different series, and customizing the chart appearance. The completed chart uses colored bars and formatting to visually depict starting, ending, and monthly changing values in the data series.


![Getting Started with Apache Spark: Big Data Made Simple [Free Meetup]](https://cdn.slidesharecdn.com/ss_thumbnails/apachesparkgettingstarted-260203175547-8361bcc3-thumbnail.jpg?width=640&height=640&fit=bounds)


