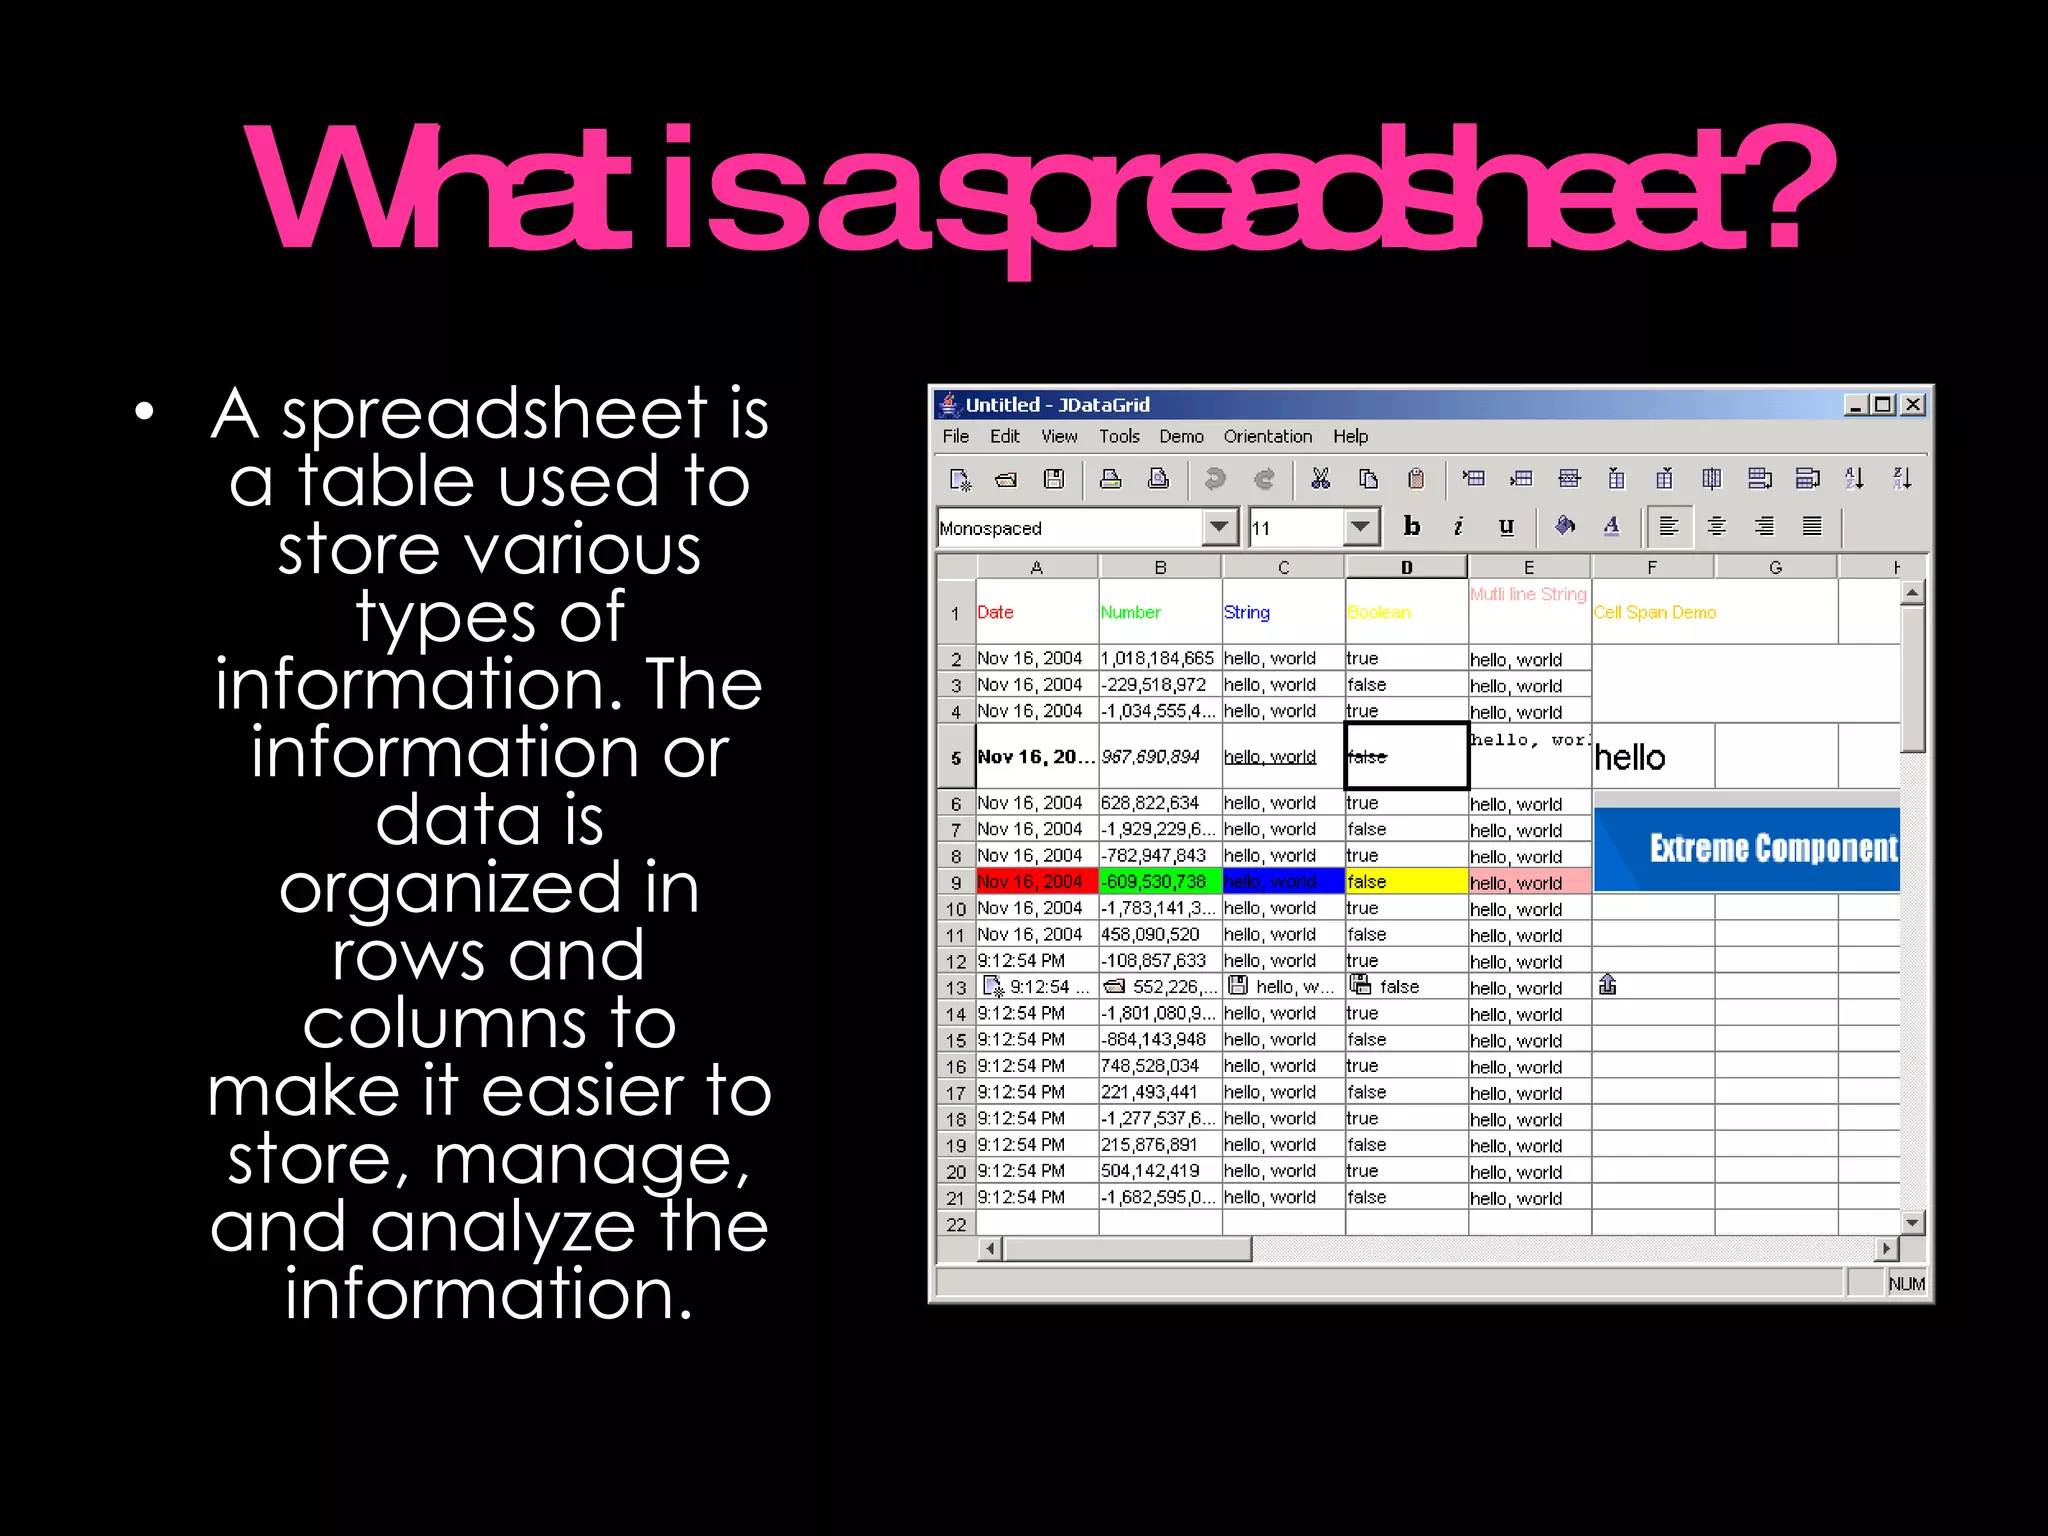
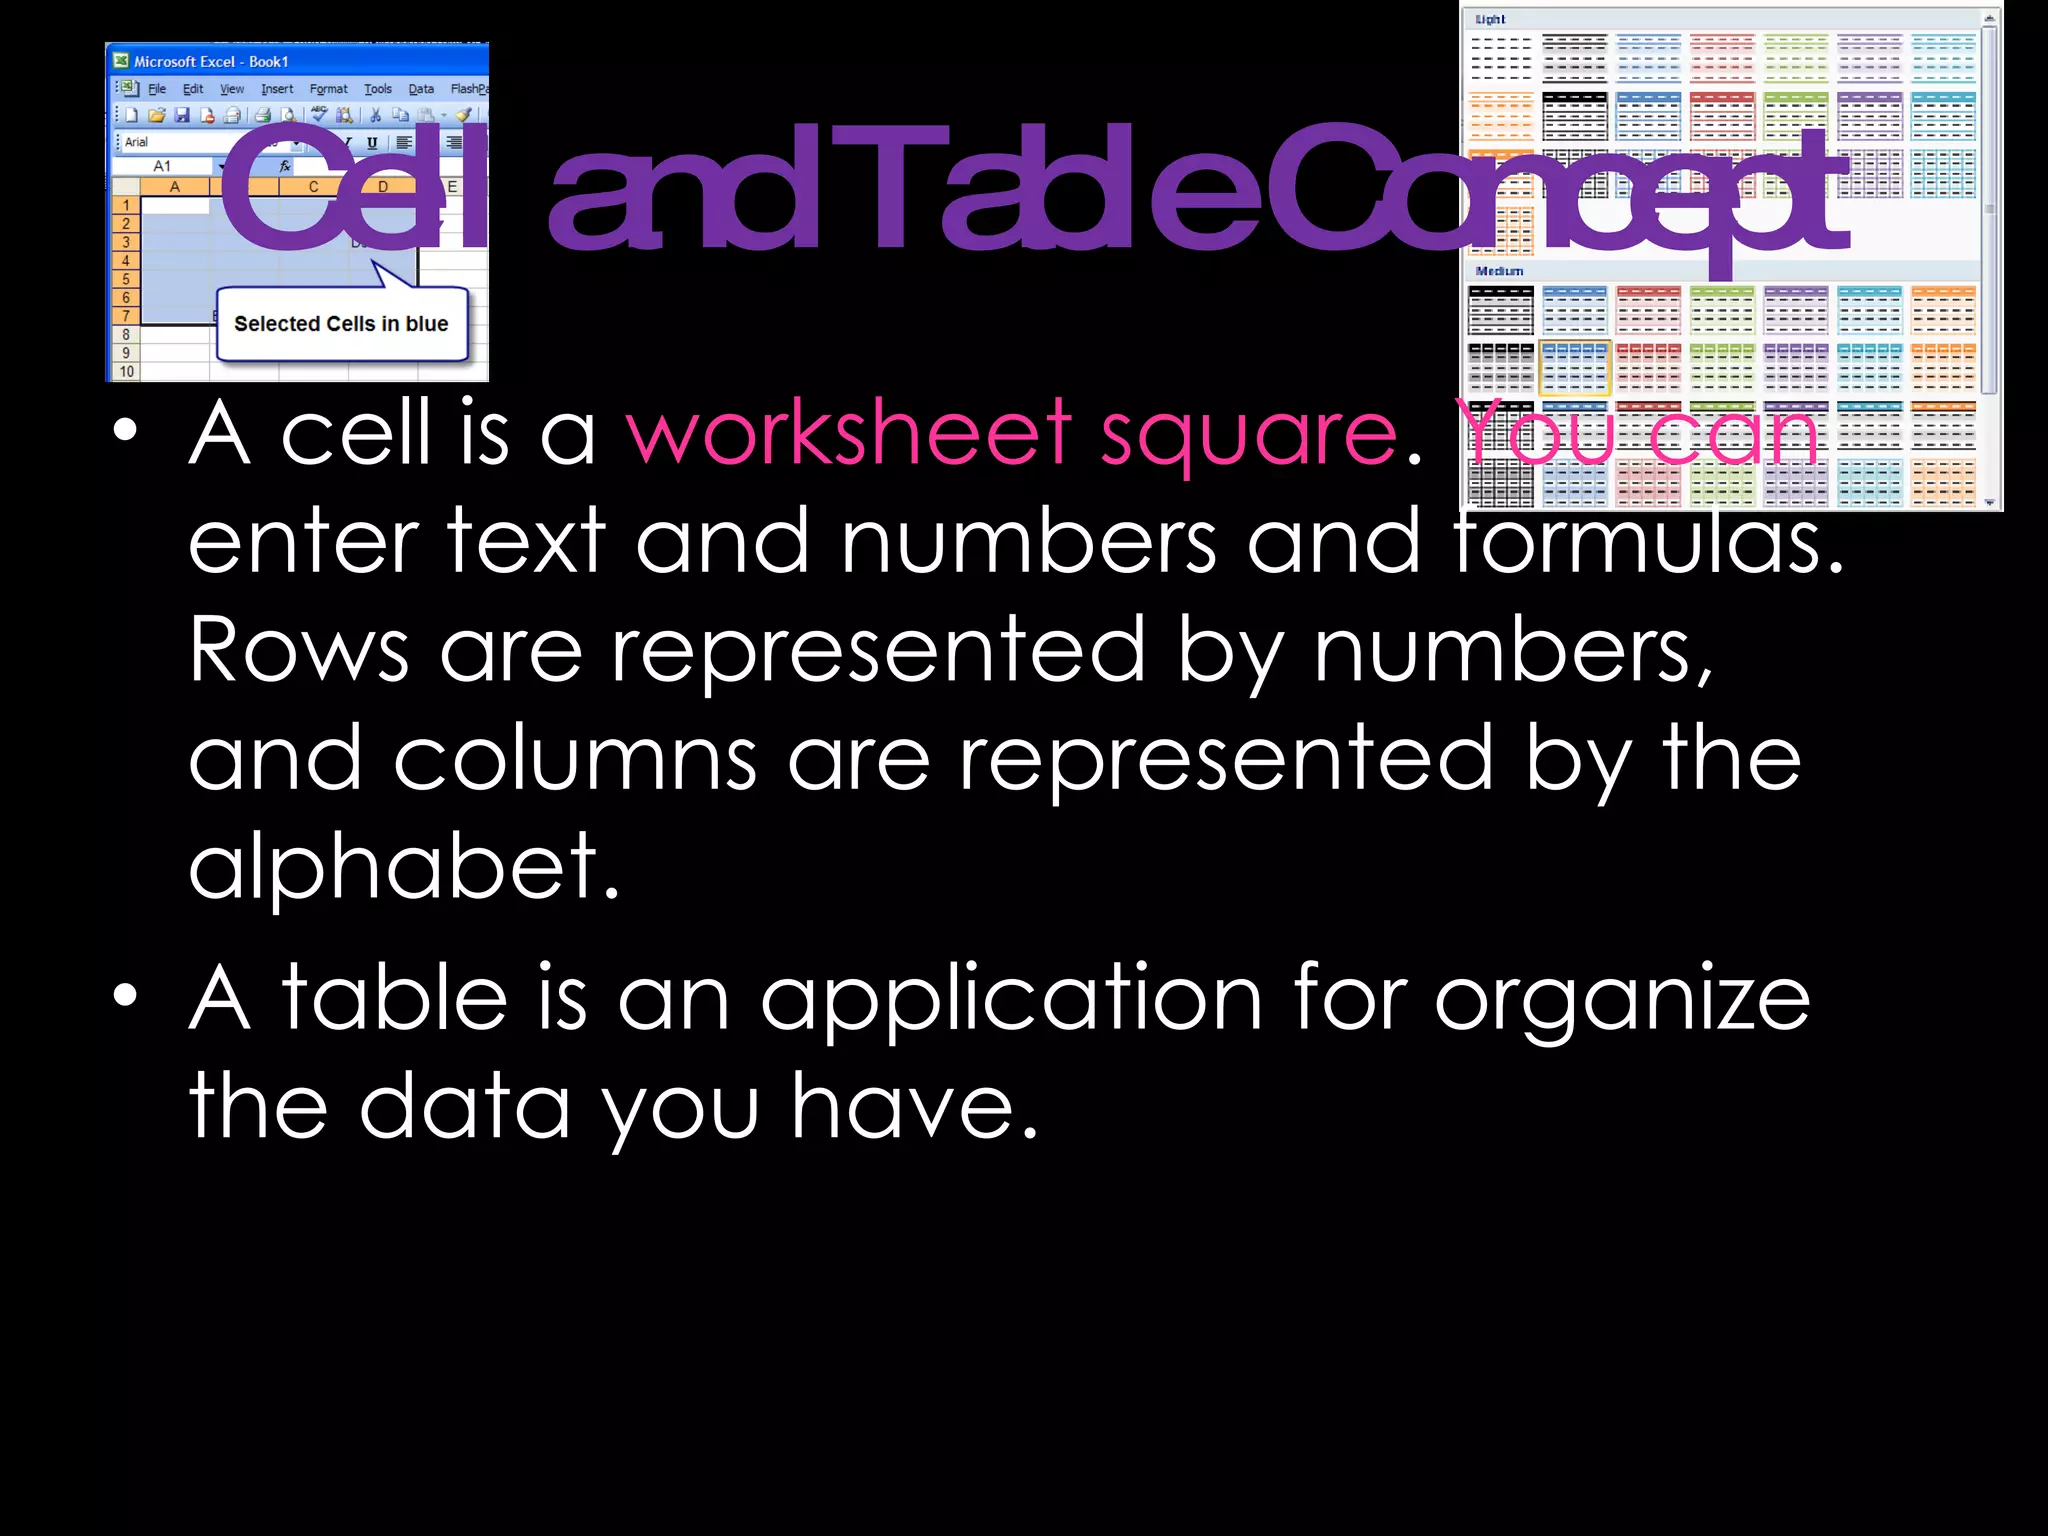
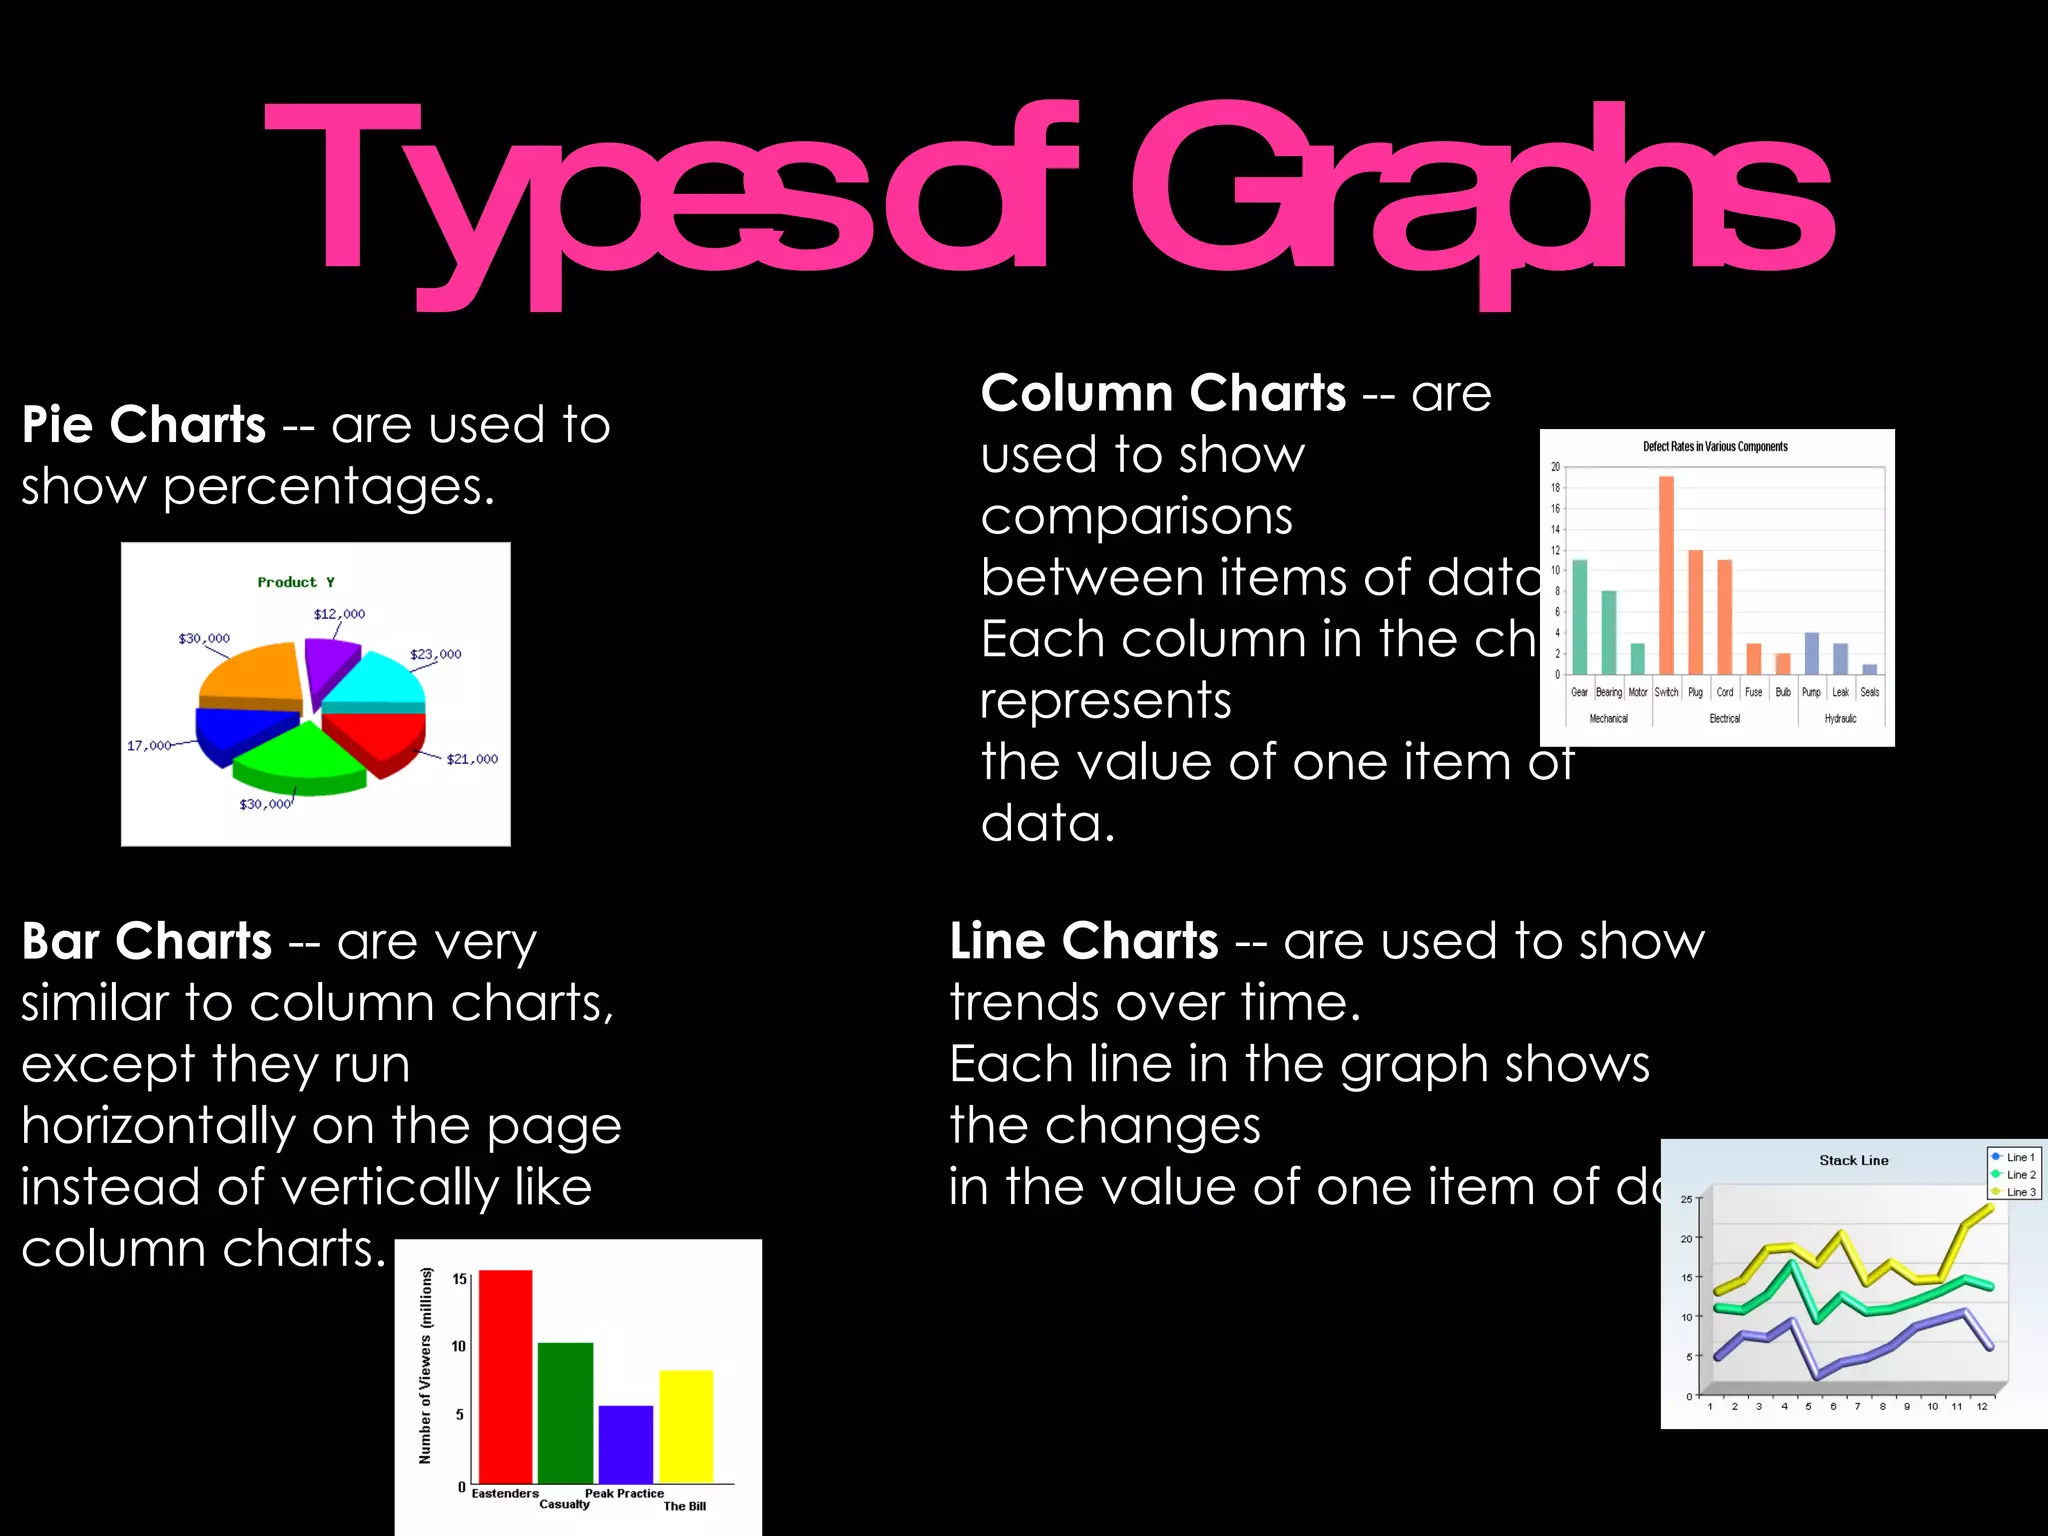
Tec de Monterrey Carolina Garcia 2°B, Educational Technology Miss Priscila Velázquez
What is Excel used for? Excel is a software that lets you create tables, and calculate and analyze data. This type of software is called spreadsheet software. Excel lets you create tables that automatically calculate the totals of numerical values you input, print out tables in neat layouts, and create simple graphs
What is a spreadsheet? A spreadsheet is a table used to store various types of information. The information or data is organized in rows and columns to make it easier to store, manage, and analyze the information.
Cell and Table Concept A cell is a  worksheet square .  You can  enter text and numbers and formulas. Rows are represented by numbers, and columns are represented by the alphabet.  A table is an application for organize the data you have.
Charts or Graphs Charts are what we call graphs in math class. They also happen to be called graphs in spreadsheet programs such as Lotus 1-2-3 and Quattro Pro. Only in Microsoft Excel it seems are they called charts.
Types of Graphs Pie Charts  -- are used to  show percentages. Column Charts  -- are used to show comparisons  between items of data.  Each column in the chart represents the value of one item of data.   Bar Charts  -- are very similar to column charts,  except they run horizontally on the page  instead of vertically like column charts.   Line Charts  -- are used to show  trends over time.  Each line in the graph shows  the changes  in the value of one item of data.

Excel

  • 1.
    Tec de MonterreyCarolina Garcia 2°B, Educational Technology Miss Priscila Velázquez
  • 2.
    What is Excelused for? Excel is a software that lets you create tables, and calculate and analyze data. This type of software is called spreadsheet software. Excel lets you create tables that automatically calculate the totals of numerical values you input, print out tables in neat layouts, and create simple graphs
  • 3.
    What is aspreadsheet? A spreadsheet is a table used to store various types of information. The information or data is organized in rows and columns to make it easier to store, manage, and analyze the information.
  • 4.
    Cell and TableConcept A cell is a worksheet square . You can enter text and numbers and formulas. Rows are represented by numbers, and columns are represented by the alphabet. A table is an application for organize the data you have.
  • 5.
    Charts or GraphsCharts are what we call graphs in math class. They also happen to be called graphs in spreadsheet programs such as Lotus 1-2-3 and Quattro Pro. Only in Microsoft Excel it seems are they called charts.
  • 6.
    Types of GraphsPie Charts -- are used to show percentages. Column Charts -- are used to show comparisons between items of data. Each column in the chart represents the value of one item of data. Bar Charts -- are very similar to column charts, except they run horizontally on the page instead of vertically like column charts. Line Charts -- are used to show trends over time. Each line in the graph shows the changes in the value of one item of data.