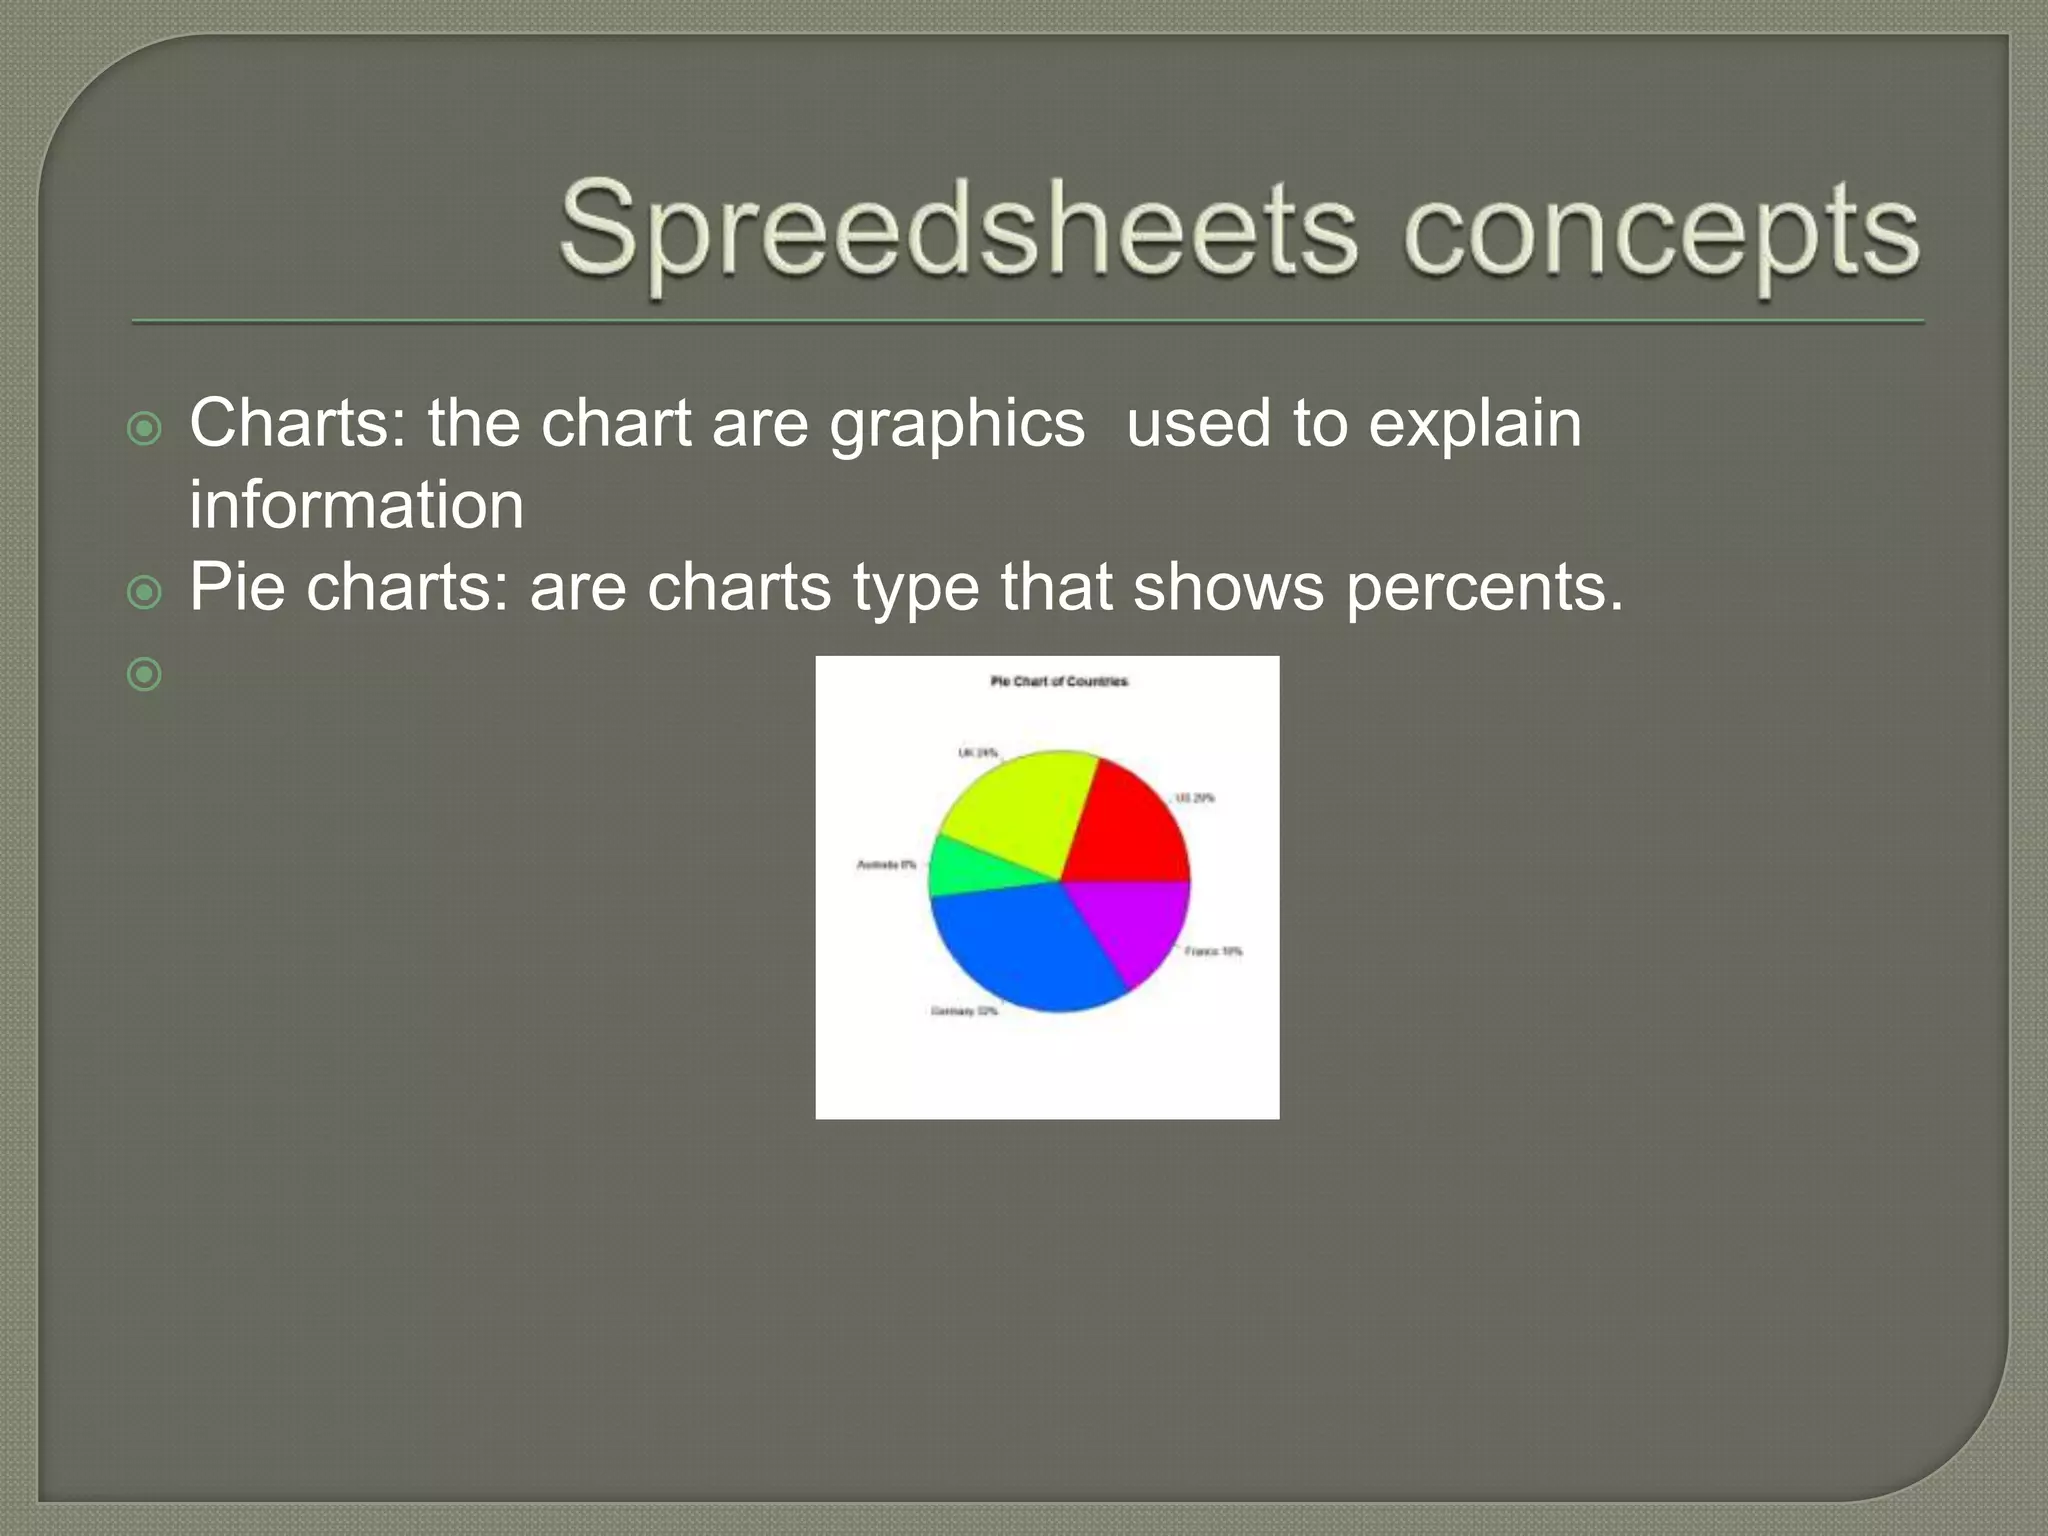
Starting with Microsoft ExcelJosé (Mindfreak) Sandoval2°B Secundaria TecEducational TechnologyPriscila Velasquez
Whatis Excel?Excel is software that lets you create tables, and calculate and analyze data. This type of software is called spreadsheet software. Excel lets you create tables that automatically calculate the totals of numerical values you input, print out tables in neat layouts, and create simple graphs
WorksheetA worksheetis a excel page in whereyou can work.
CellsA cellisone of thesquares in Excel. Itisusedtowriteinformation in there.
TablesA tableis a group of cells, Thetableismade of column and lines. There are manytipes of tables, theseisthemostcommon.
SpreedsheetsconceptsCharts: the chart are graphicsusedtoexplaininformationPie charts: are charts typethat shows percents.
Column Charts : This chart type is used to compare and contrast.Bar charts: This chart typeislikecolumn charts butitishorizontaly.
Line charts: This charts are usedtoexplaininformationfromdifferent time.

Starting With Microsoft Excel

  • 1.
    Starting with MicrosoftExcelJosé (Mindfreak) Sandoval2°B Secundaria TecEducational TechnologyPriscila Velasquez
  • 2.
    Whatis Excel?Excel issoftware that lets you create tables, and calculate and analyze data. This type of software is called spreadsheet software. Excel lets you create tables that automatically calculate the totals of numerical values you input, print out tables in neat layouts, and create simple graphs
  • 3.
    WorksheetA worksheetis aexcel page in whereyou can work.
  • 4.
    CellsA cellisone ofthesquares in Excel. Itisusedtowriteinformation in there.
  • 5.
    TablesA tableis agroup of cells, Thetableismade of column and lines. There are manytipes of tables, theseisthemostcommon.
  • 6.
    SpreedsheetsconceptsCharts: the chartare graphicsusedtoexplaininformationPie charts: are charts typethat shows percents.
  • 7.
    Column Charts :This chart type is used to compare and contrast.Bar charts: This chart typeislikecolumn charts butitishorizontaly.
  • 8.
    Line charts: Thischarts are usedtoexplaininformationfromdifferent time.