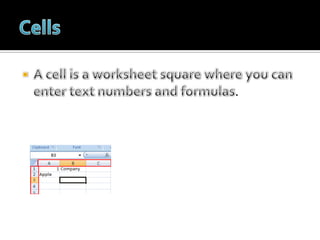
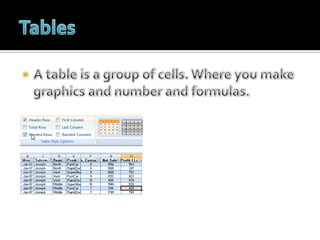
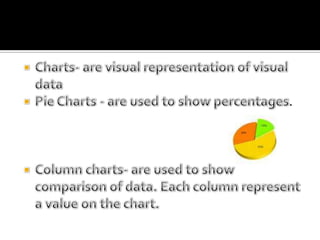
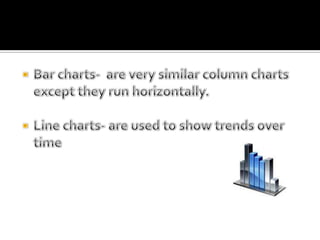
StartingWithMicrosoftExcelArturo Domínguez   2BEducational TechnologyPriscila Velasquez
What is Excel?Excel is software that lets you create tables, and calculate and analyze data. This type of software is called spreadsheet software. Excel lets you create tables that automatically calculate the totals of numerical values you input, print out tables in neat layouts, and create simple graphs.Excel is a part of "Office", a suite of products combining several types of software for creating documents, spreadsheets, and presentations, and for managing e-mail.
Excel is a spreadsheet software, but because it has a wealth of table layout features and printing can be limited to one page, there are people who use it also as a documentation creation software
CellsA cell is a worksheet square whereyou can entertextnumbers and formulas.
TablesA table is a group of cells. Whereyoumakegraphics and number and formulas.
Charts- are visual representation of visual dataPie Charts - are used to show percentages. Column charts- are usedto show comparison of data. Eachcolumnrepresent a valueonthe chart.
Bar charts-  are very similar column charts excepttheyrunhorizontally.Line charts- are usedto show trendsover time

Excel Presentaion

  • 1.
    StartingWithMicrosoftExcelArturo Domínguez 2BEducational TechnologyPriscila Velasquez
  • 2.
    What is Excel?Excelis software that lets you create tables, and calculate and analyze data. This type of software is called spreadsheet software. Excel lets you create tables that automatically calculate the totals of numerical values you input, print out tables in neat layouts, and create simple graphs.Excel is a part of "Office", a suite of products combining several types of software for creating documents, spreadsheets, and presentations, and for managing e-mail.
  • 3.
    Excel is aspreadsheet software, but because it has a wealth of table layout features and printing can be limited to one page, there are people who use it also as a documentation creation software
  • 4.
    CellsA cell isa worksheet square whereyou can entertextnumbers and formulas.
  • 5.
    TablesA table isa group of cells. Whereyoumakegraphics and number and formulas.
  • 6.
    Charts- are visualrepresentation of visual dataPie Charts - are used to show percentages. Column charts- are usedto show comparison of data. Eachcolumnrepresent a valueonthe chart.
  • 7.
    Bar charts- are very similar column charts excepttheyrunhorizontally.Line charts- are usedto show trendsover time