Downloaded 18 times

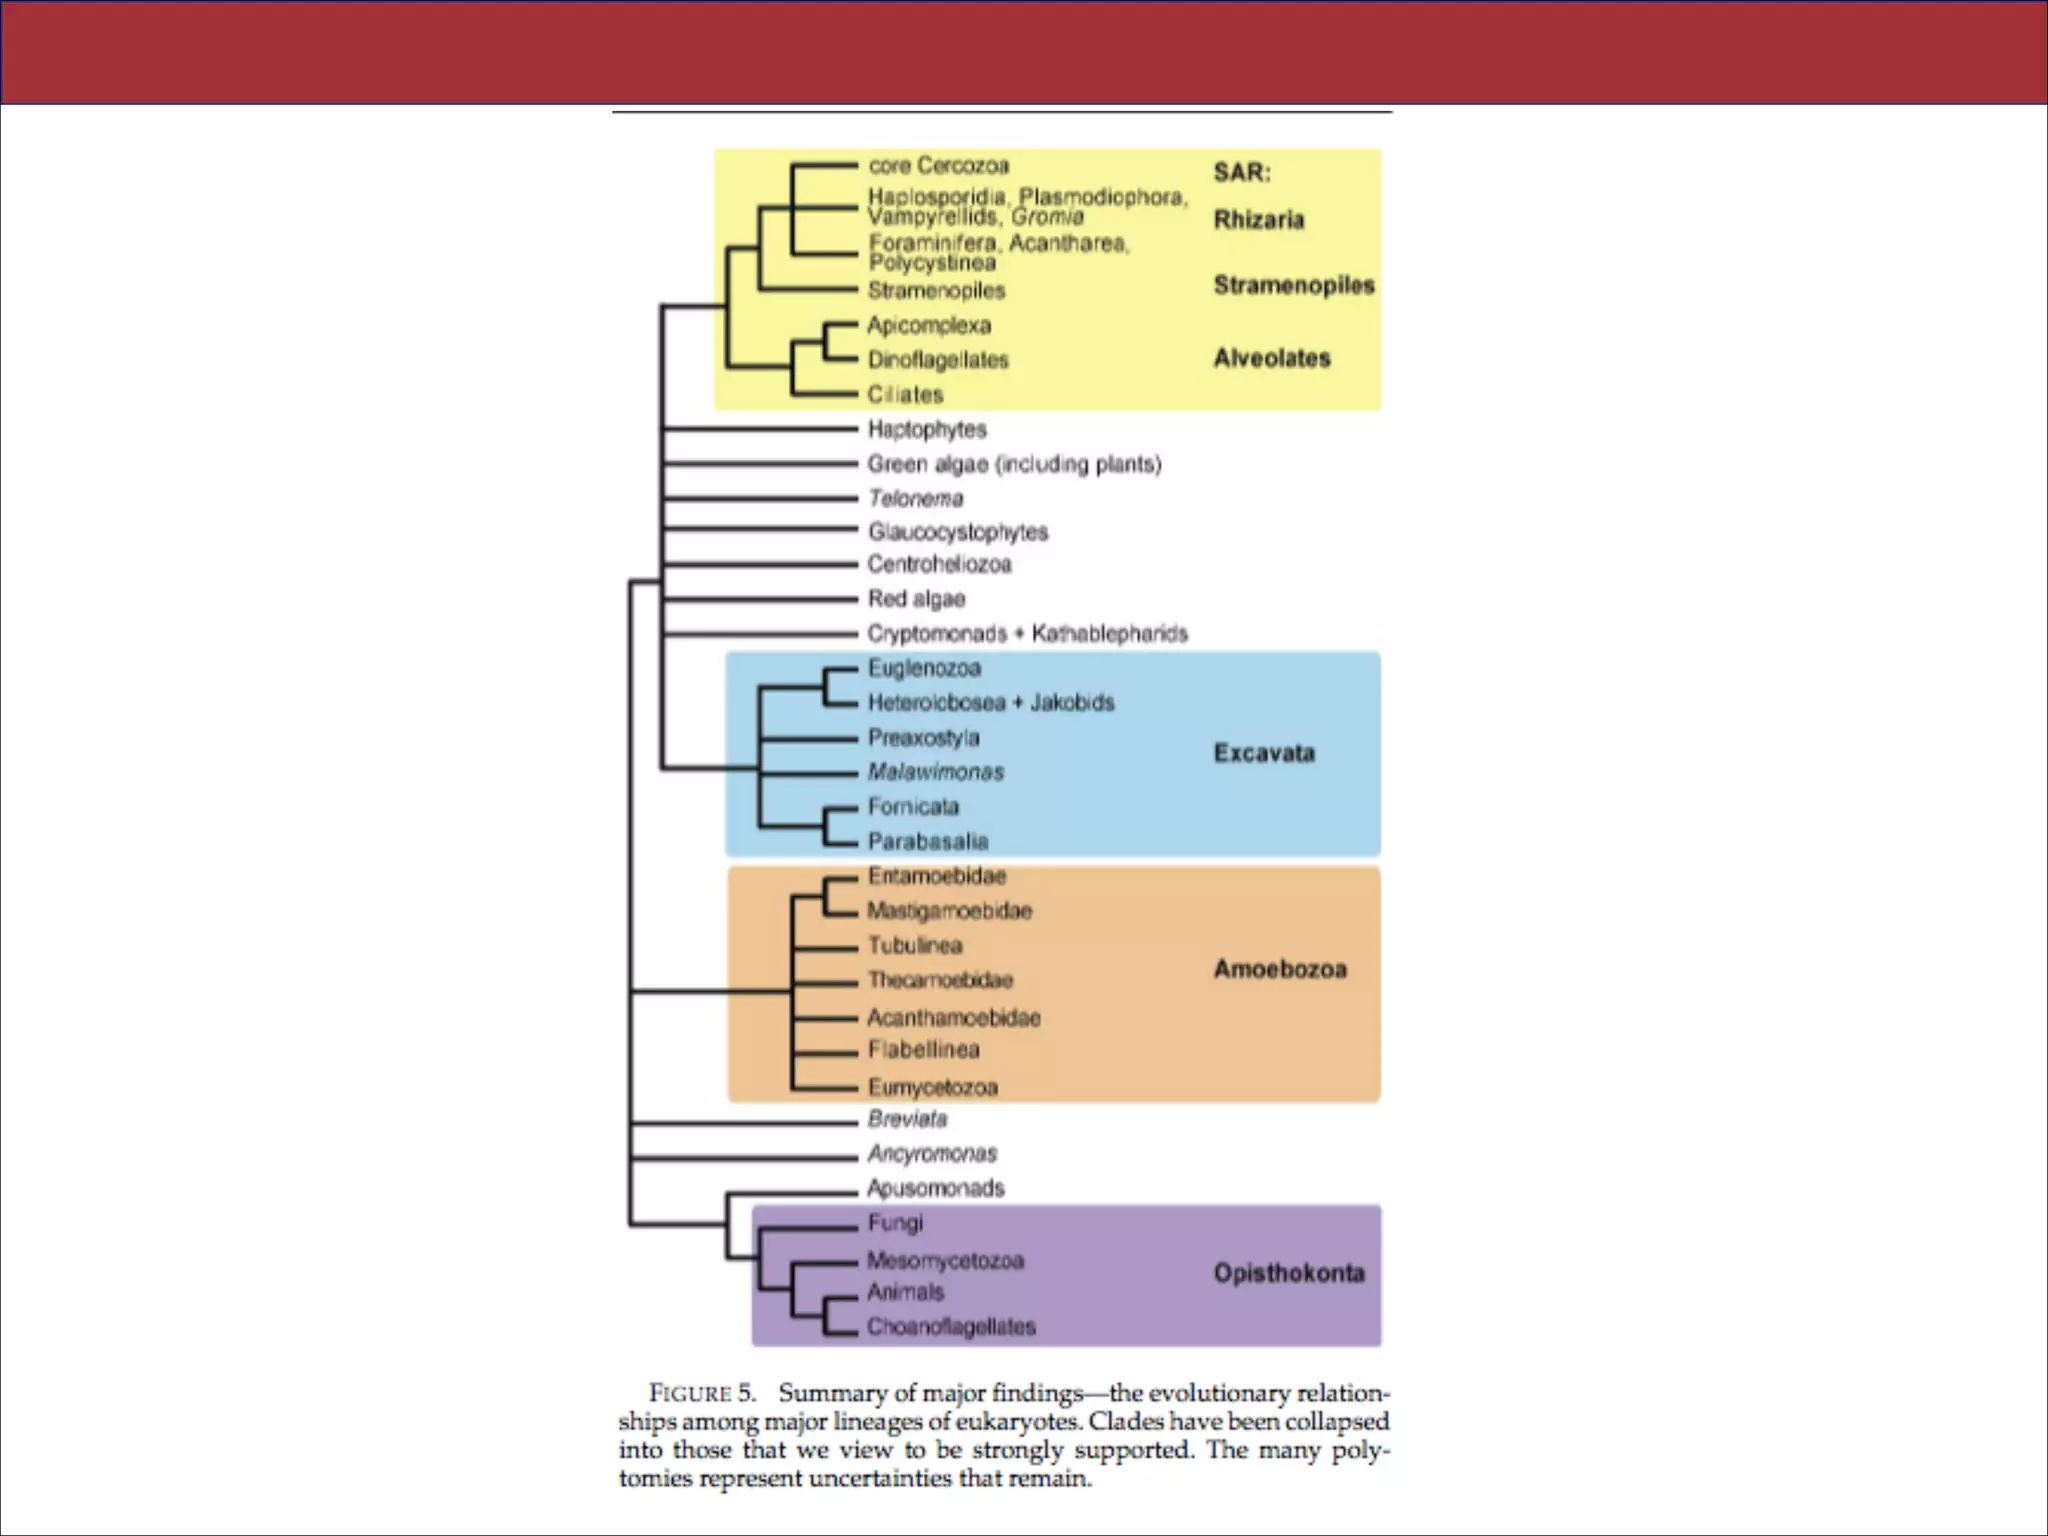
![Abstract.—An accurate reconstruction of the eukaryotic tree of life is essential to identify the
innovations underlying the diversity of microbial and macroscopic (e.g., plants and animals)
eukaryotes. Previous work has divided eukaryotic diver- sity into a small number of high-level
“supergroups,” many of which receive strong support in phylogenomic analyses. However, the
abundance of data in phylogenomic analyses can lead to highly supported but incorrect
relationships due to systematic phylogenetic error. Furthermore, the paucity of major eukaryotic
lineages (19 or fewer) included in these genomic studies may exaggerate systematic error and
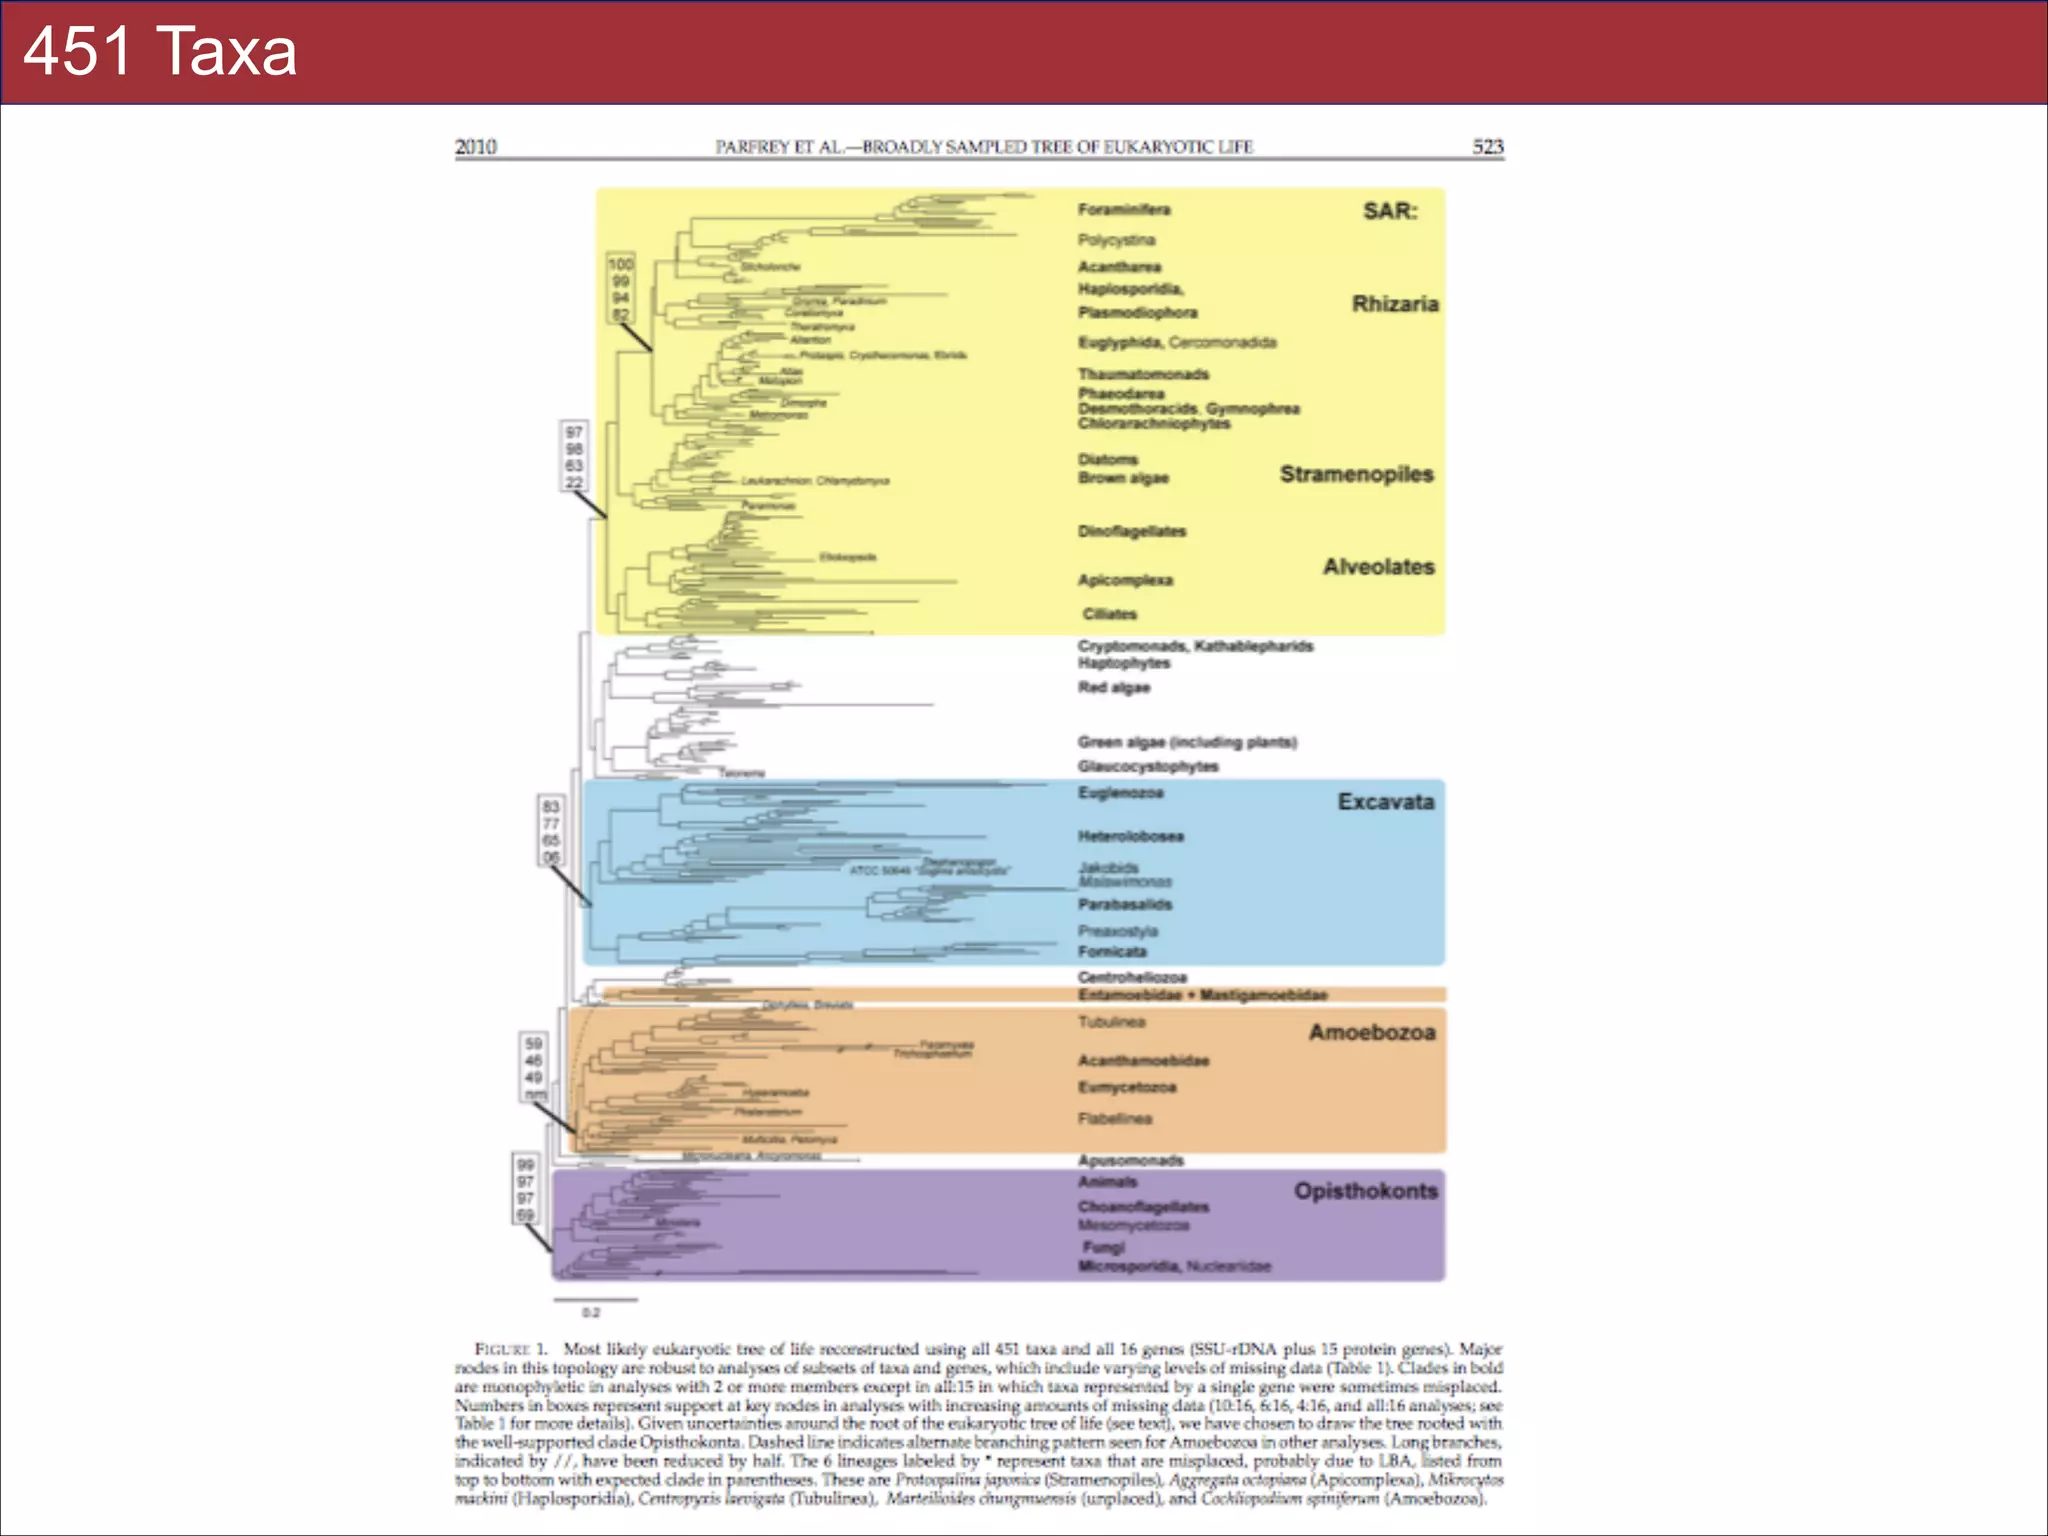
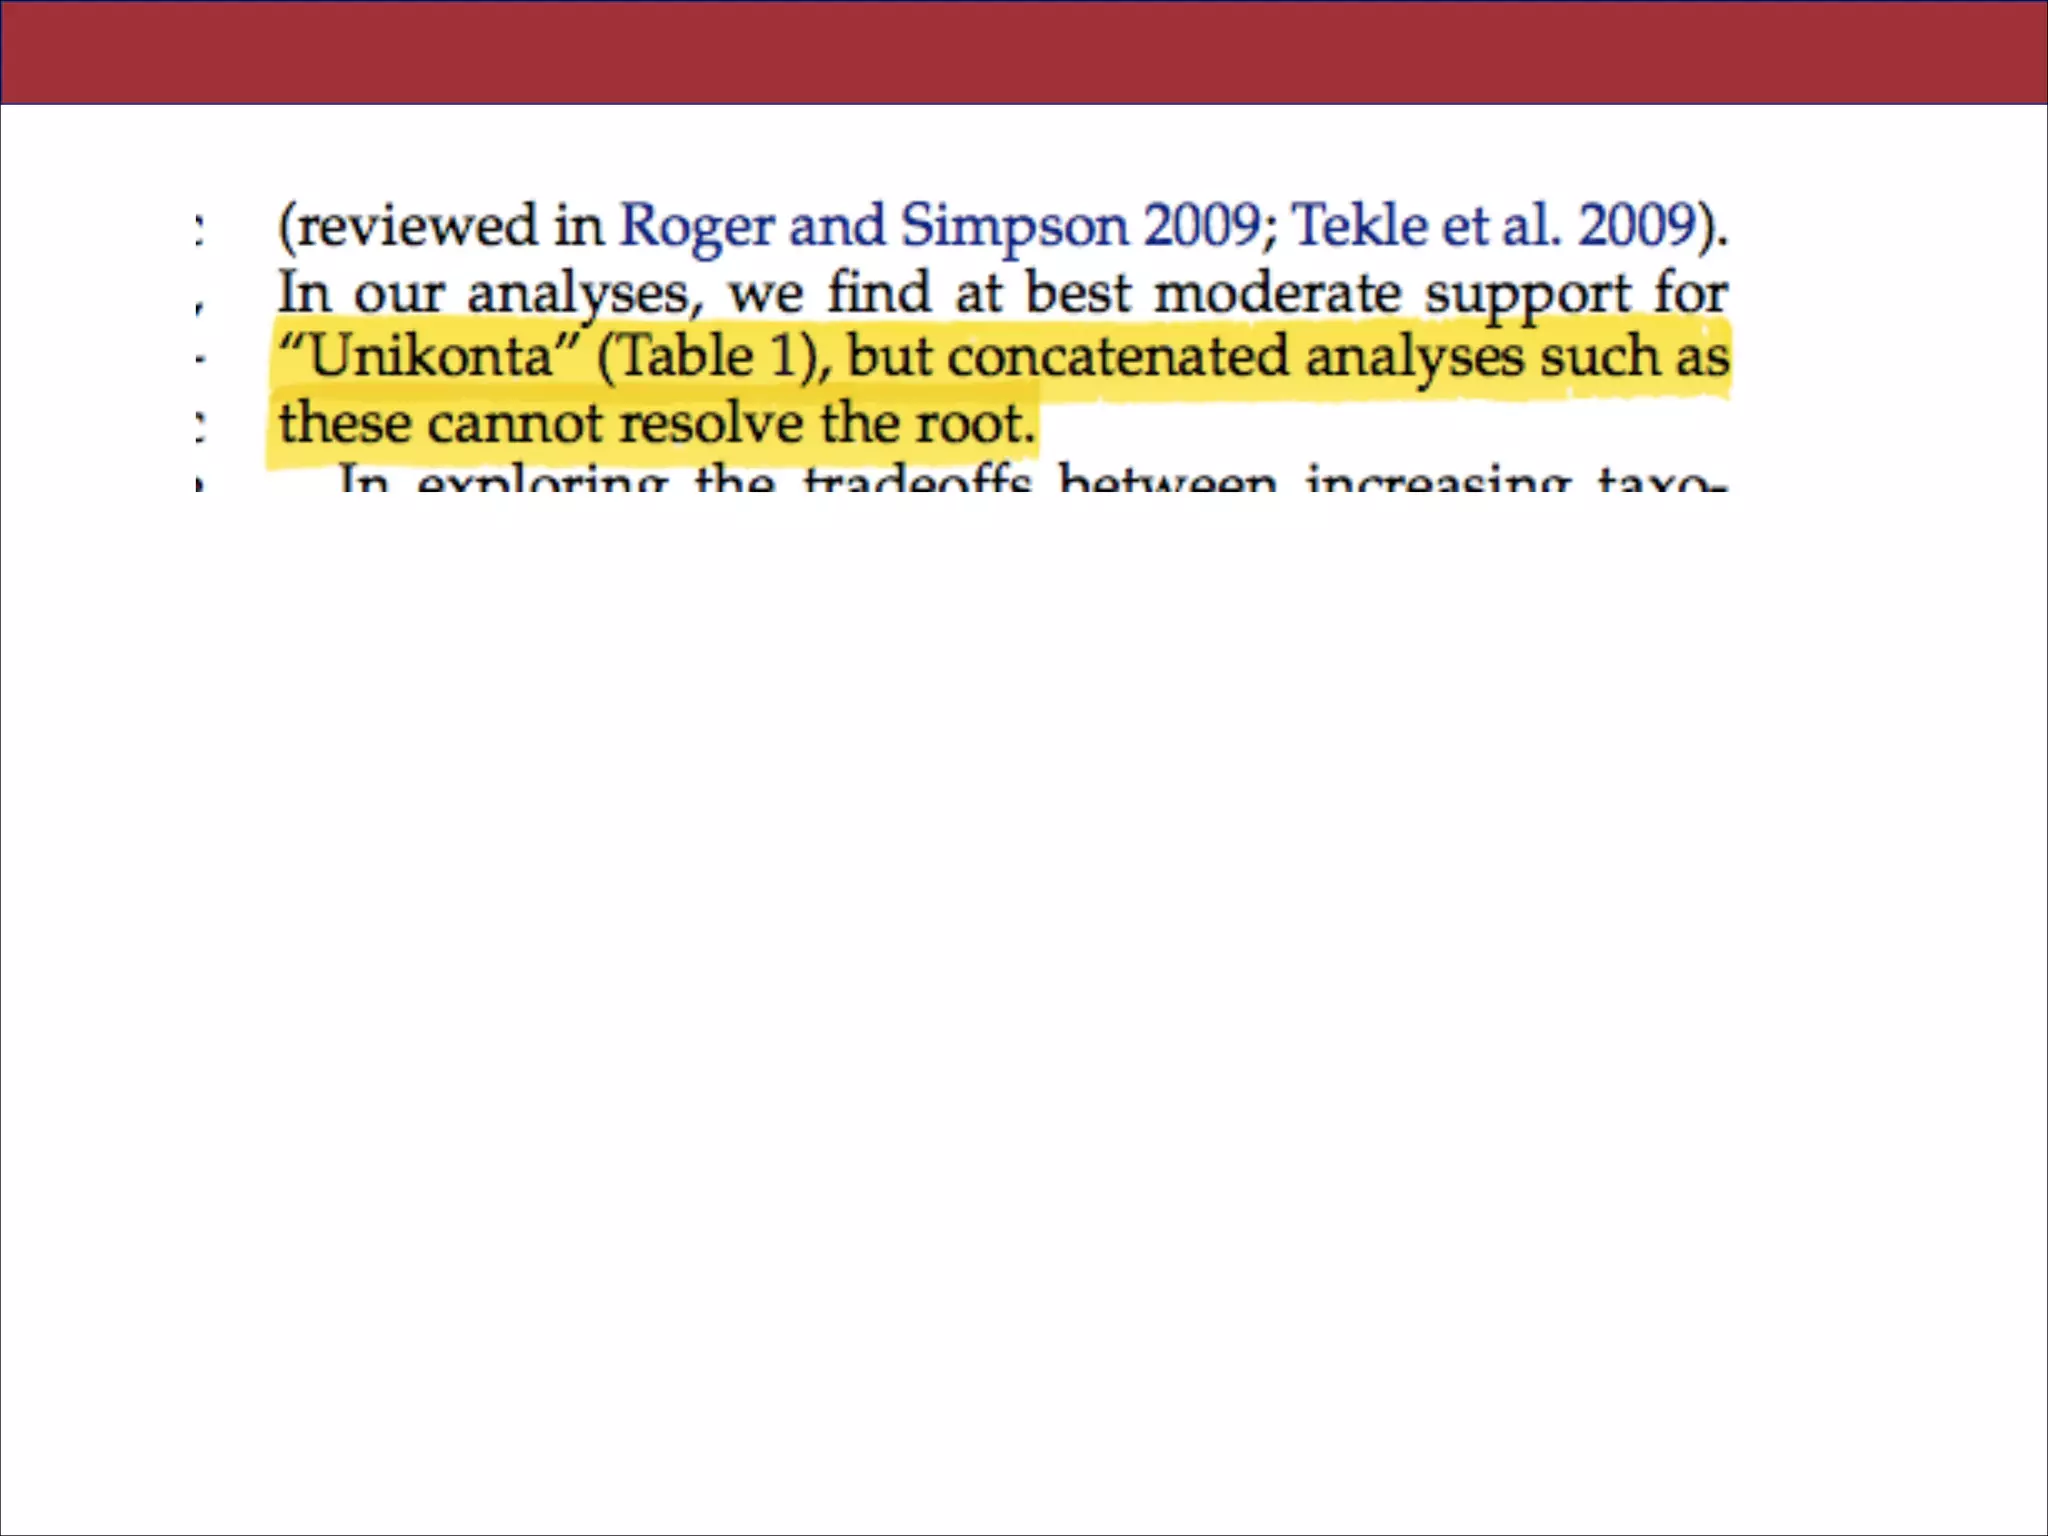
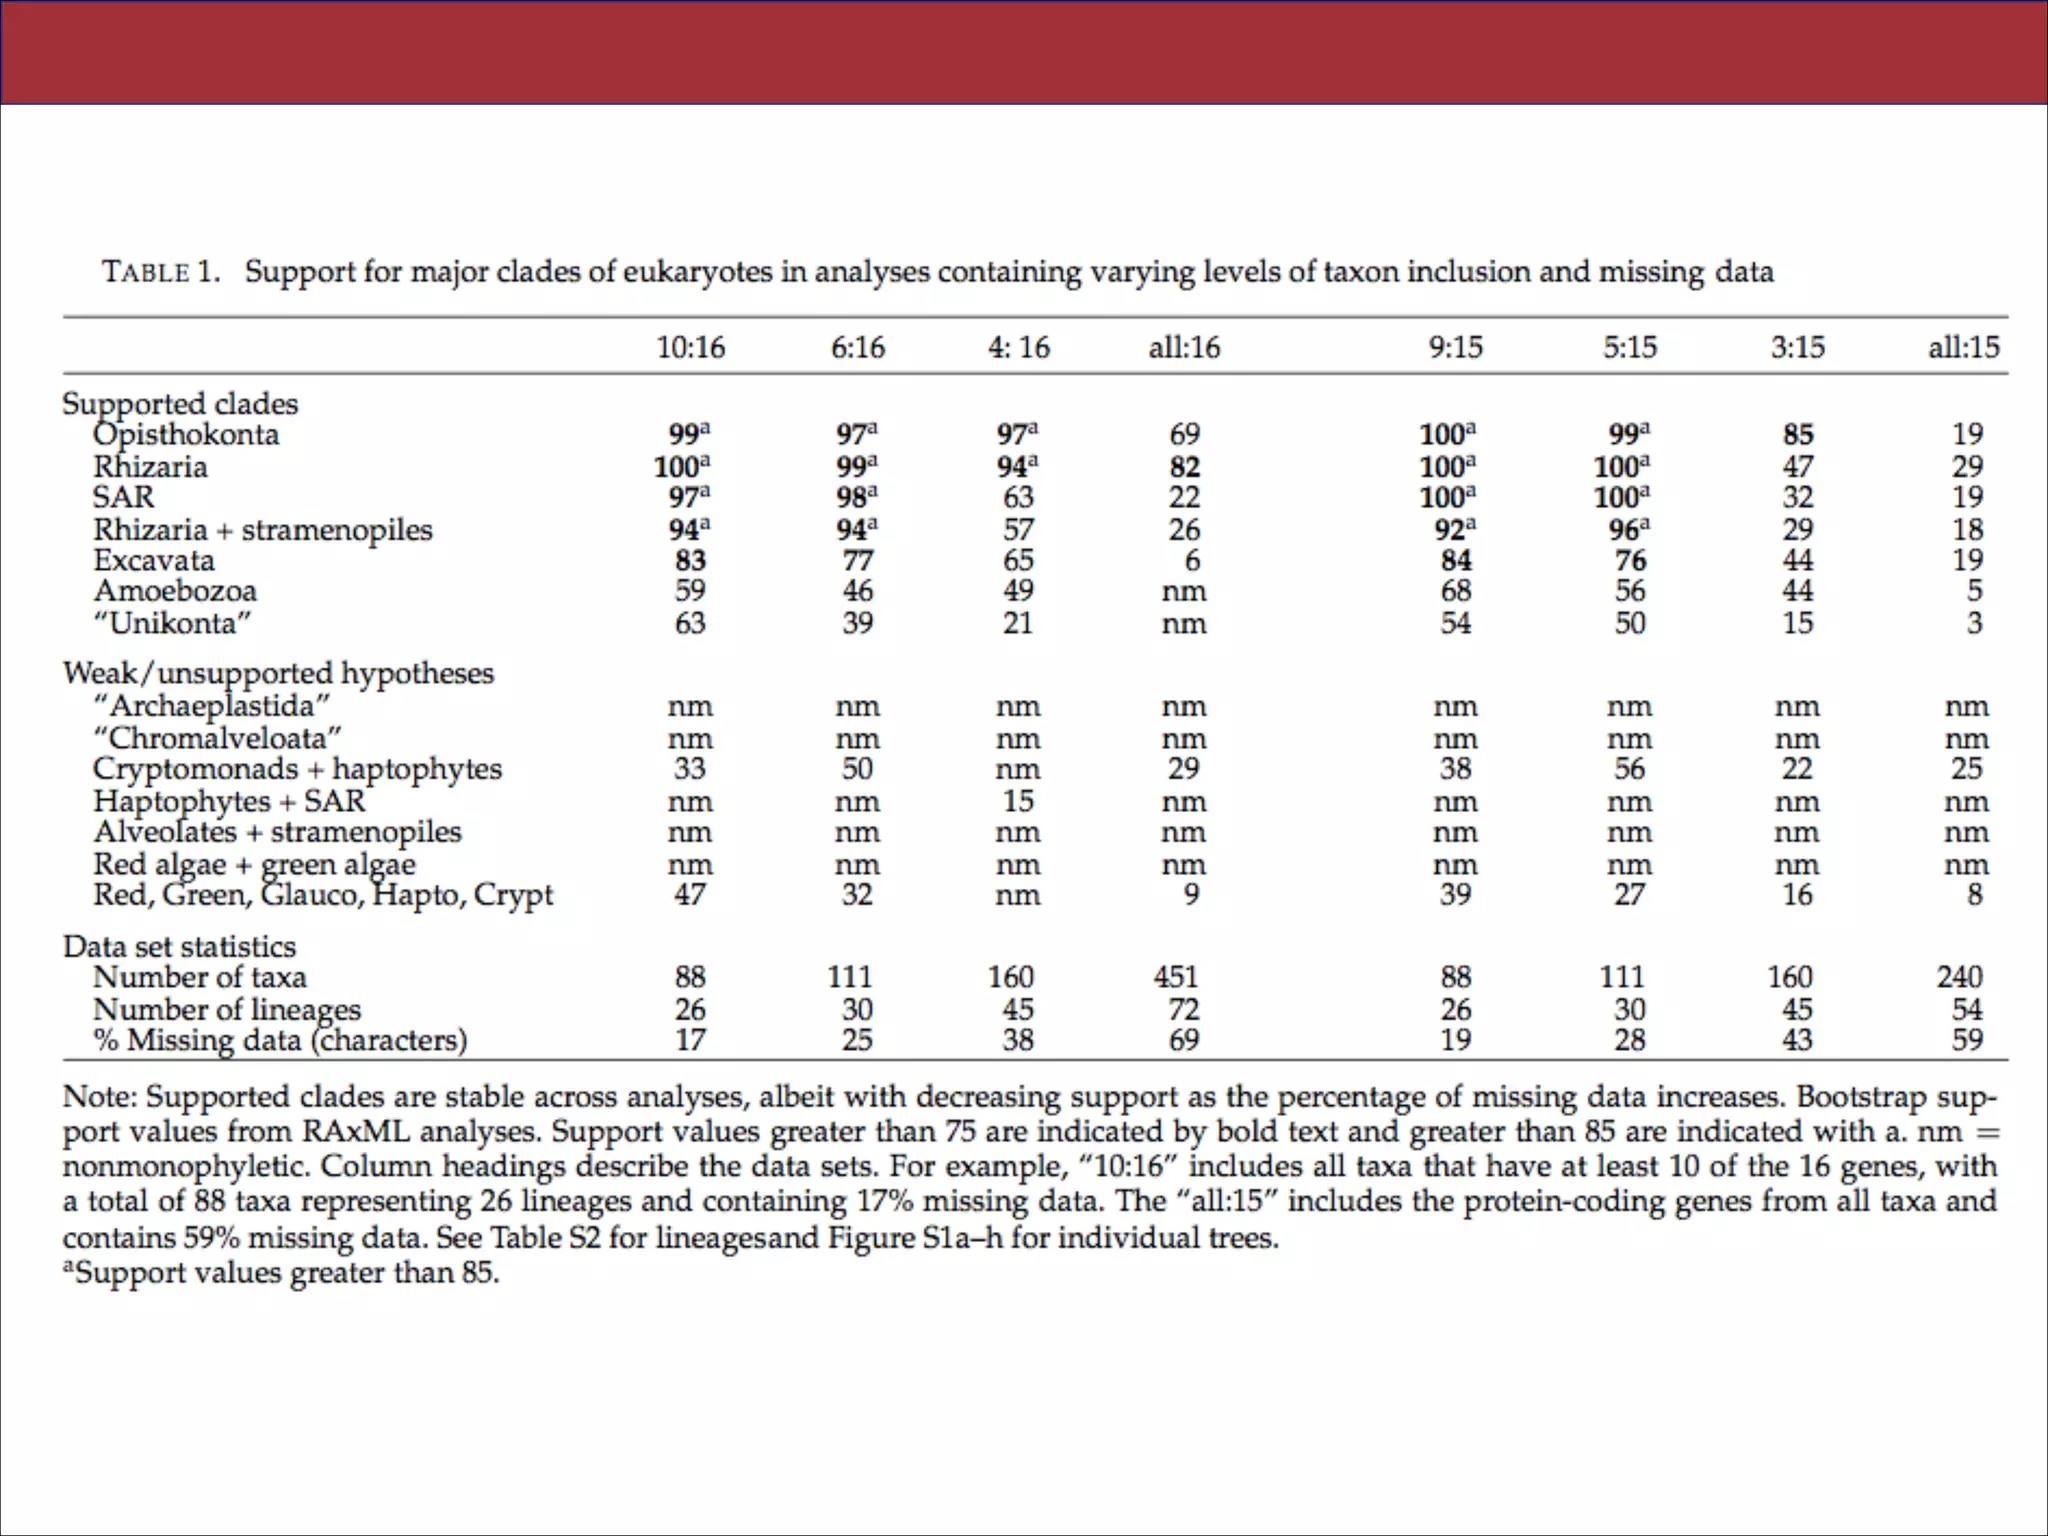
reduce power to evaluate hypotheses. Here, we use a taxon-rich strategy to assess eukaryotic
relationships. We show that analyses emphasizing broad taxonomic sampling (up to 451 taxa
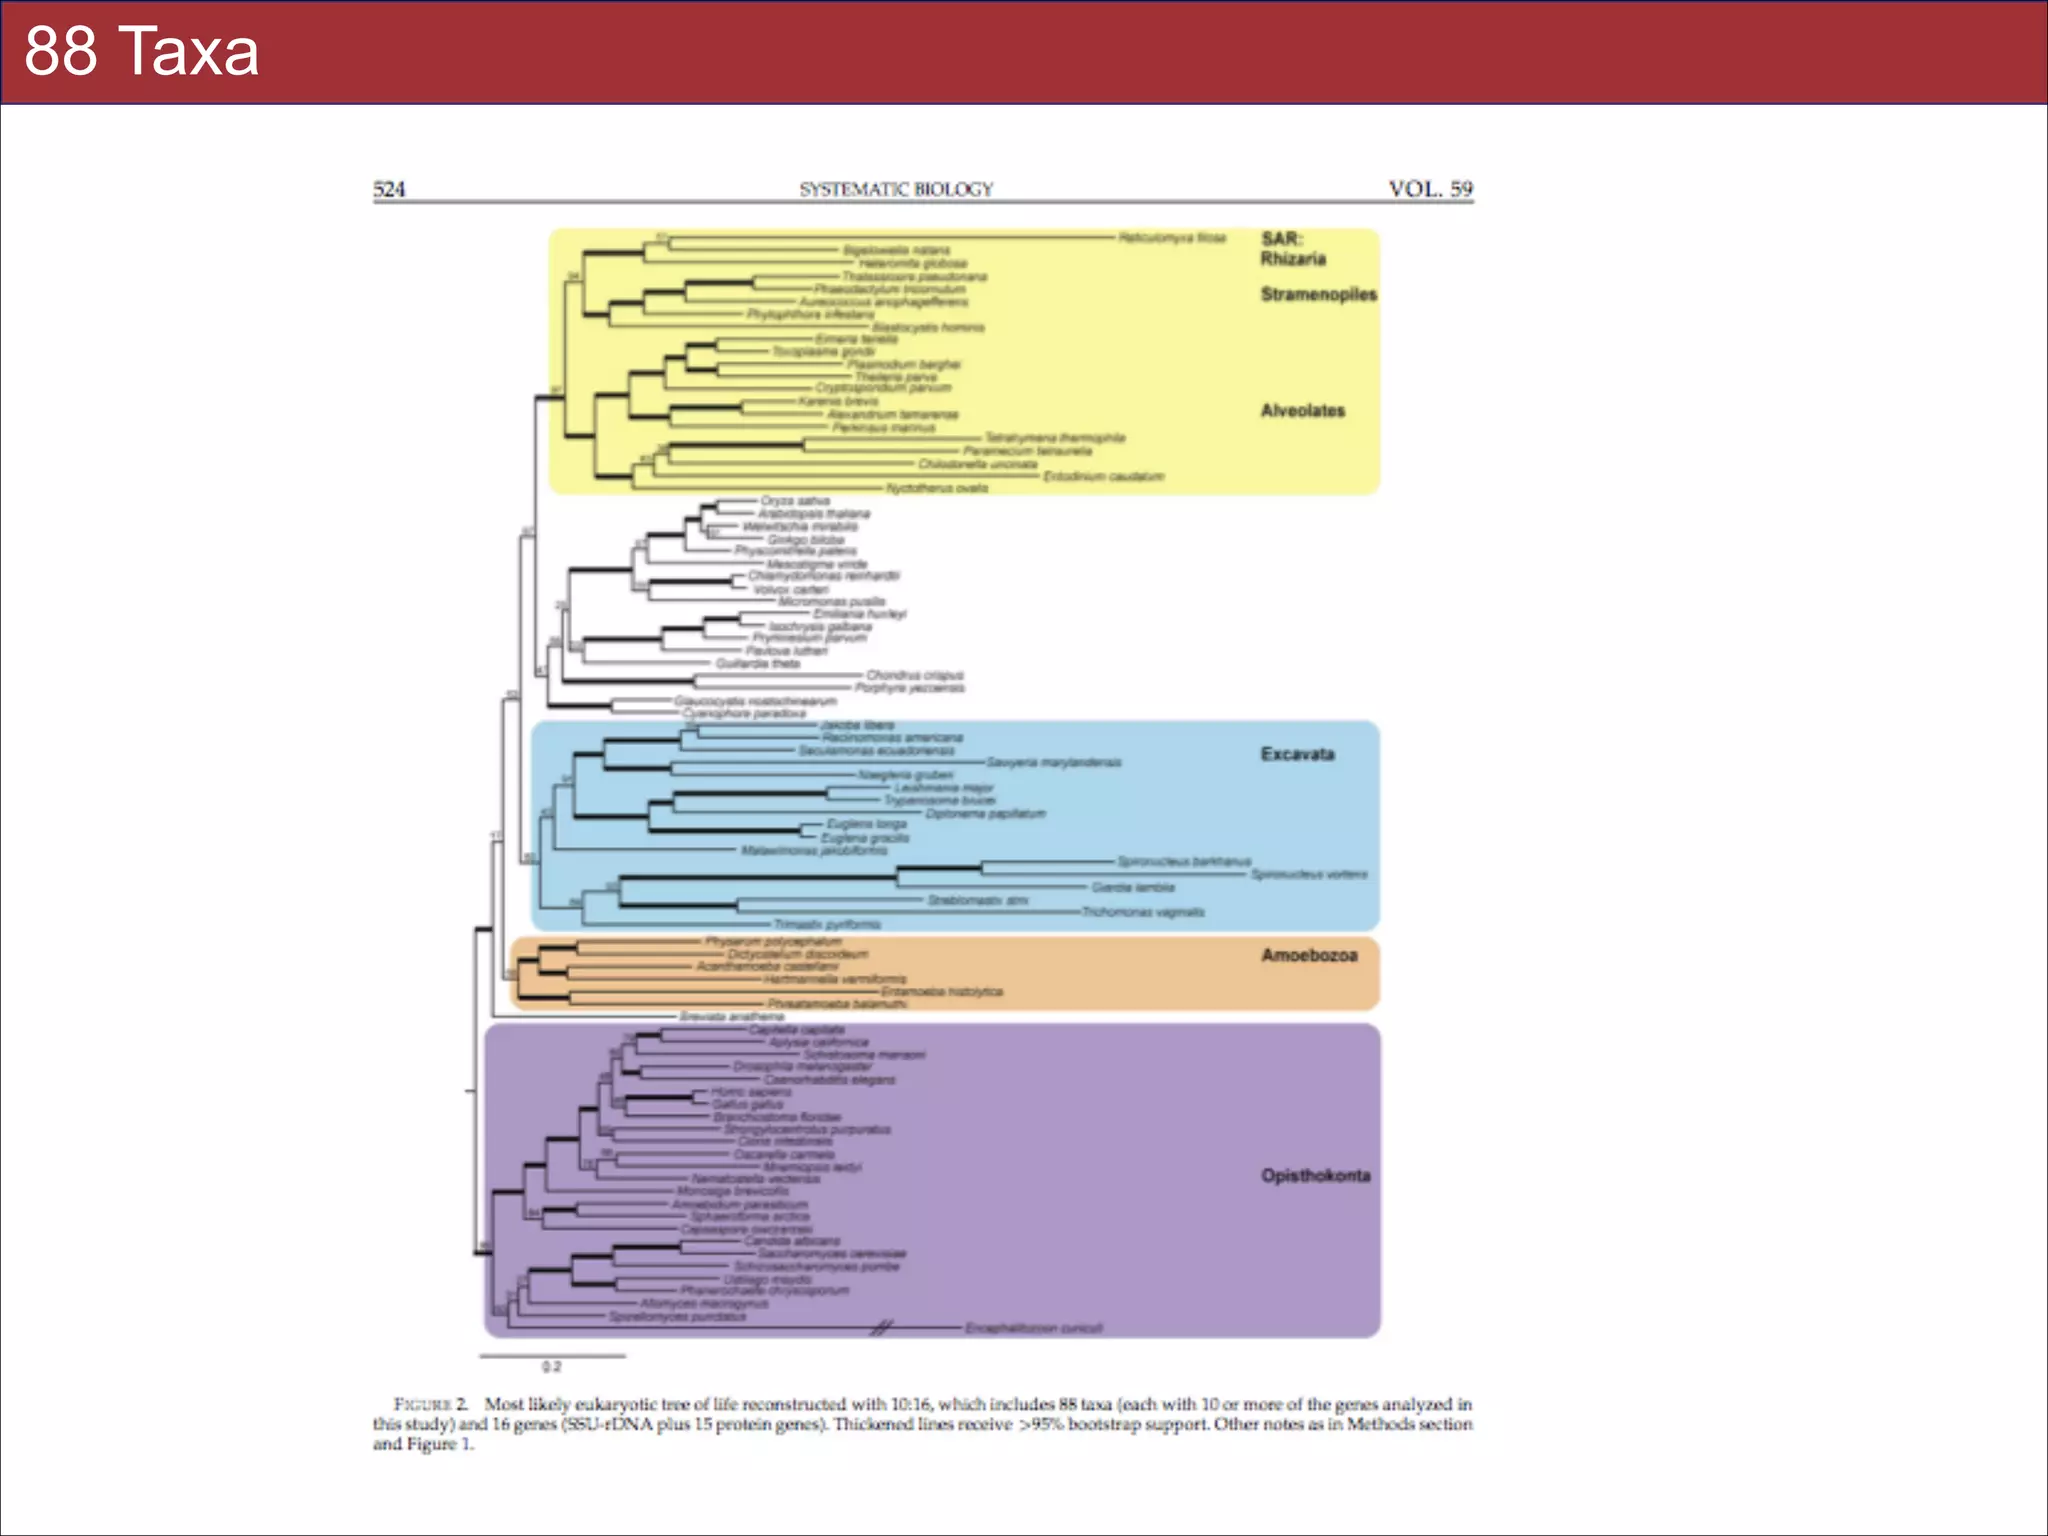
representing 72 major lineages) combined with a moderate number of genes yield a wellresolved eukaryotic tree of life. The consistency across analyses with varying numbers of taxa
(88–451) and levels of missing data (17–69%) supports the accuracy of the resulting topologies.
The resulting stable topology emerges without the removal of rapidly evolving genes or taxa, a
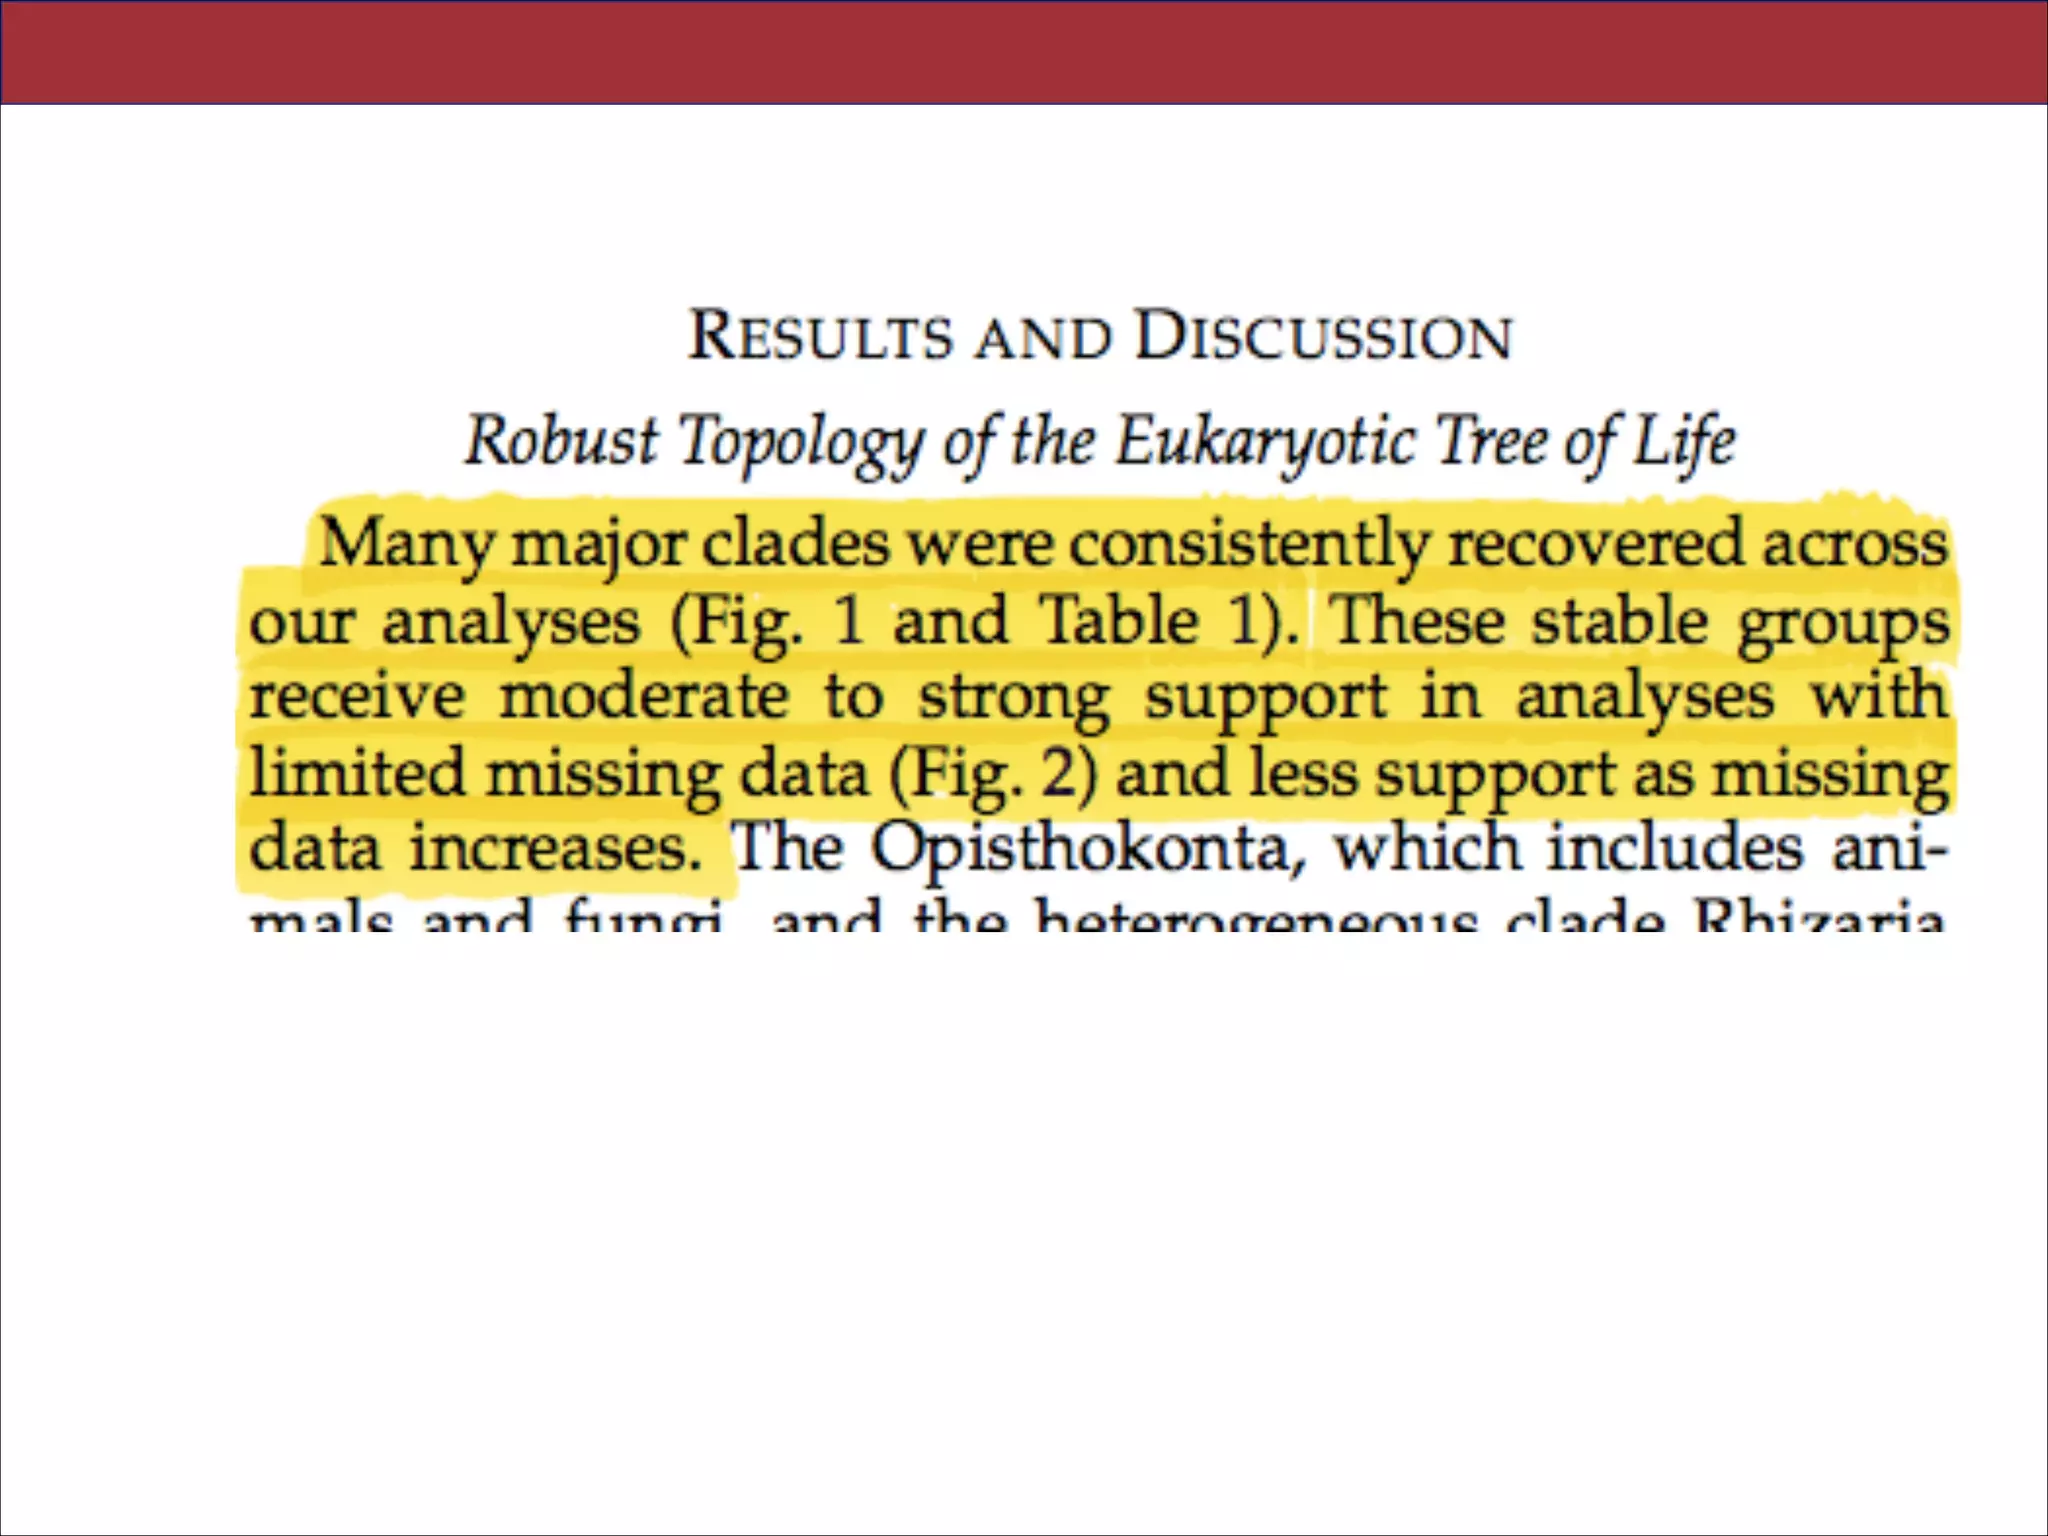
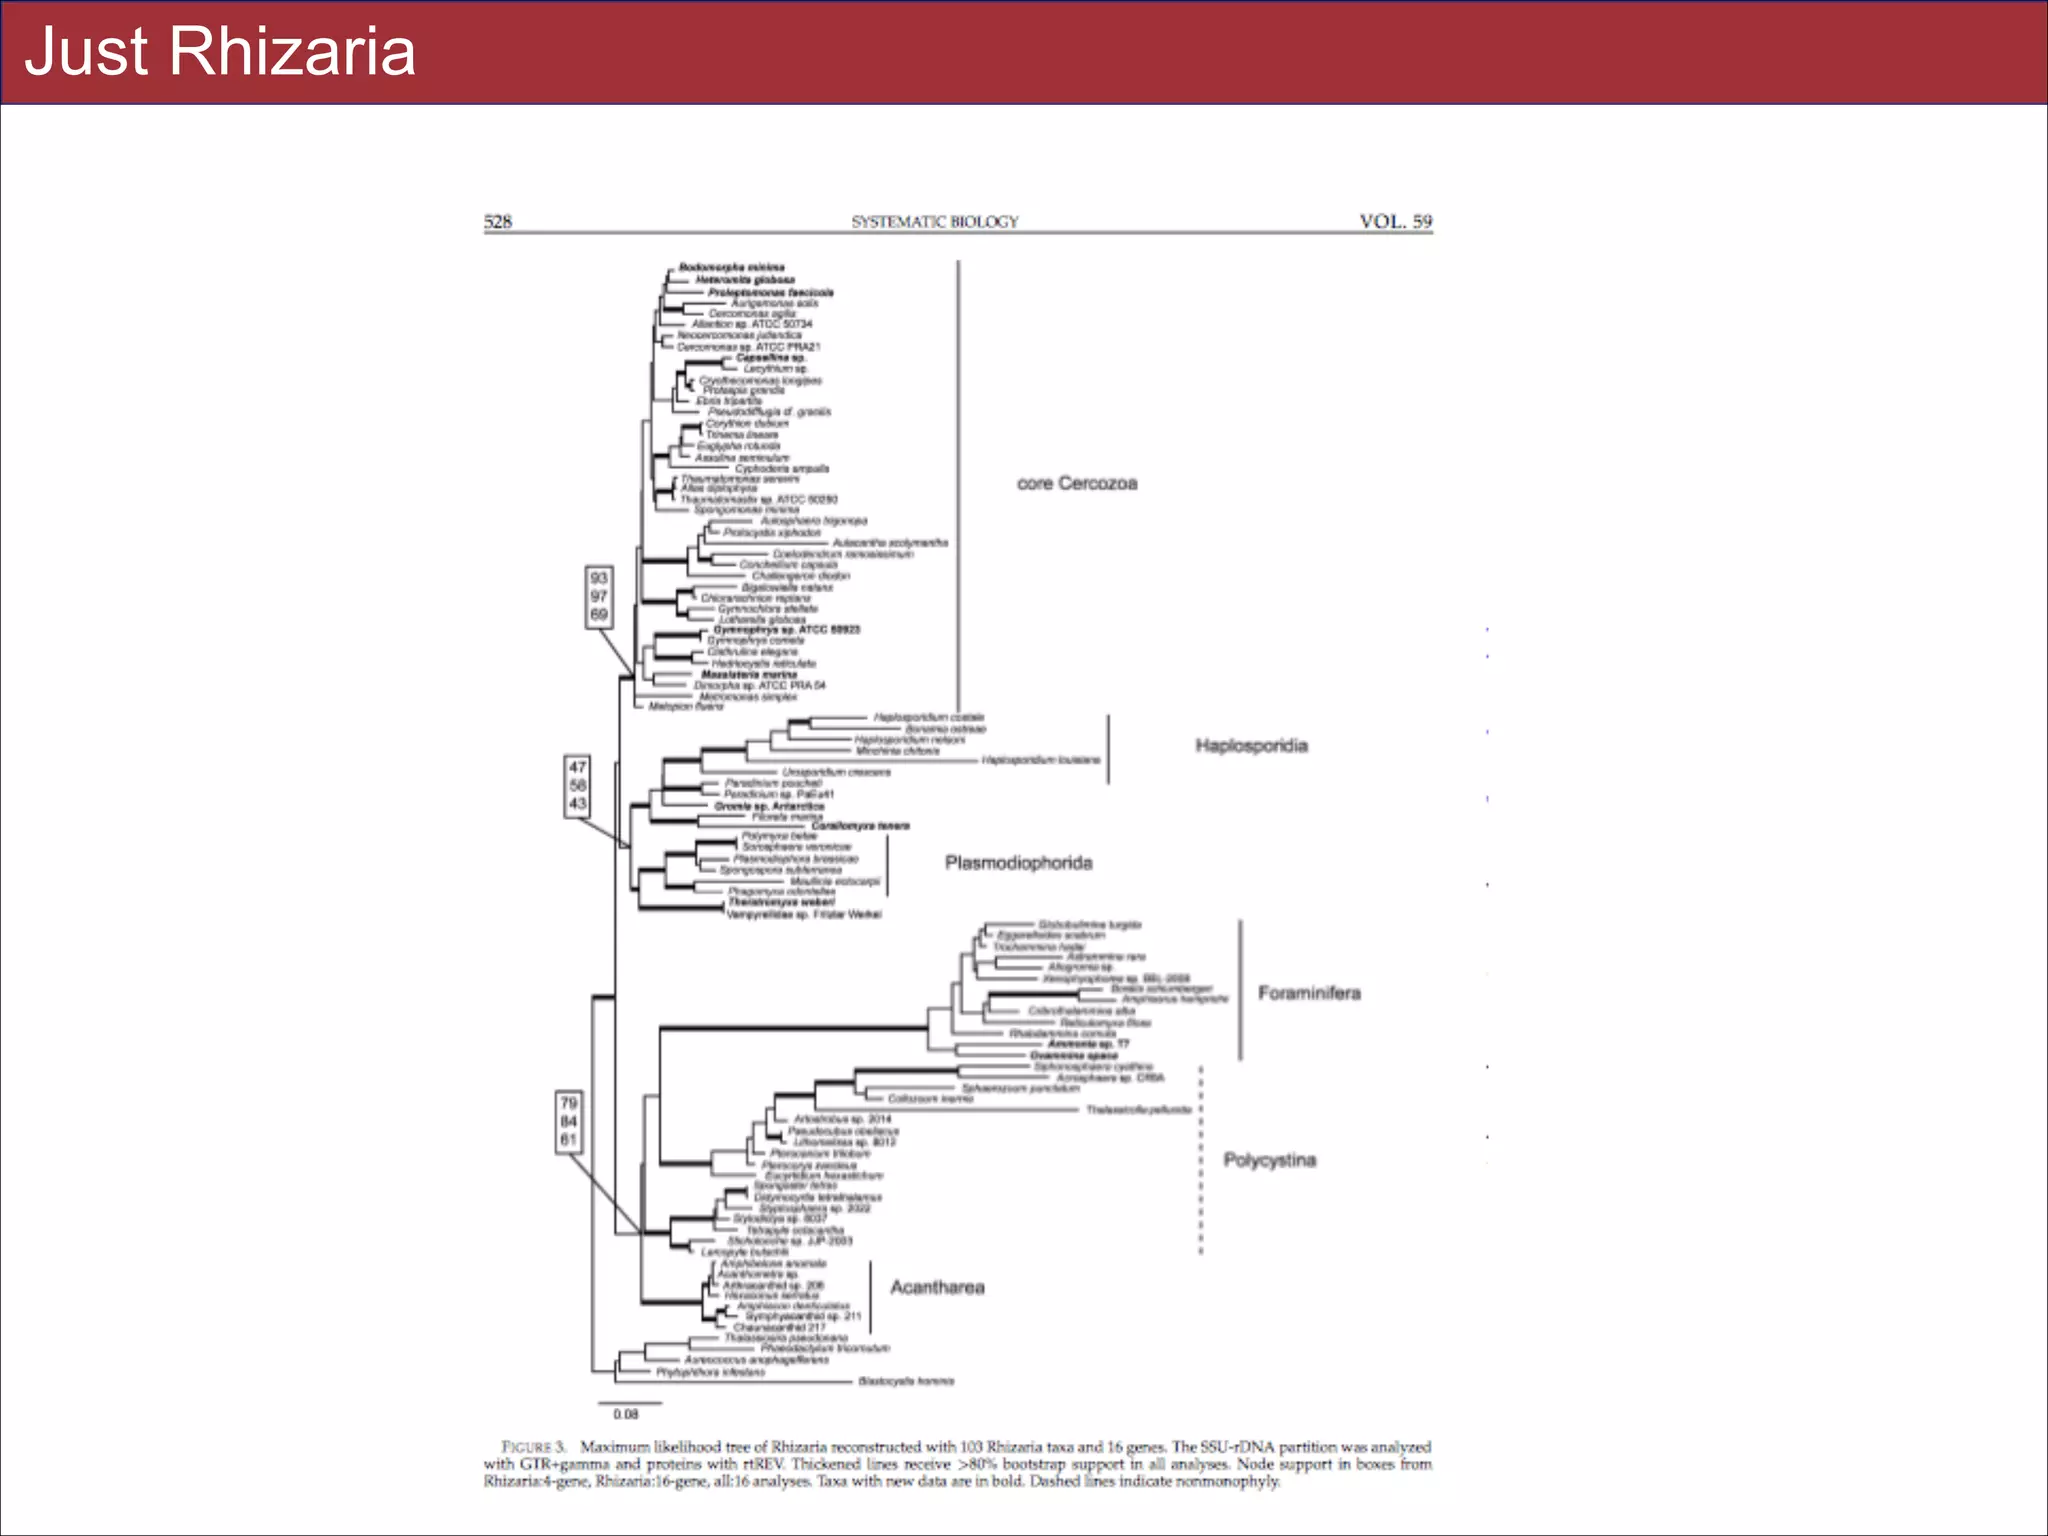
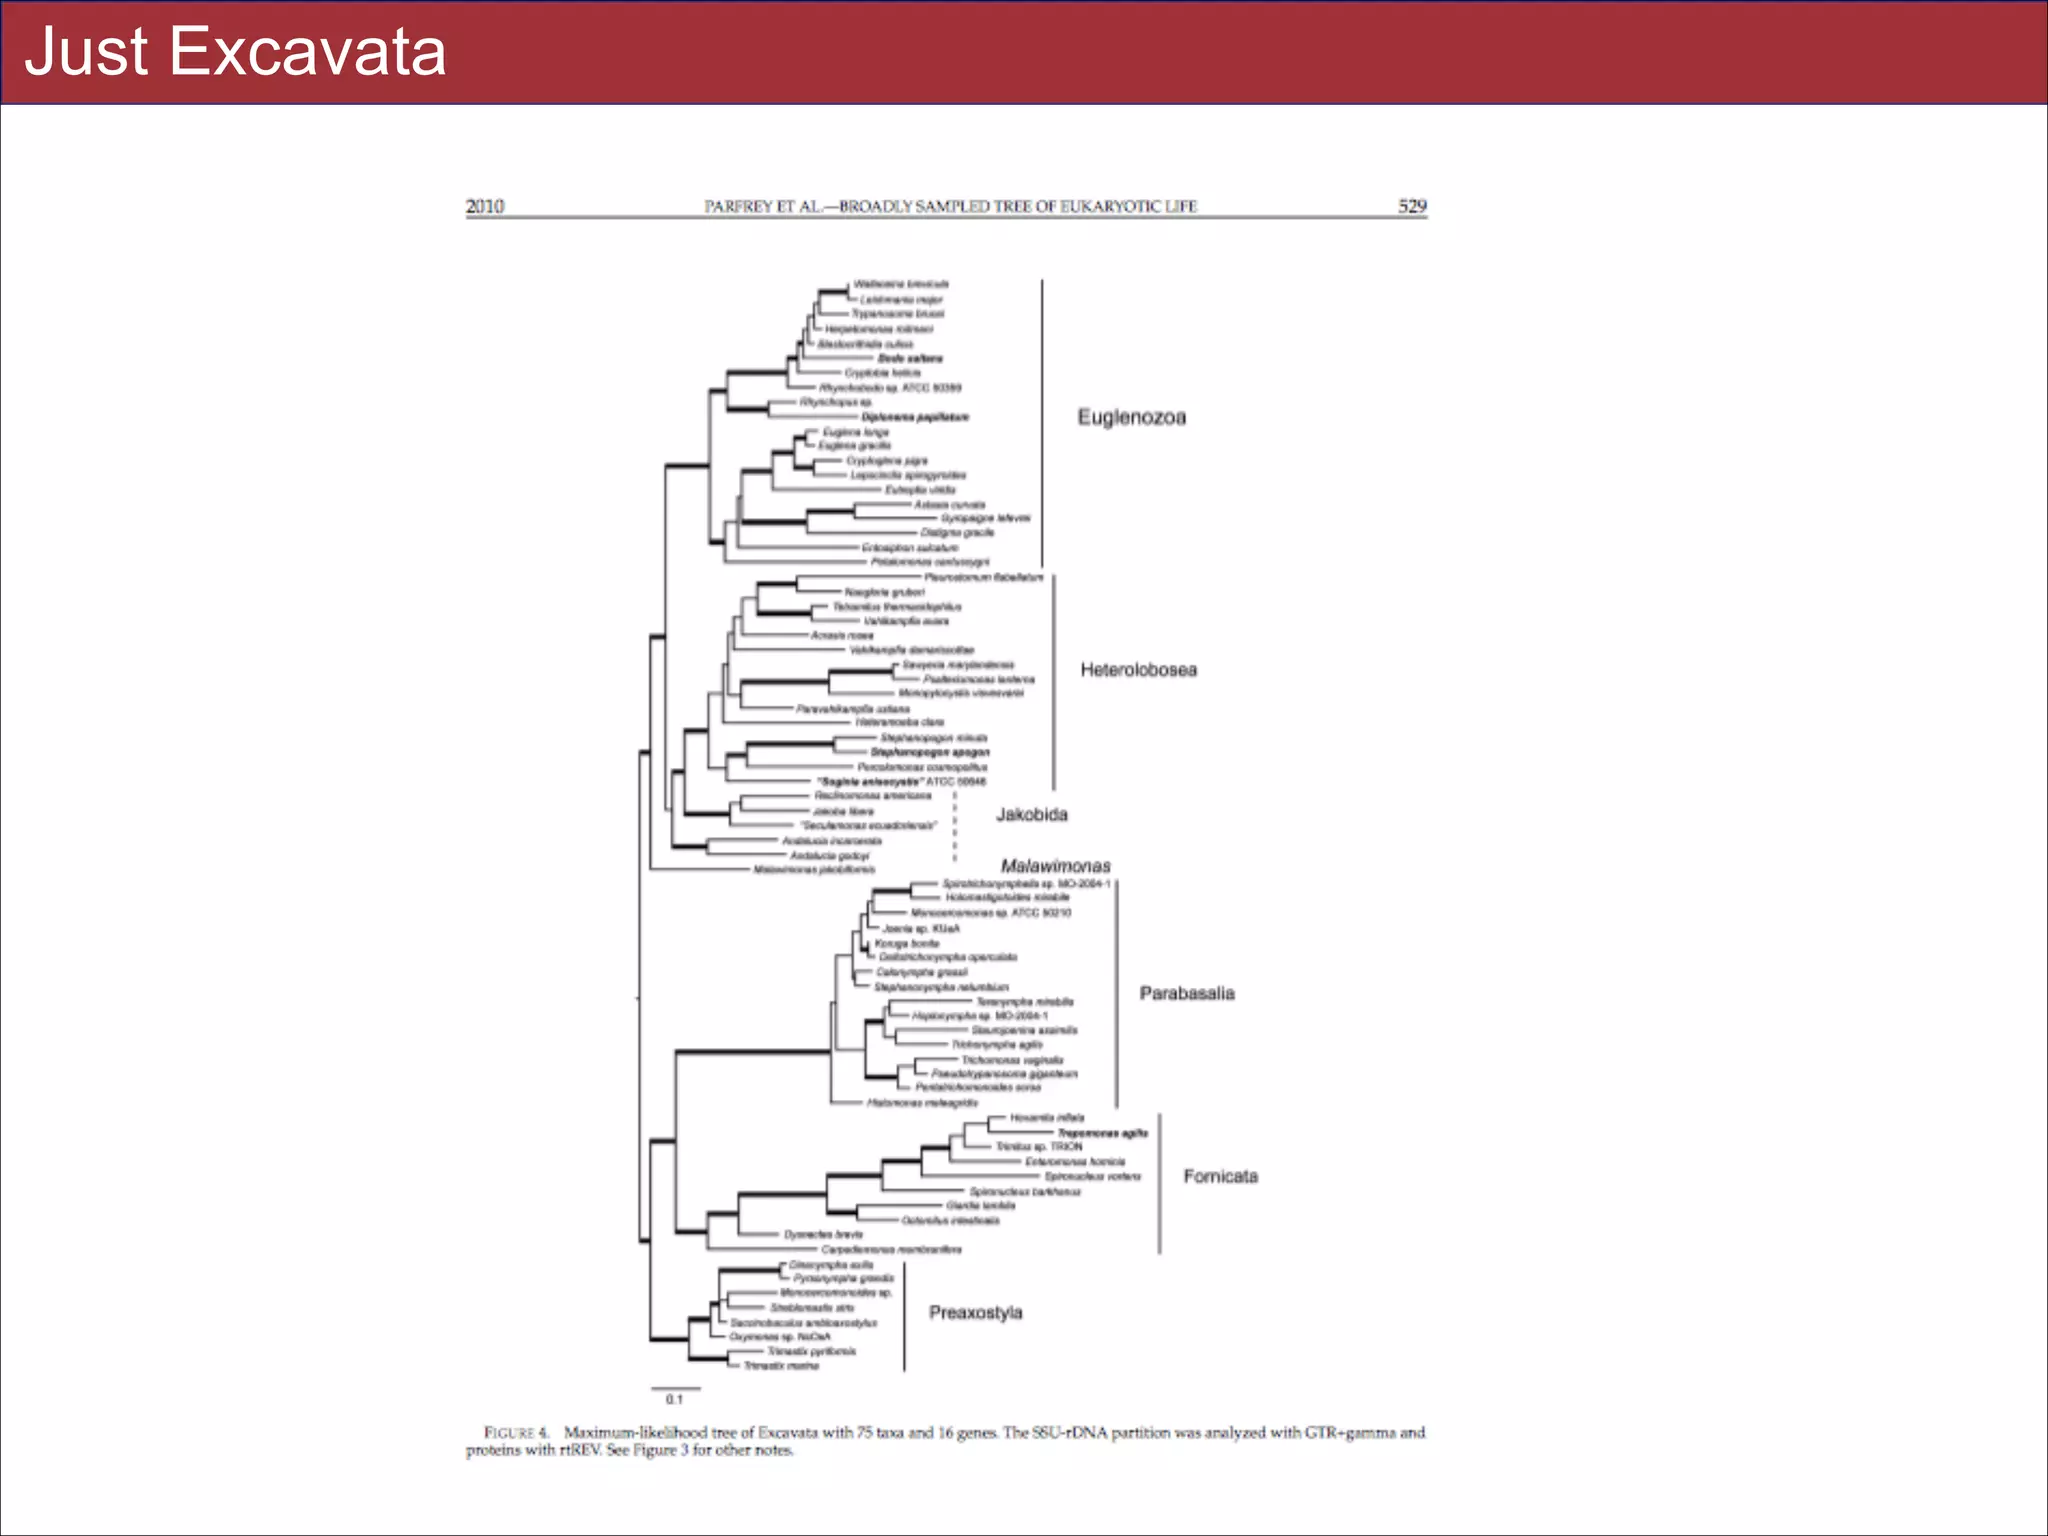
practice common to phylogenomic analyses. Several major groups are stable and strongly
supported in these analyses (e.g., SAR, Rhizaria, Excavata), whereas the proposed supergroup
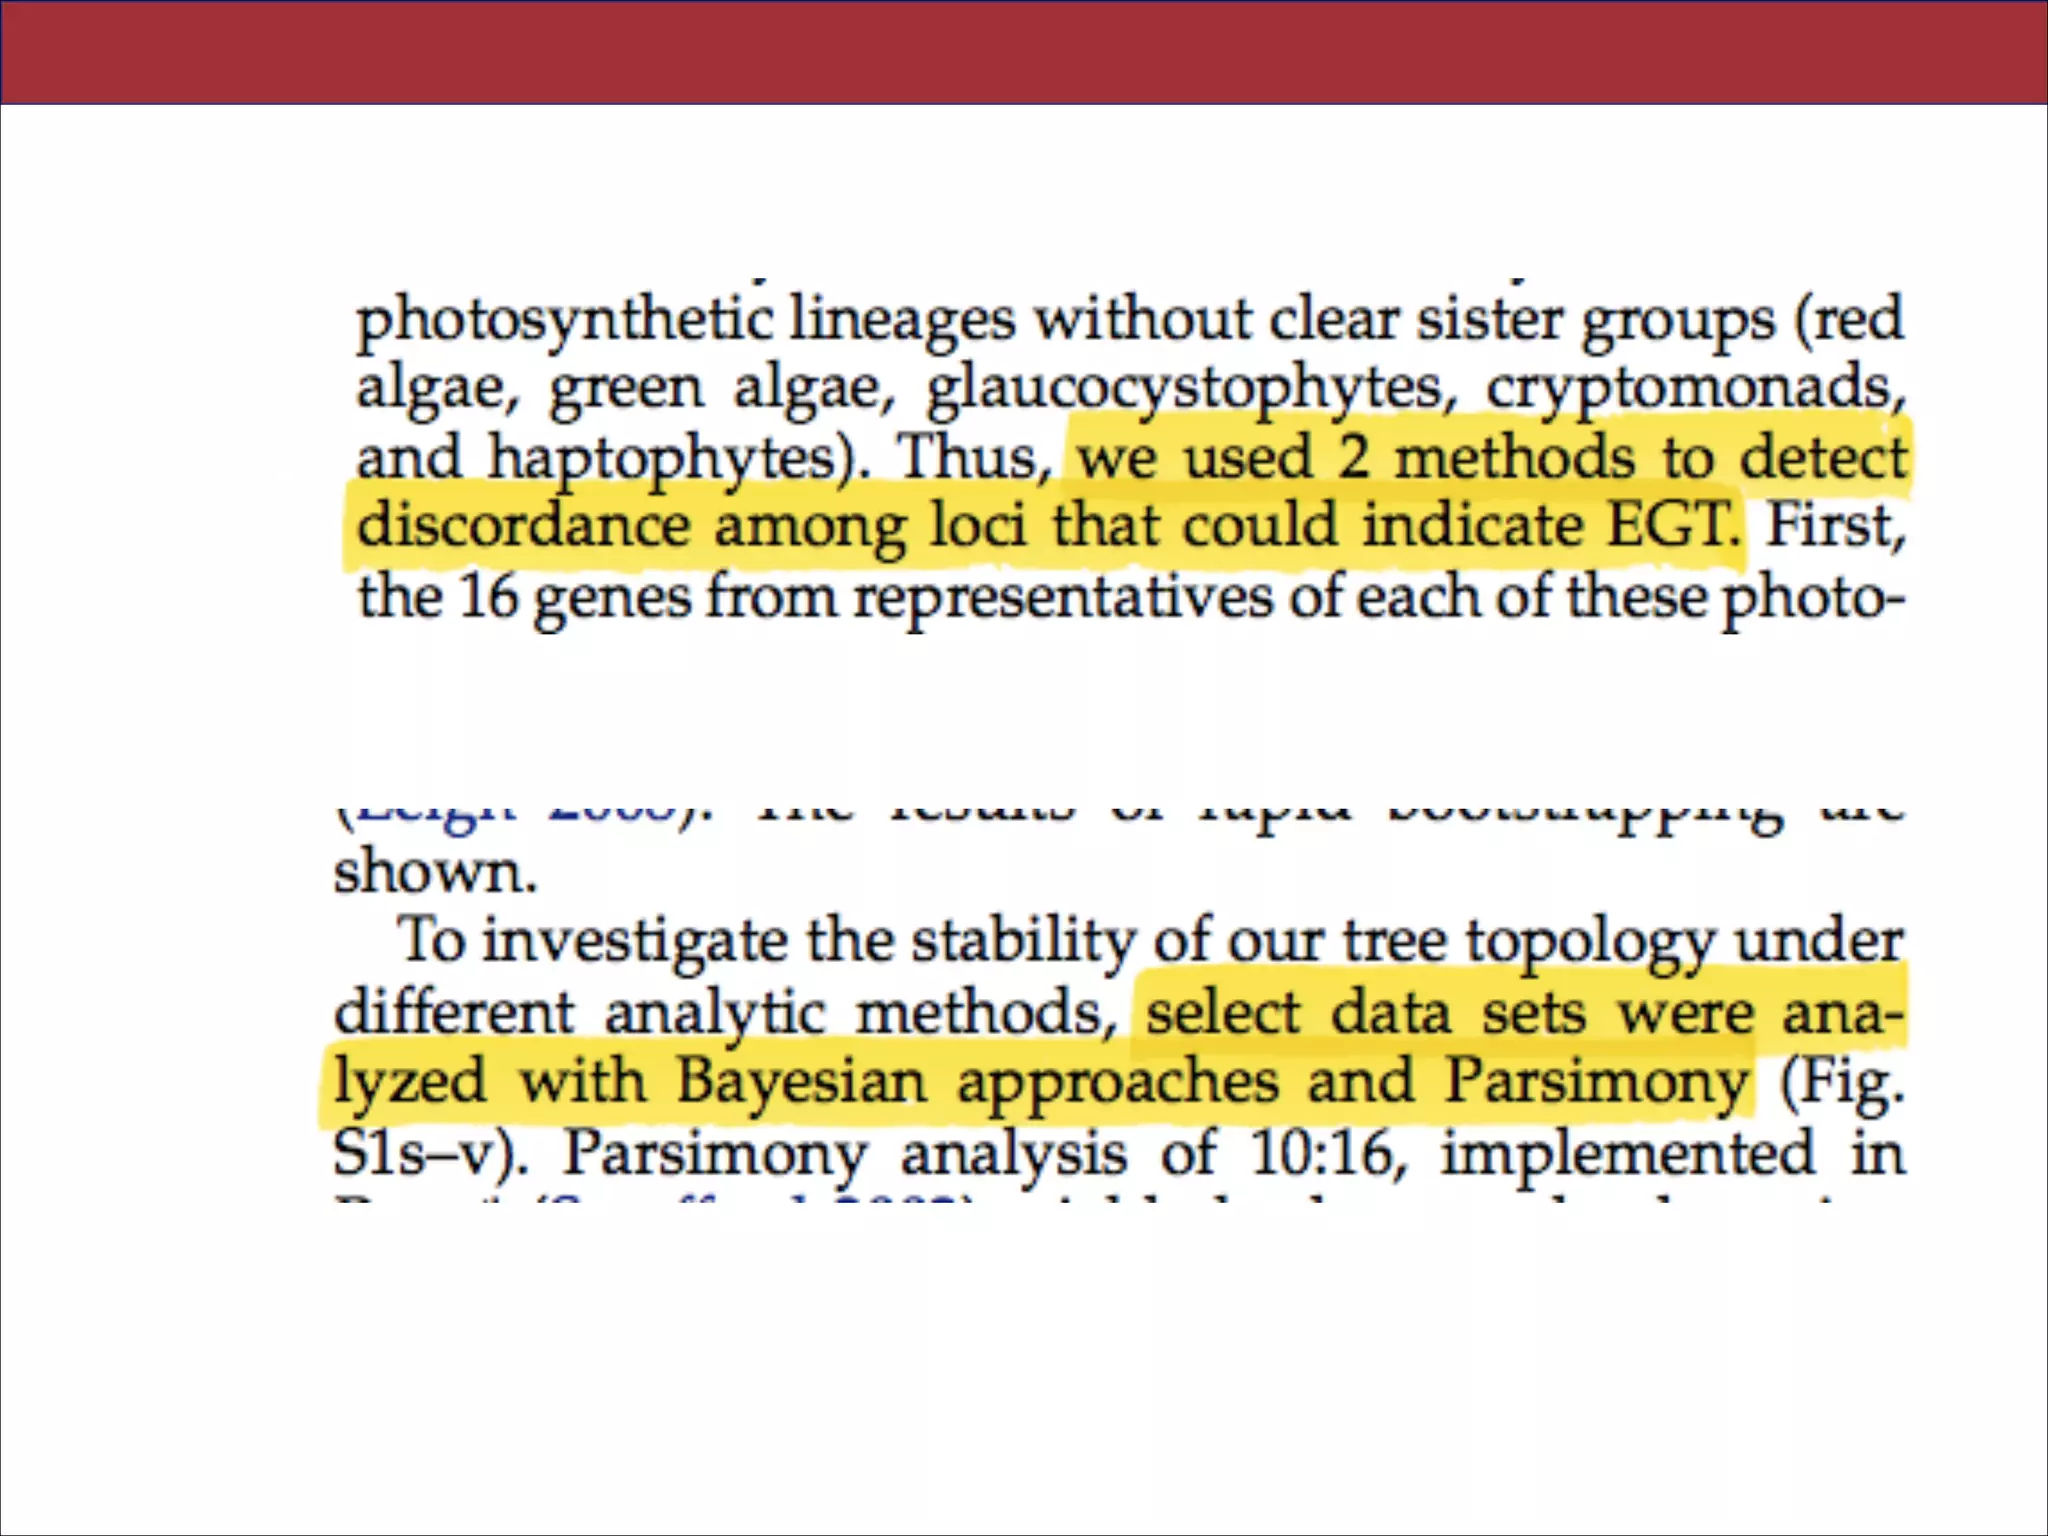
“Chromalveolata” is rejected. Furthermore, ex- tensive instability among photosynthetic lineages
suggests the presence of systematic biases including endosymbiotic gene transfer from
symbiont (nucleus or plastid) to host. Our analyses demonstrate that stable topologies of
ancient evolutionary relationships can be achieved with broad taxonomic sampling and a
moderate number of genes. Finally, taxon-rich analy- ses such as presented here provide a
method for testing the accuracy of relationships that receive high bootstrap support (BS) in
phylogenomic analyses and enable placement of the multitude of lineages that lack genome
scale data. [Excavata; microbial eukaryotes; Rhizaria; supergroups; systematic error; taxon
sampling.]
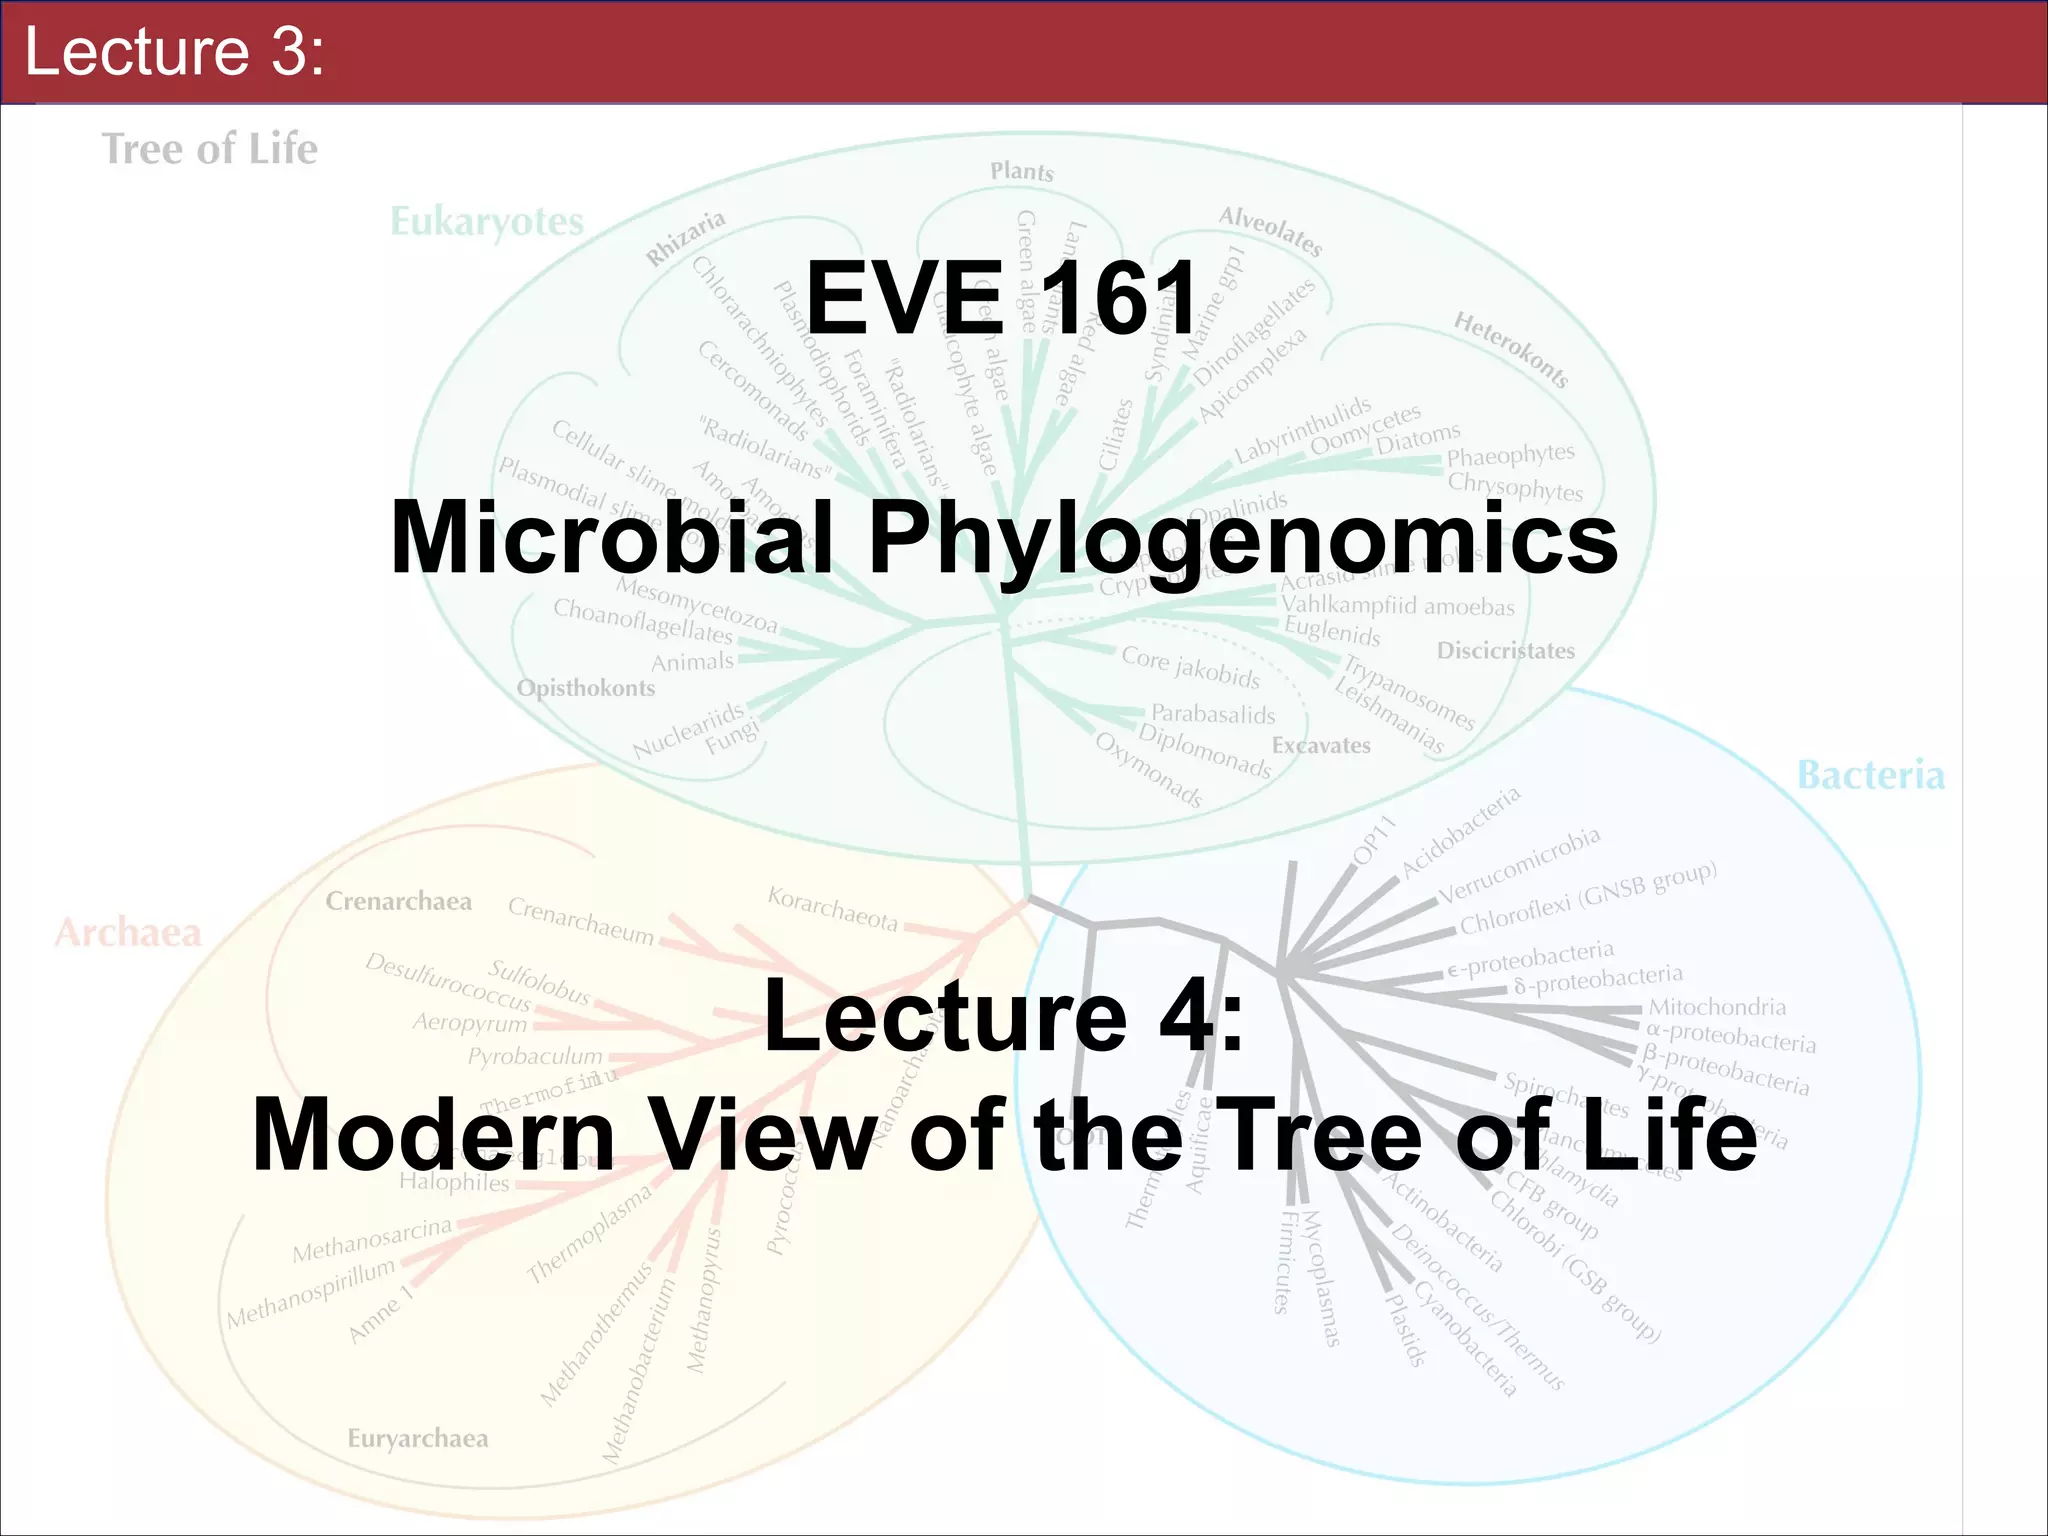
Slides for UC Davis EVE161 Course Taught by Jonathan Eisen Winter 2014
!21](https://image.slidesharecdn.com/eve161-140123144708-phpapp01/75/EVE-161-Lecture-4-21-2048.jpg)
![Tree Congruence
Downloaded from rspb.royalsocietypublishing.org on January 16, 2014
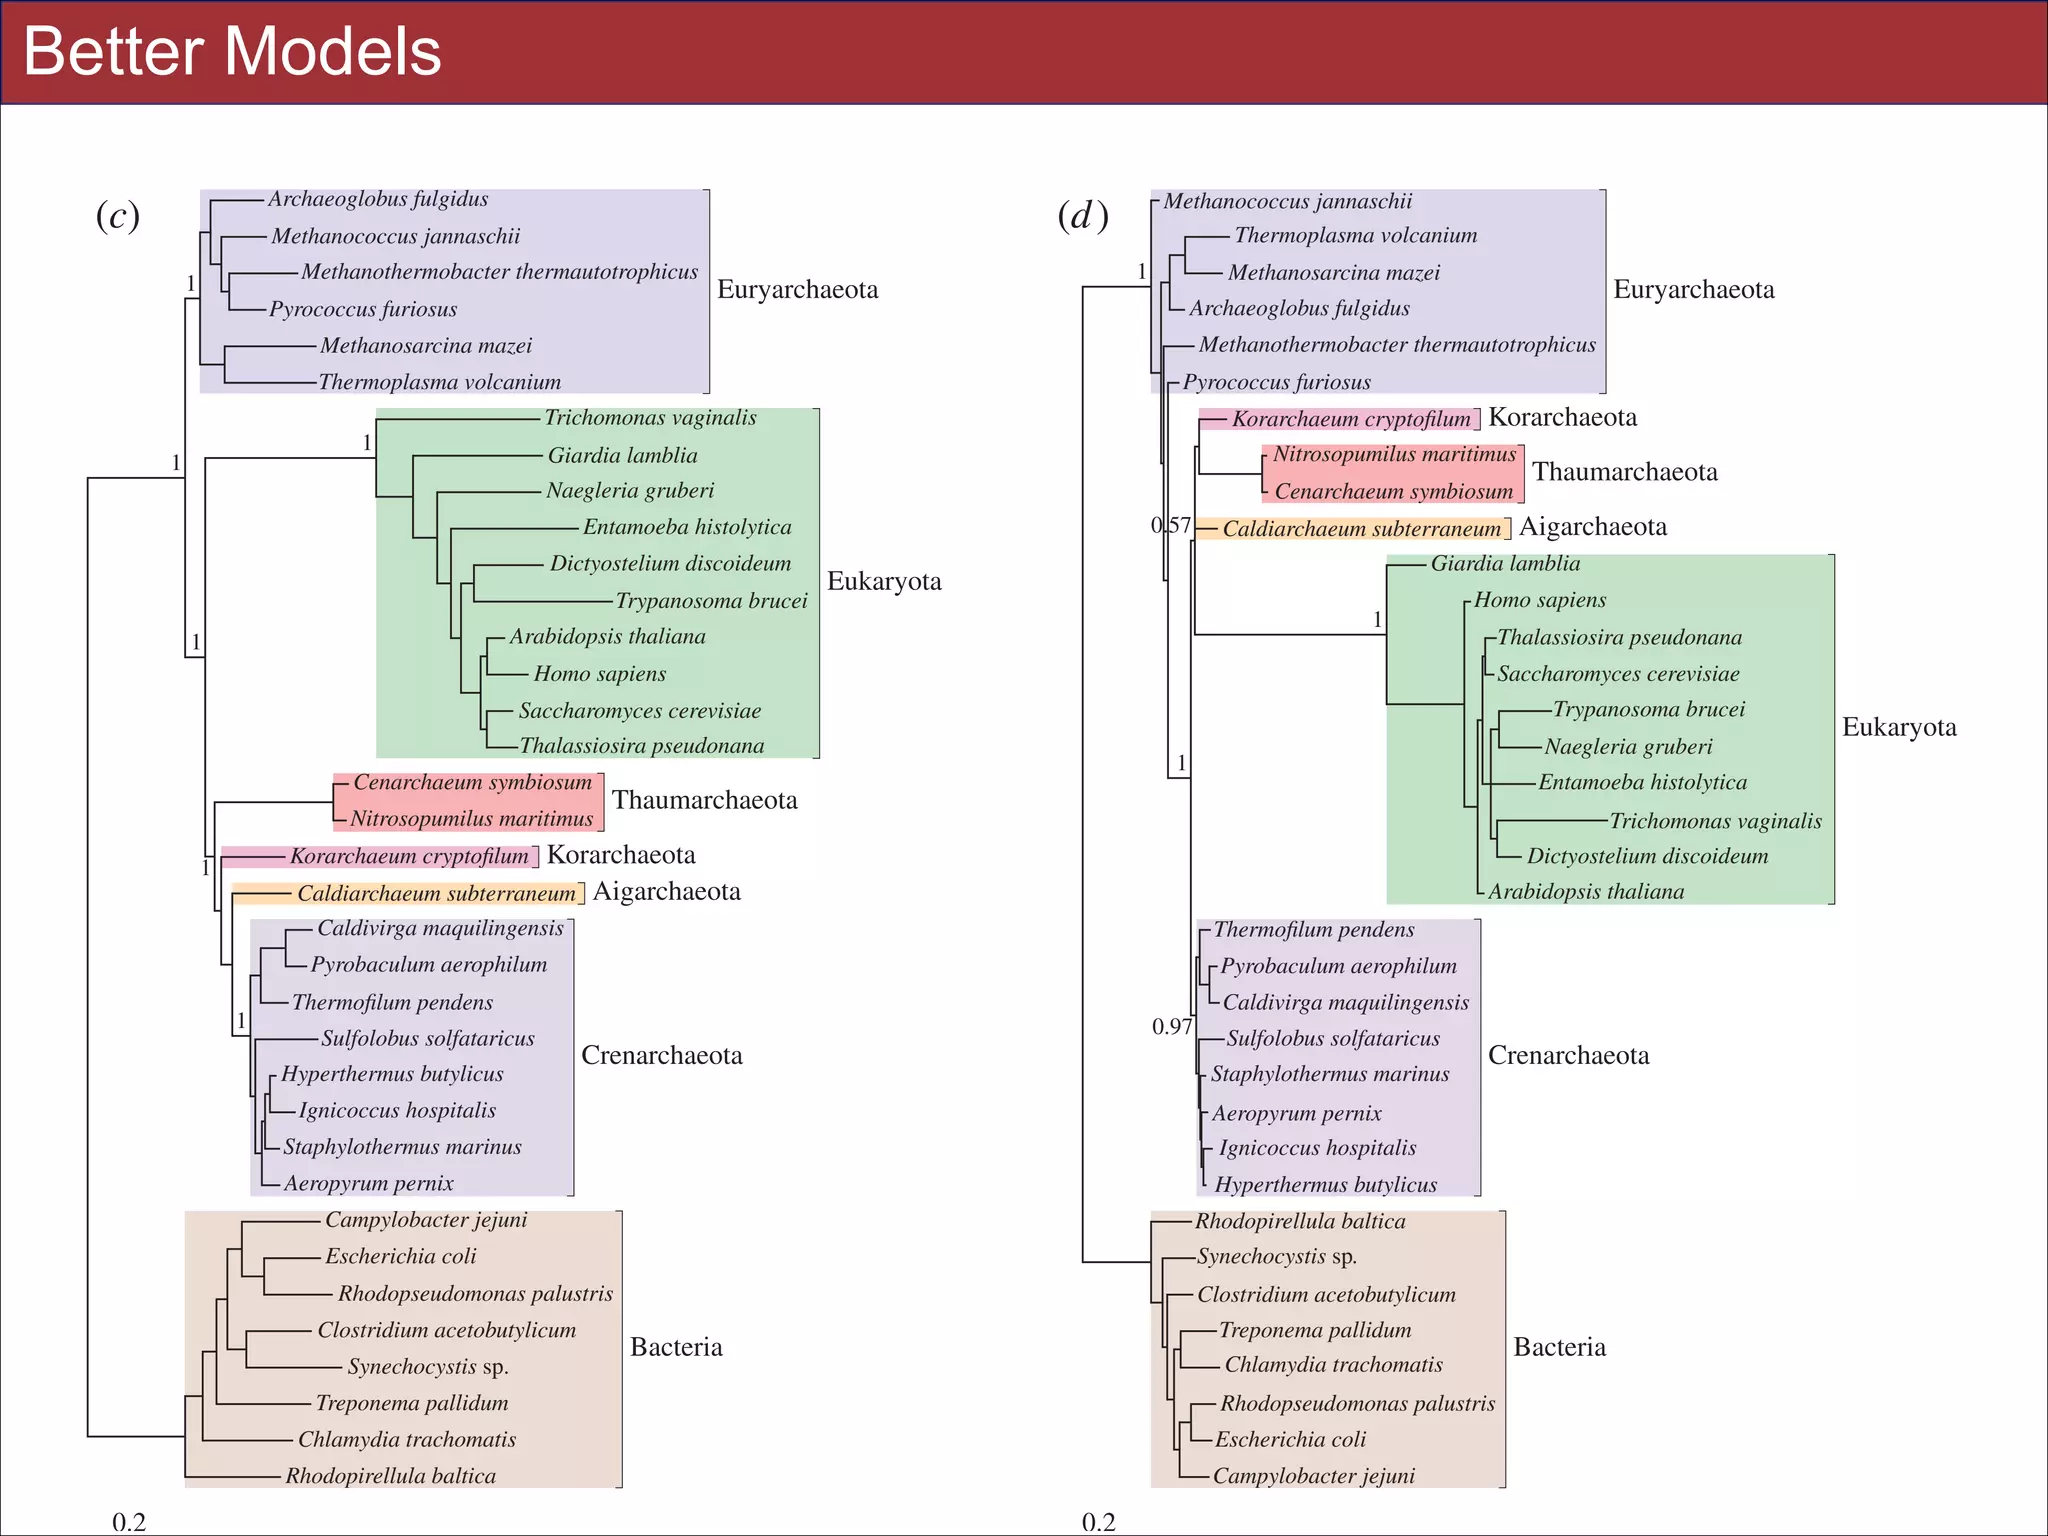
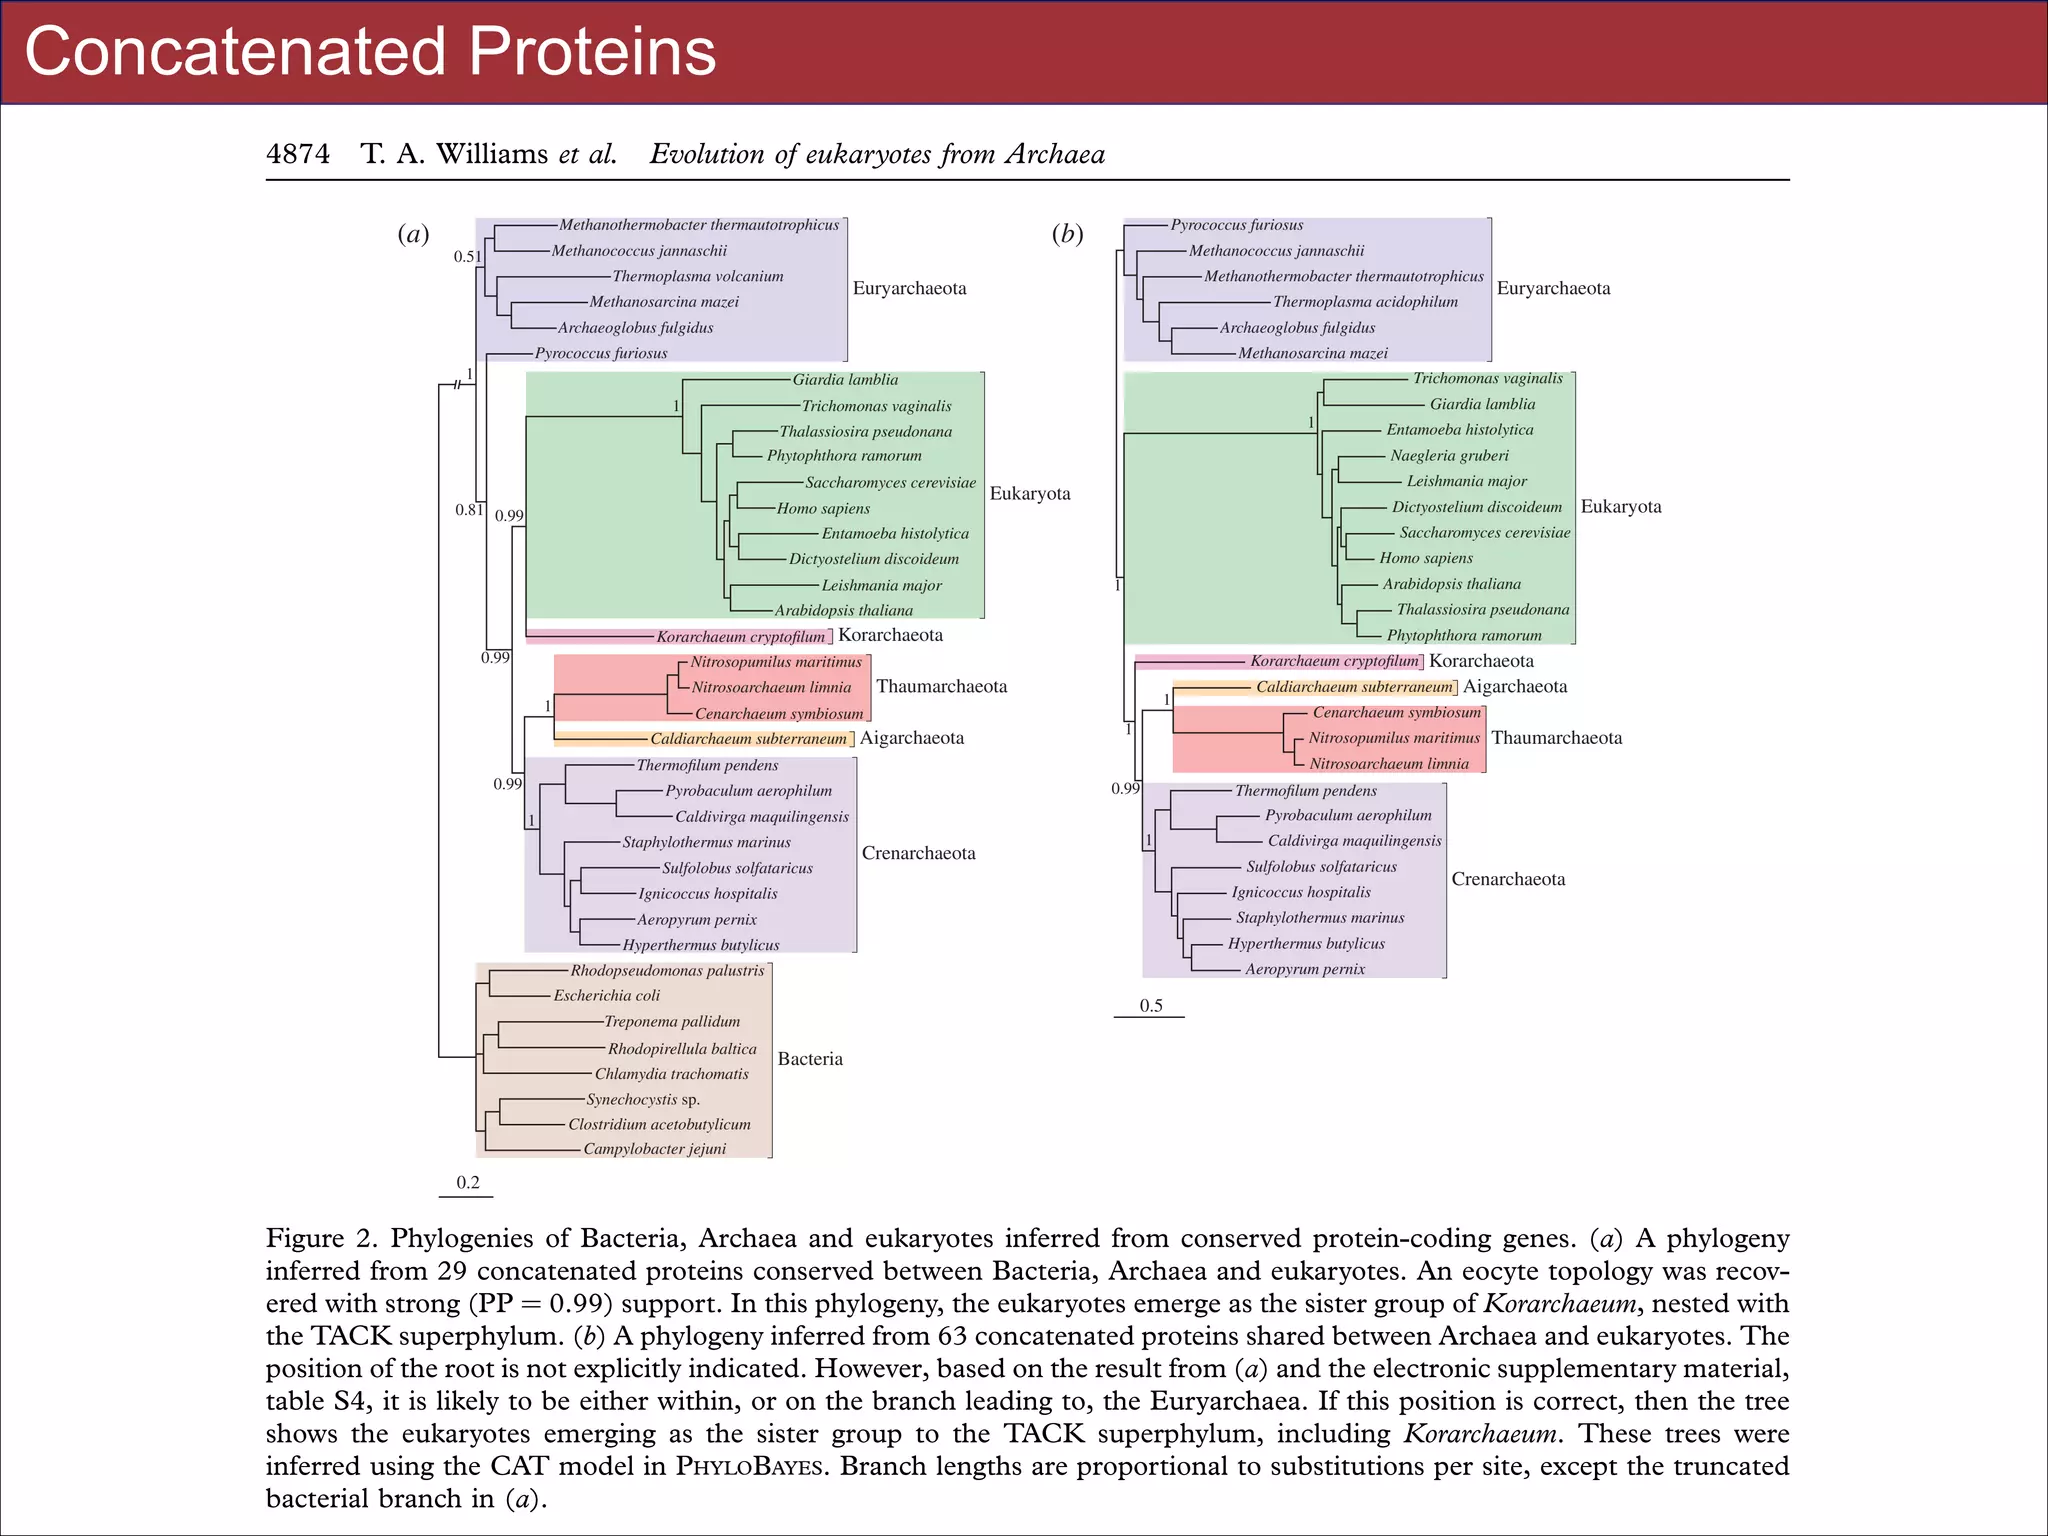
4876
T. A. Williams et al.
Evolution of eukaryotes from Archaea
(b)
(a)
no. tests passed (P > 0.05)
250
frequency
model
CAT20
LG
60
300
200
150
100
50
40
30
20
10
50
0
0
1
2
3
distance
4
saturation and
site-specific
compositional
homoplasy biochemical diversity heterogeneity
5
(c)
model
CAT20
LG
1.2
1.0
density
0.8
0.6
0.4
0.2
0
1.0
1.5
2.0
distance
2.5
3.0
Figure 3. Analysing incongruence using a novel measure of distance between gene trees. We used distributions of pairwise geodesic distances between gene trees to compare levels of incongruence inferred under different evolutionary models. (a) The
distribution of distances under a single model (CAT20) can be used to identify obvious outliers corresponding to highly incongruent gene trees; a single gene was responsible for the peak highlighted in red, and was removed from subsequent analyses.
(b) Overview of model-fitting tests (posterior predictive simulations) for each gene in the 64AE dataset. The height of the bars
indicates the proportion of genes that ‘passed’ a test under a particular model; we said that a test was passed when the value of
the test statistic on the real data fell within the central 95% of the distribution of values produced by posterior predictive simulation. The results suggest that CAT20 fits better than LG, successfully accounting for the observed levels of saturation and
homoplasy in all but one of the alignments. Both models do a poor job of modelling the site-specific selective constraints in
our dataset, although again CAT20 performs better than LG (13 passes as opposed to 0). (c) Comparison of the distance distributions inferred under the CAT20 and LG models. The trees inferred under the better-fitting CAT20 model are significantly
more congruent than those inferred under LG (mean distance: 2.68 versus 3.22, p , 0.0001). The significance of this difference was assessed using a permutation test that took the correlations between pairwise distances into account (see §4). These
results suggest that a significant portion of the incongruence in this dataset of informational genes can be attributed to model
misspecification, rather than genuinely distinct evolutionary histories.
Slides for UC Davis EVE161 Course Taught by Jonathan Eisen Winter 2014
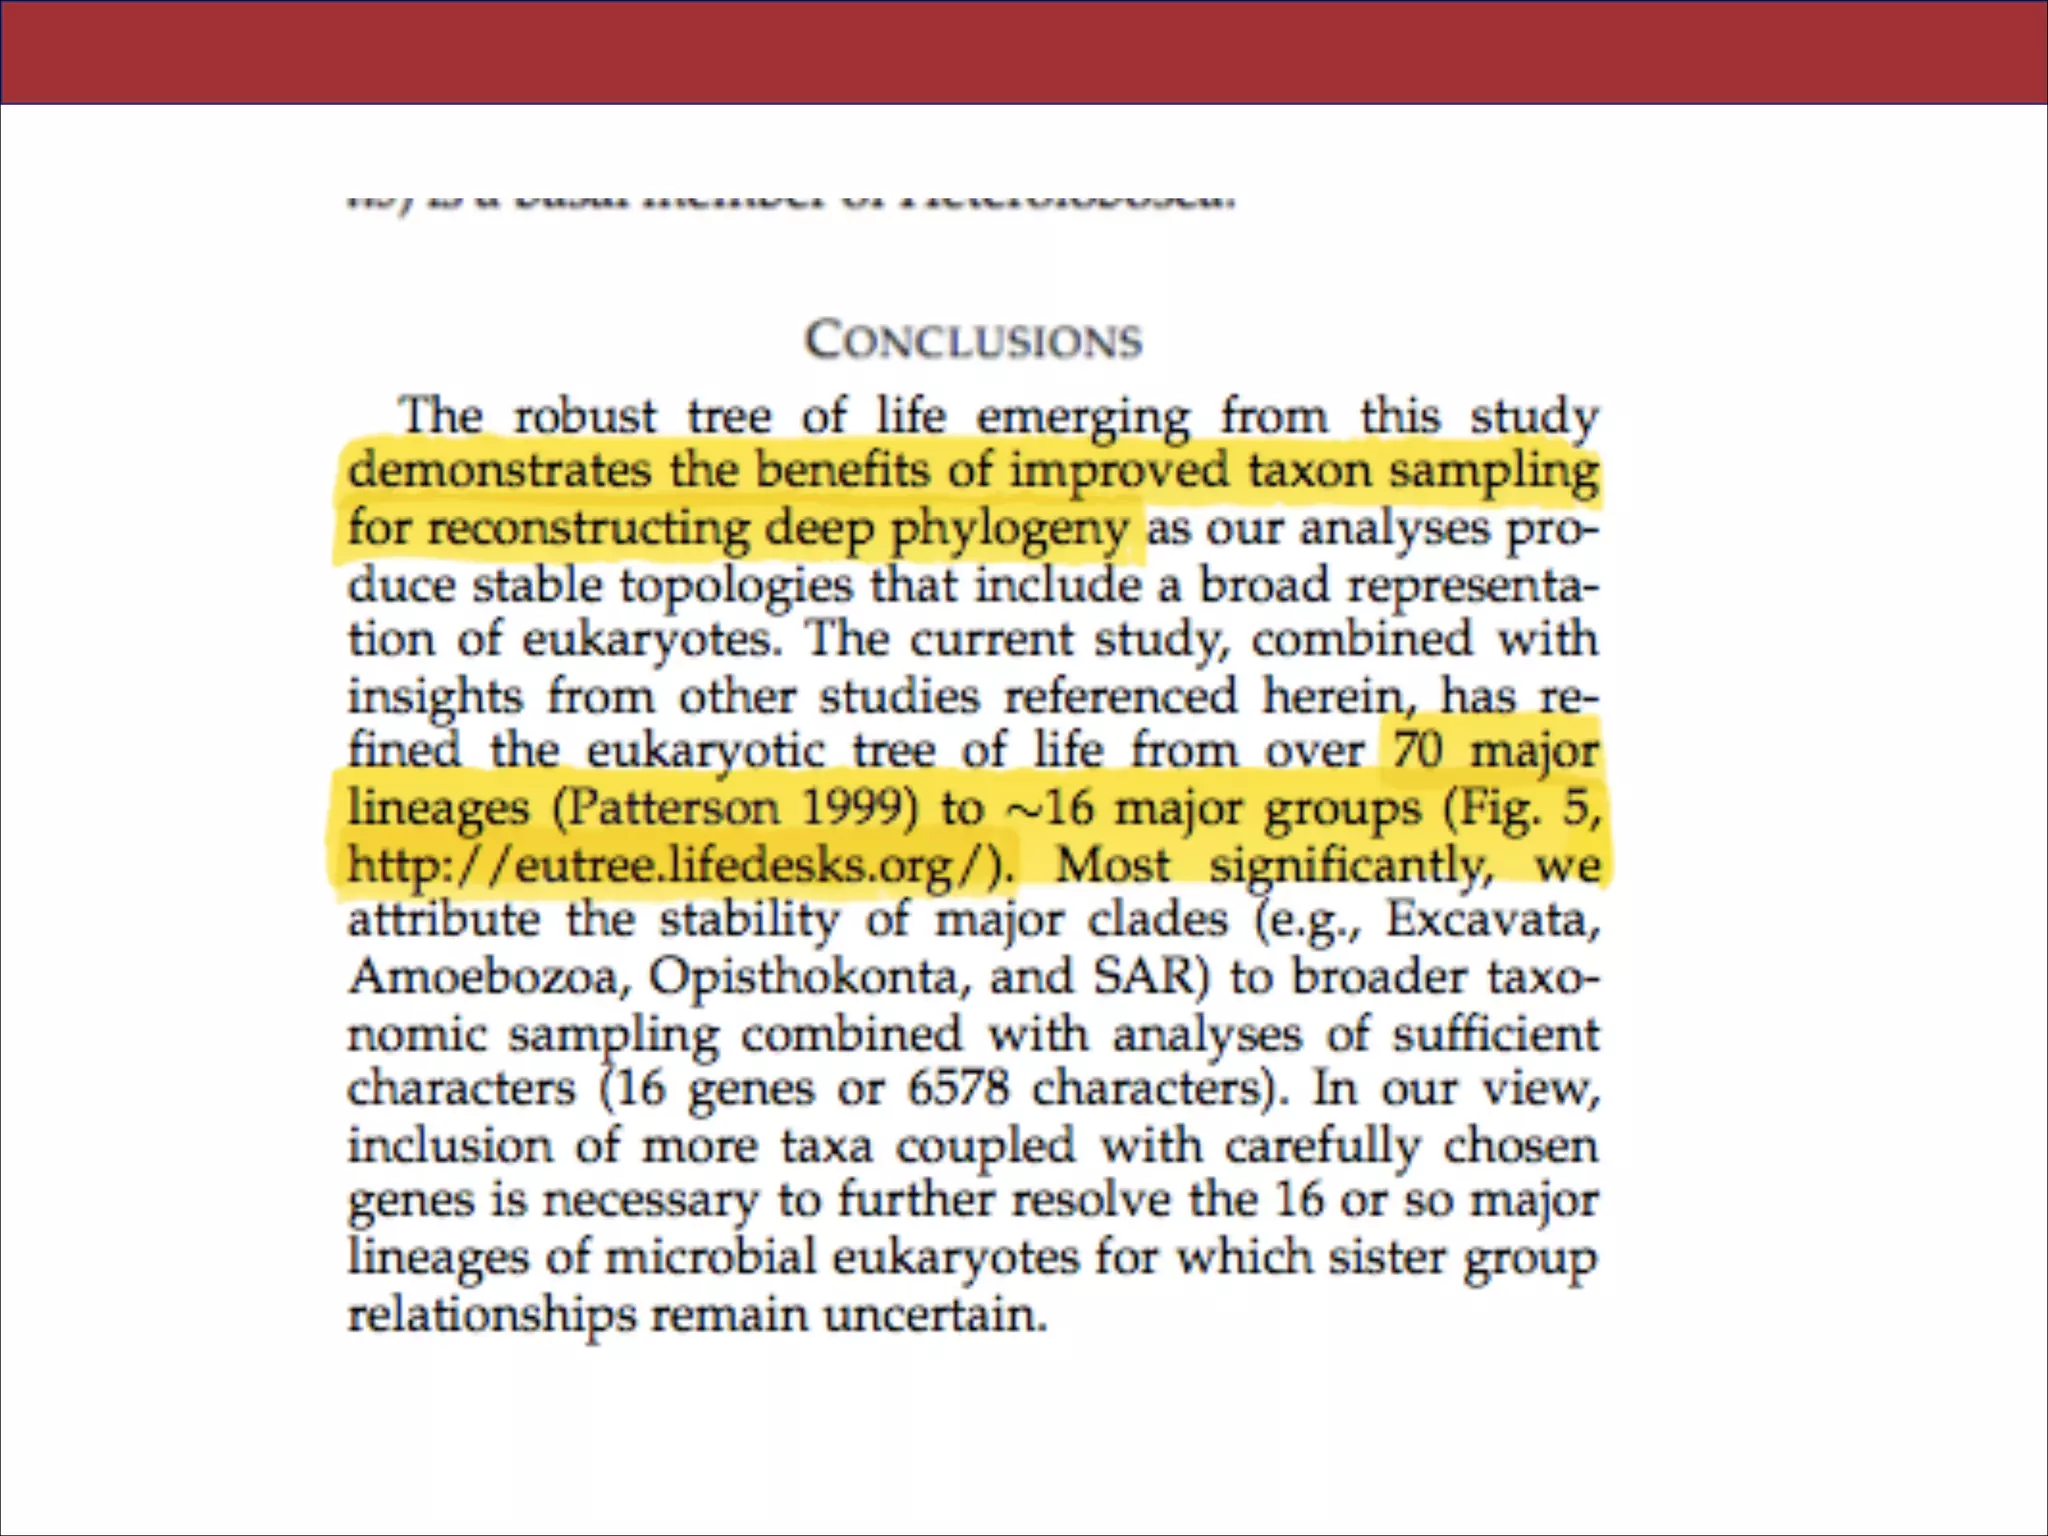
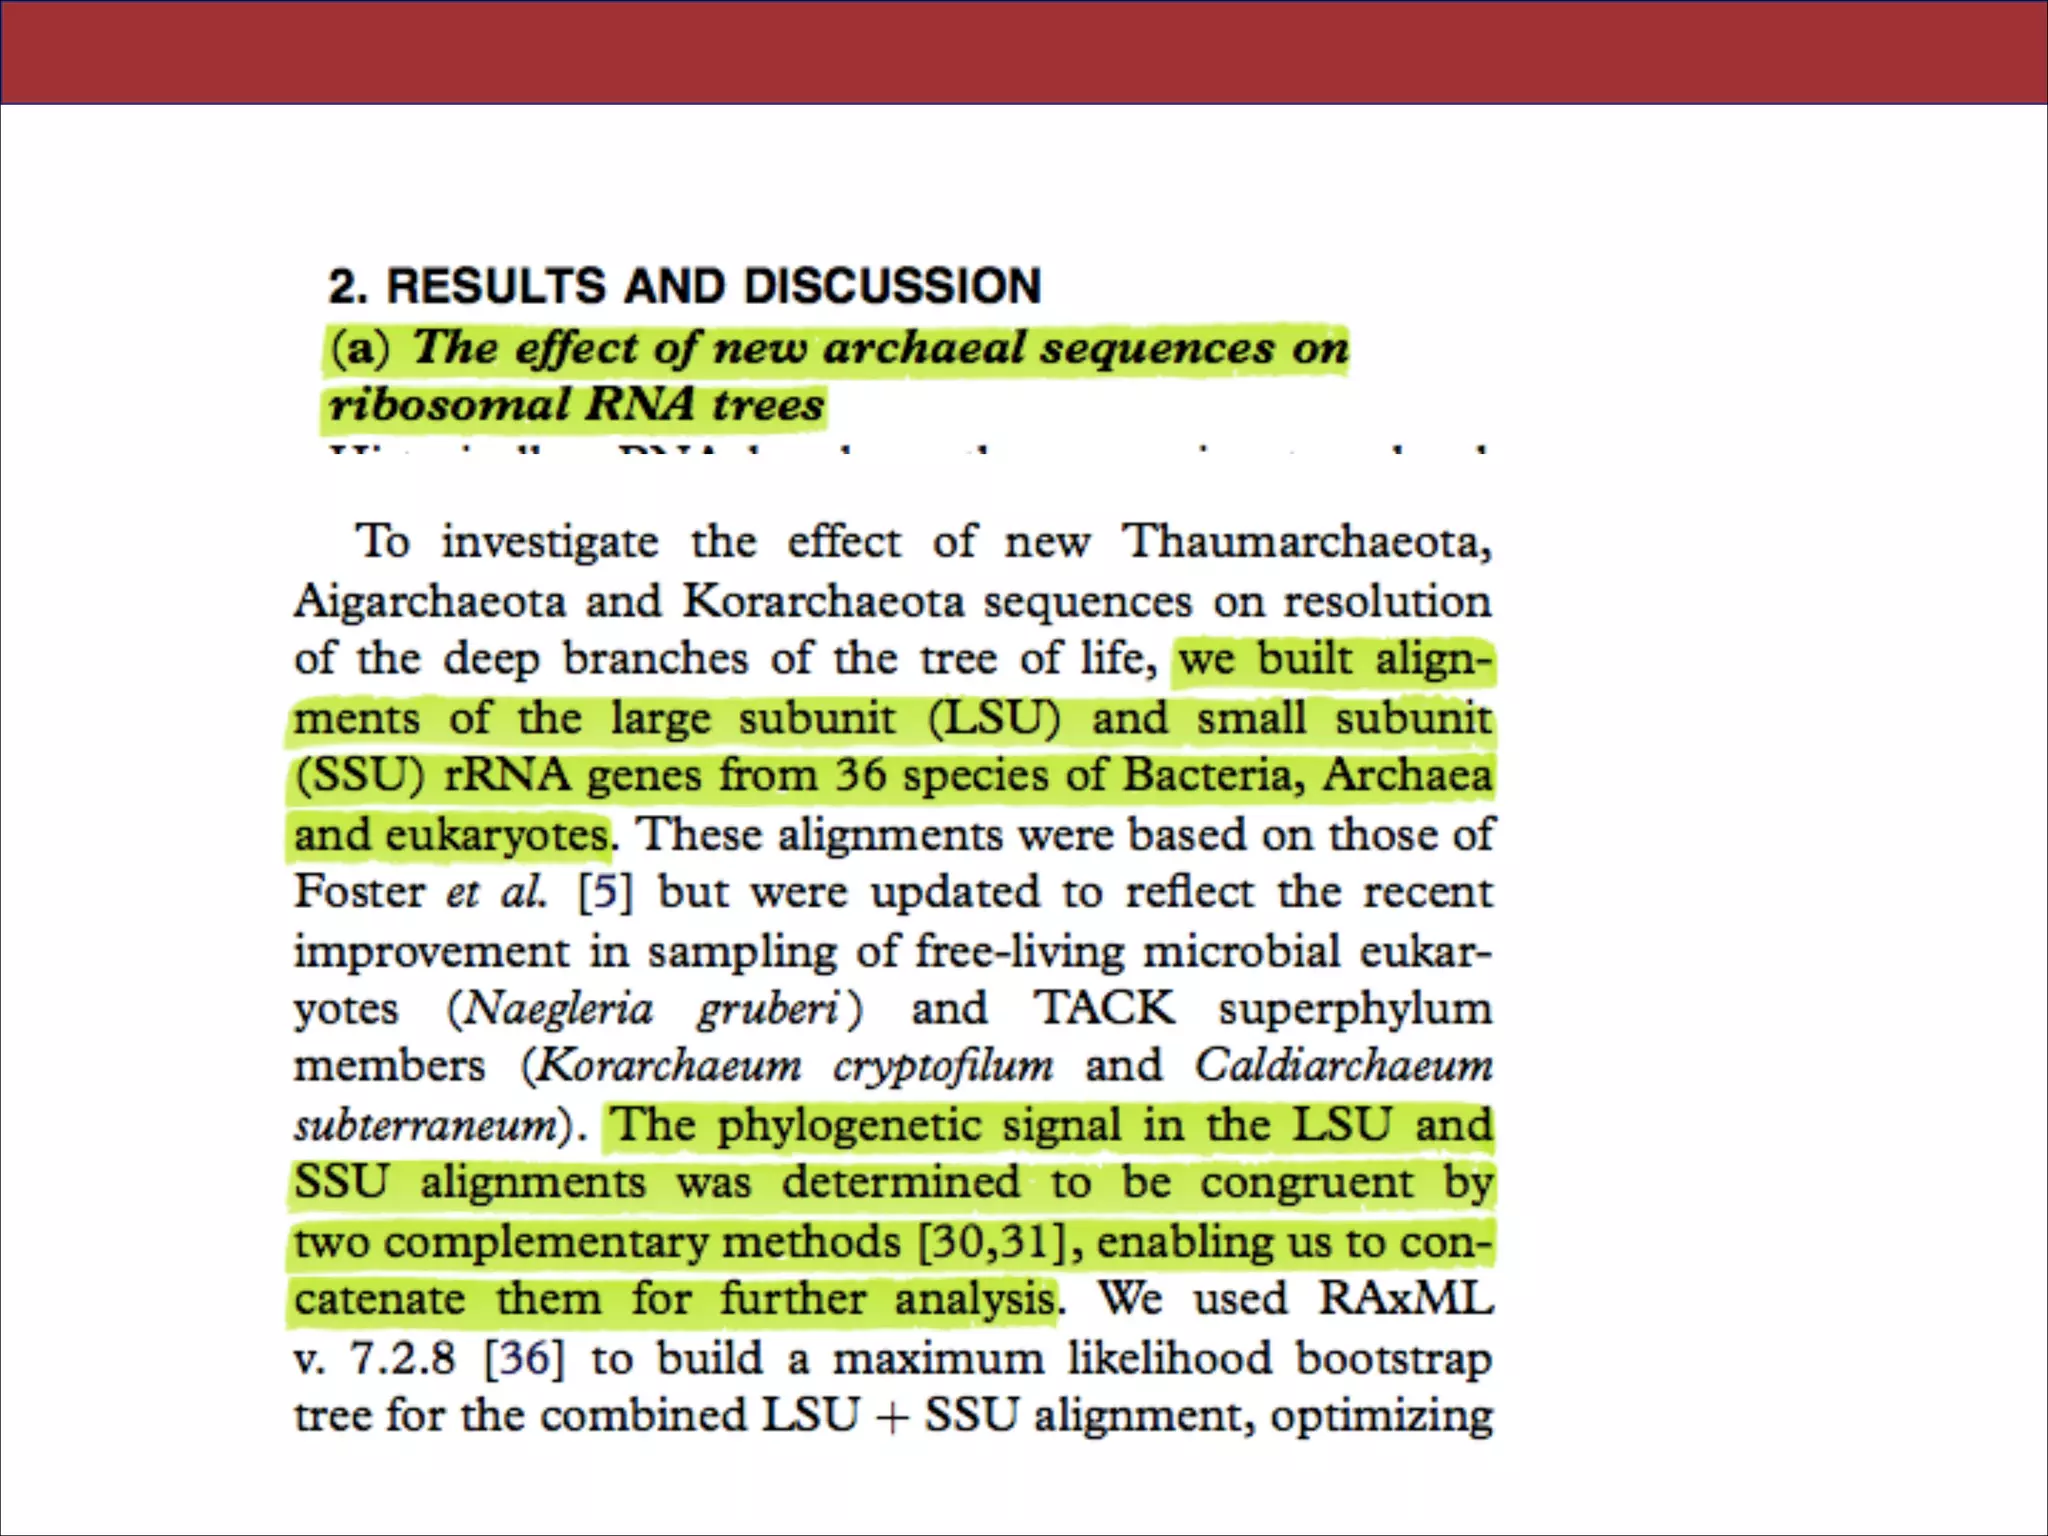
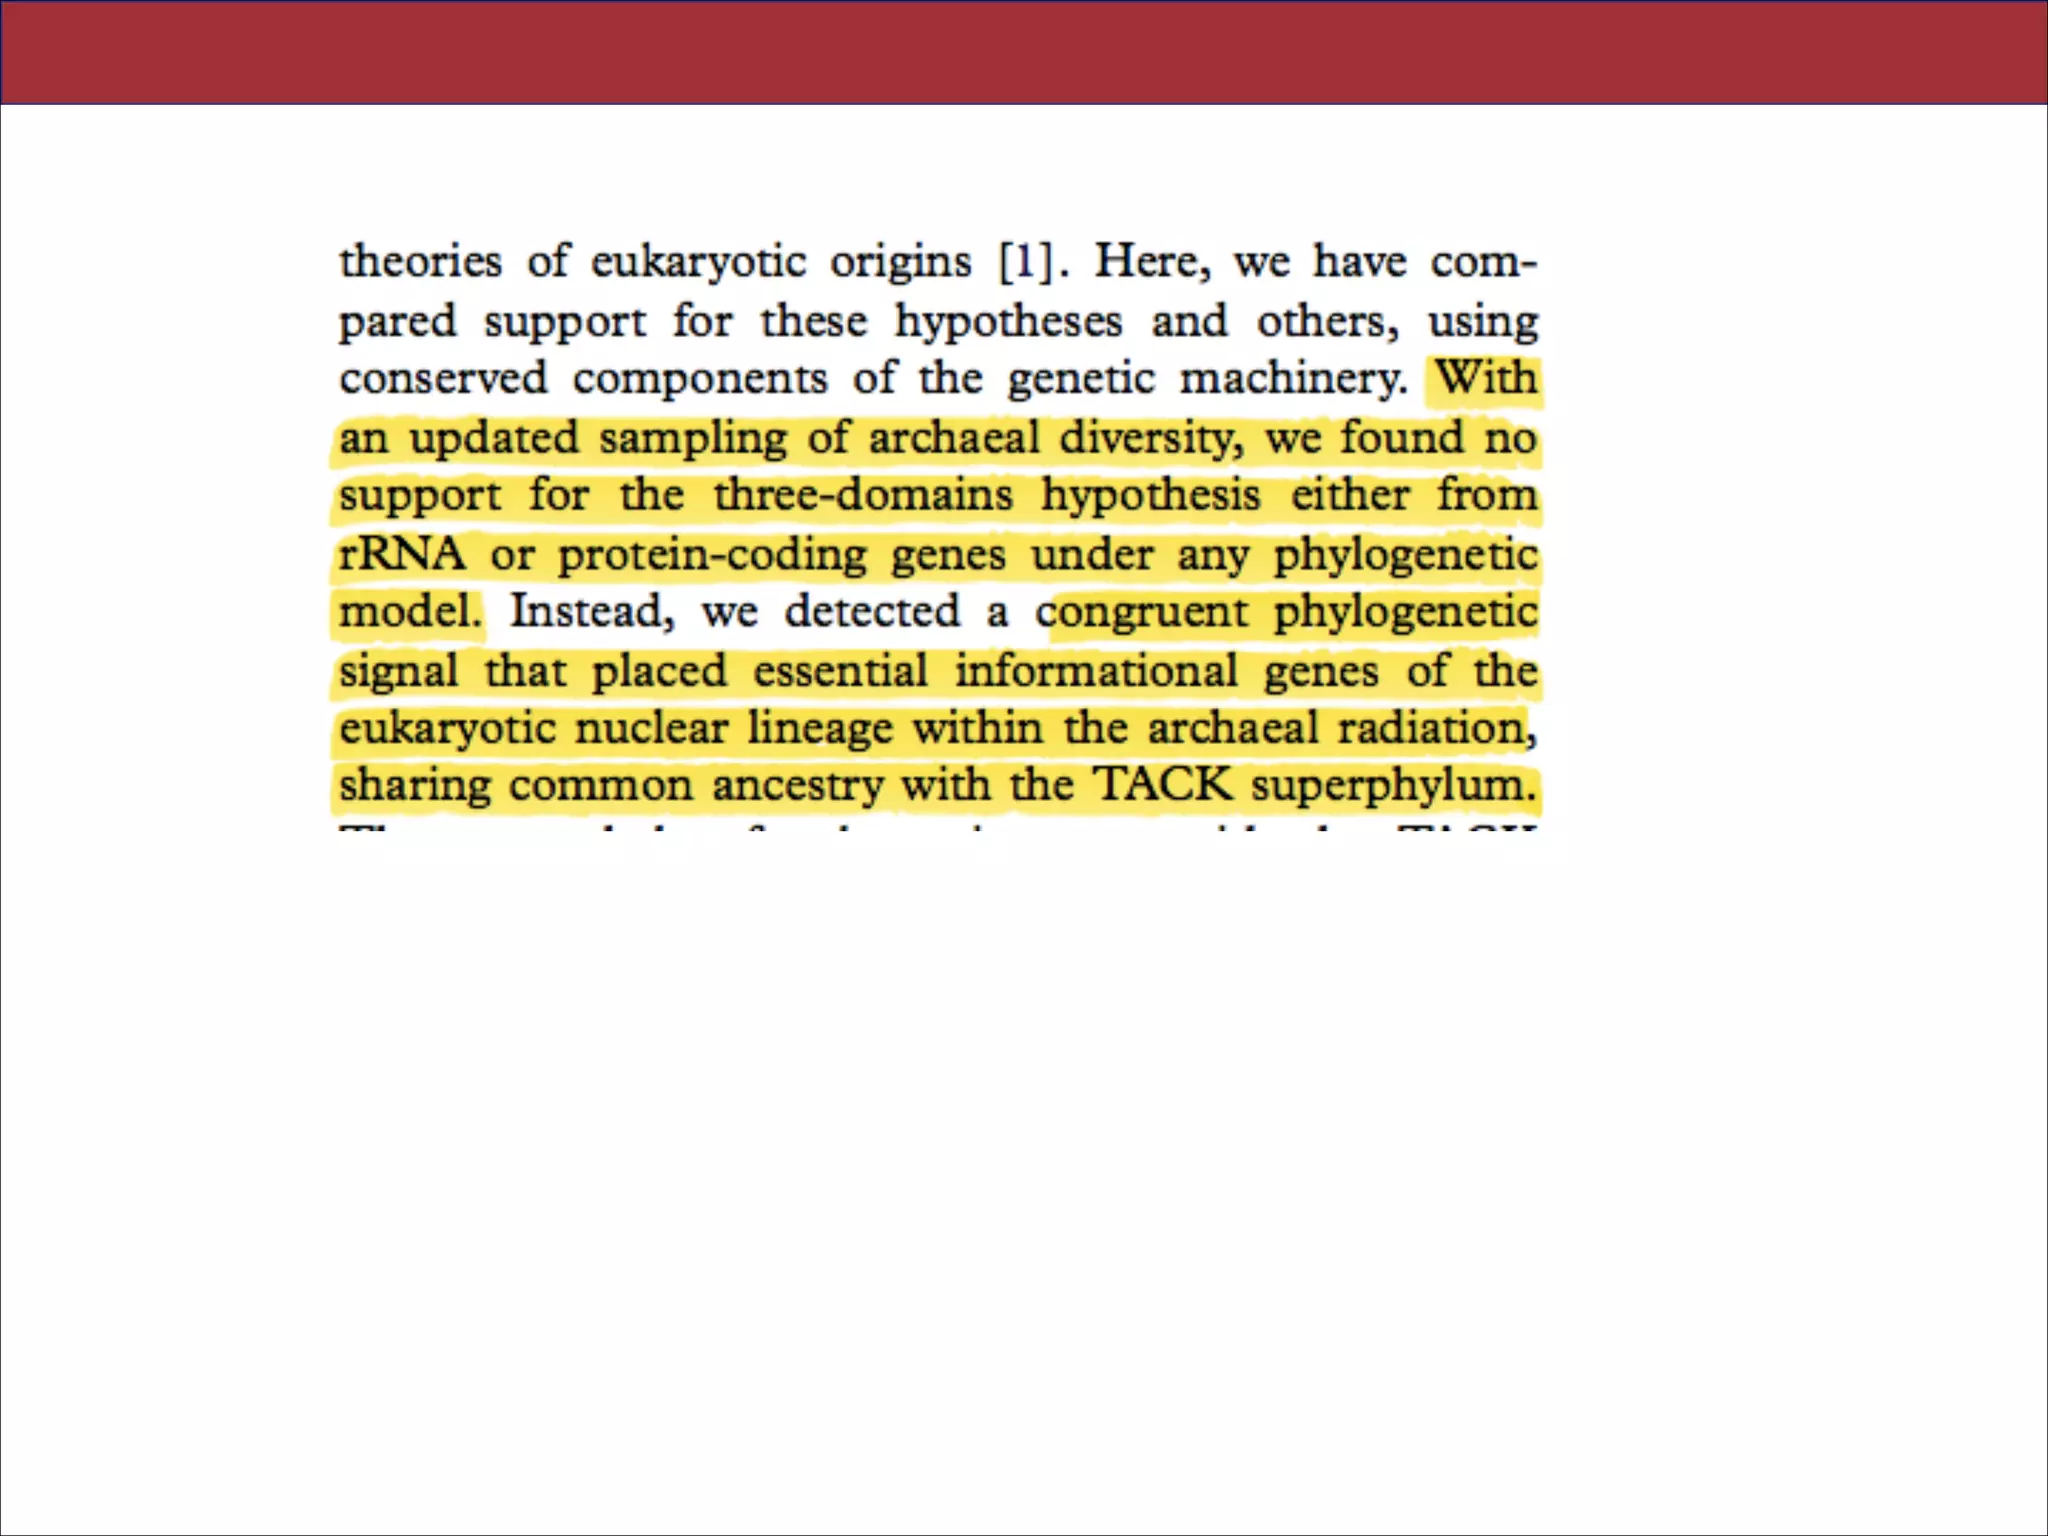
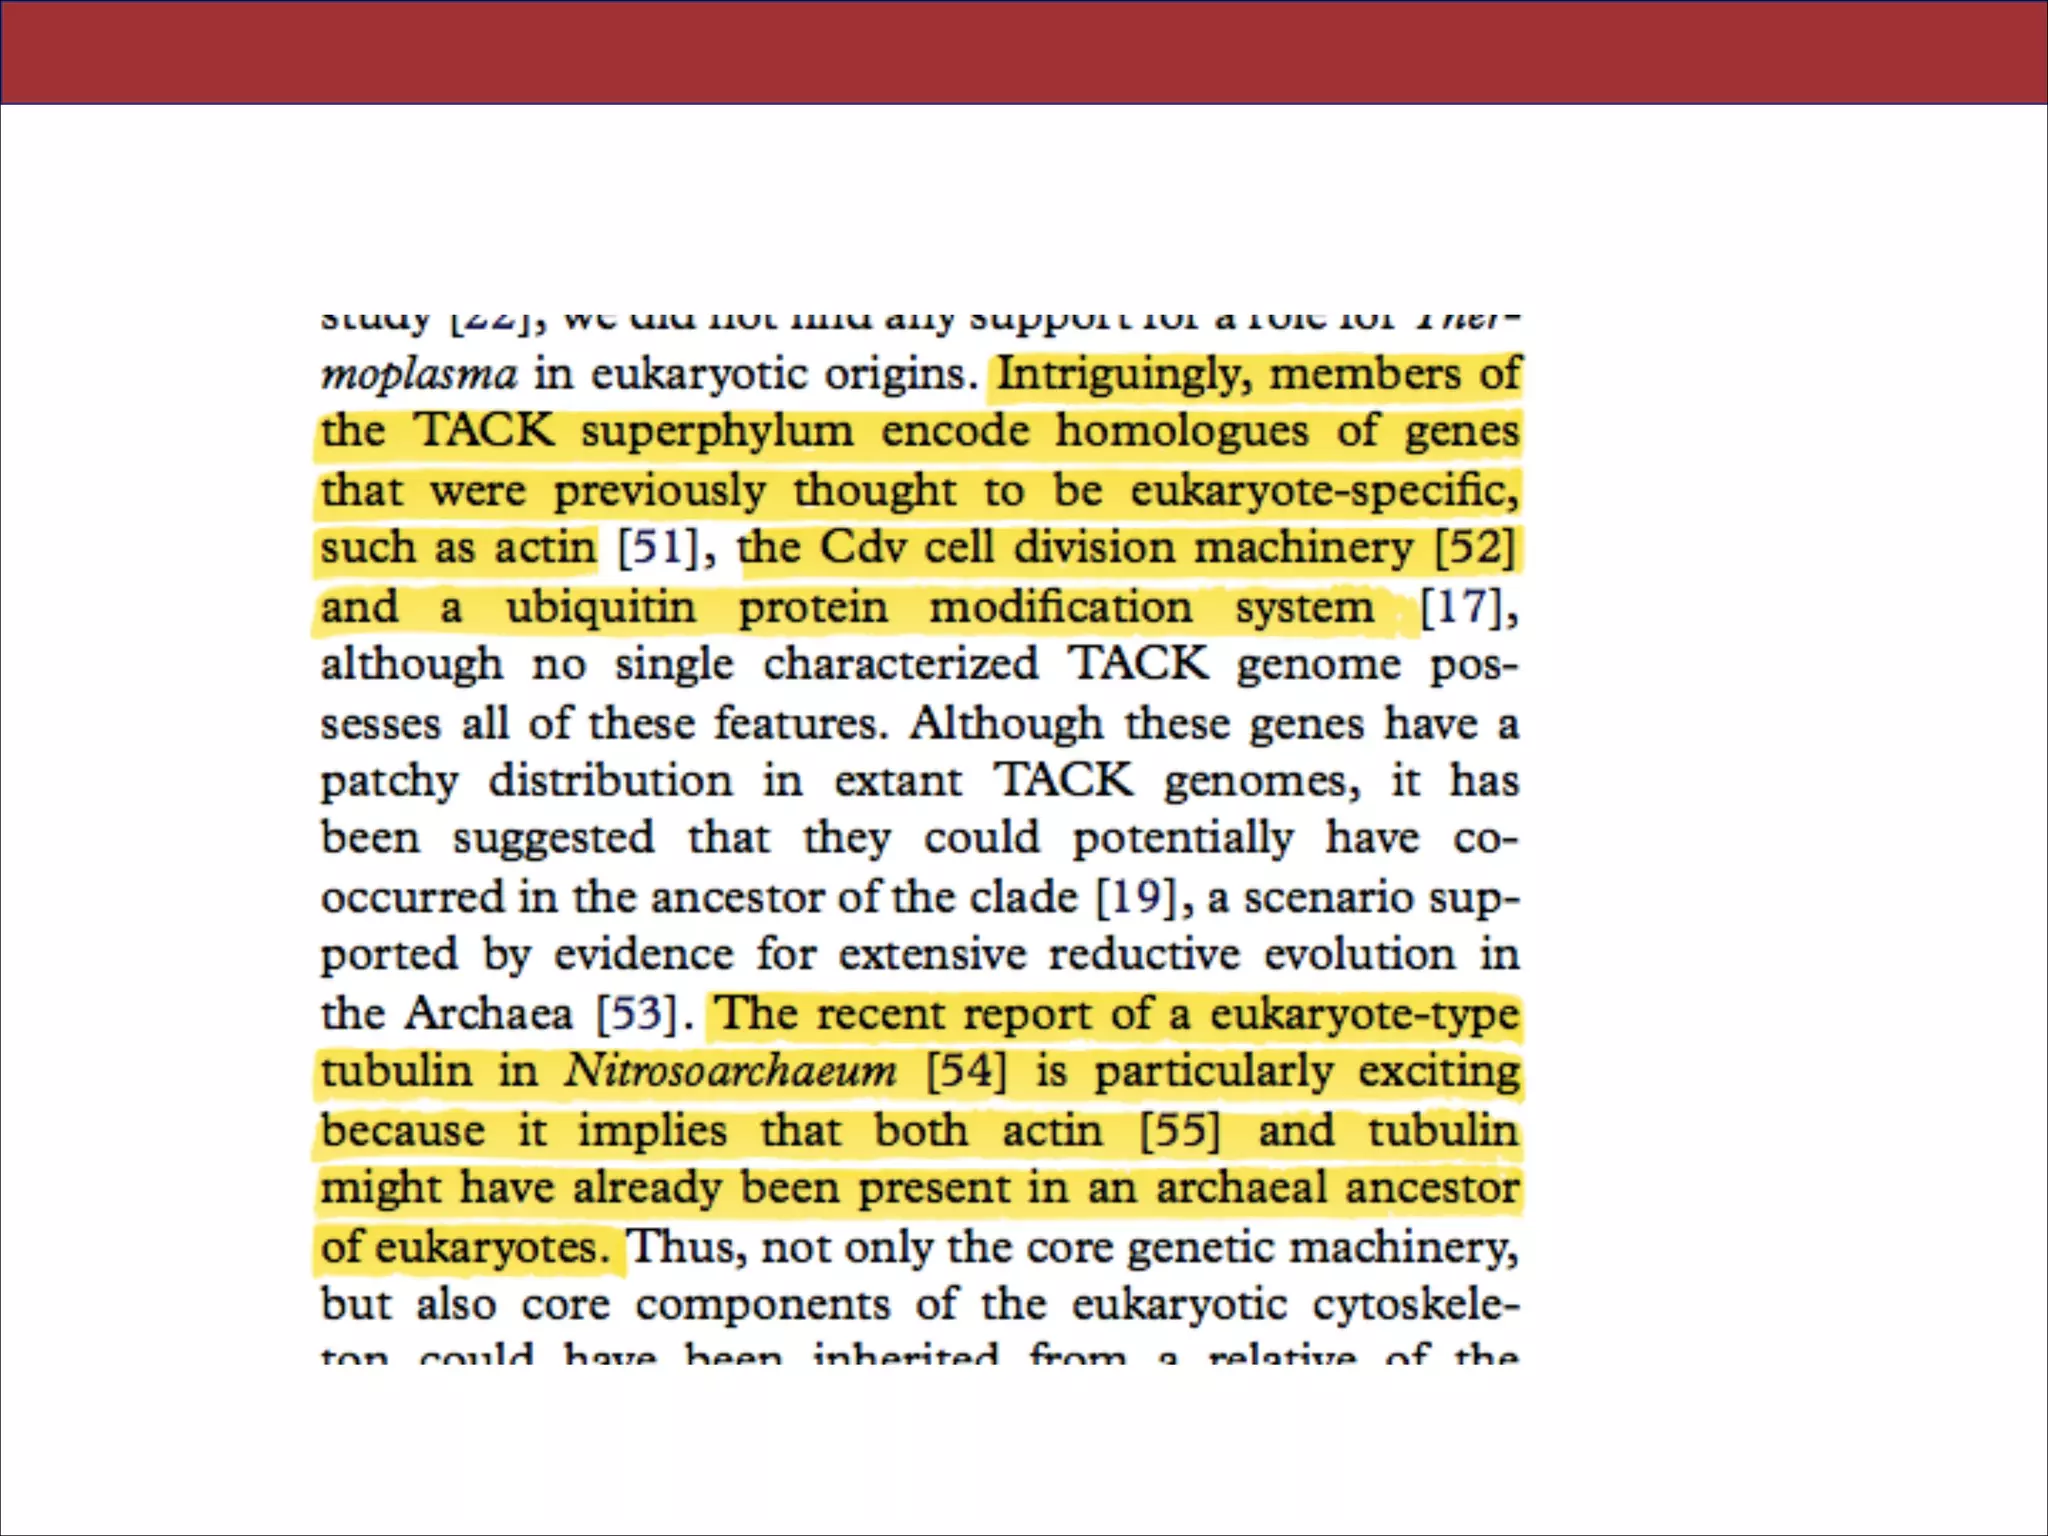
3. CONCLUSIONS
theories of eukaryotic origins [1]. Here, we have com-
!54](https://image.slidesharecdn.com/eve161-140123144708-phpapp01/75/EVE-161-Lecture-4-54-2048.jpg)

The document summarizes a lecture on the modern view of the tree of life. It discusses two papers for the lecture - one that analyzes the eukaryotic tree of life using broad taxonomic sampling, and one that places eukaryotes within the Archaea based on phylogenomic analysis. The lecture covers the parts of a phylogenetic tree, character analysis, data matrices, sequence alignment, tree reconstruction methods, and challenges like long branch attraction and homoplasy. It shows tree topologies from analyses using varying numbers of taxa.


