Download as PDF, PPTX


![necessary and, at least, at coarse grain, sufficient, to
account for prokaryotic genome evolution.
regions are contracted. In particular, P. ubiquis seems to
perfectly fit this description, having no detectable
0.1
(100)
1.0
(1,000)
10
(10,000)
Genome size, Mbp
(number of genes)
Main peak of bacterial/
archaeal genome size
distribution
MFLMG
C.r.
Genome degradation
Genome streamlining/
purifying selection
Innovation: duplication, HGT, replicon fusion
VNL
S.c.2nd peak of
bacterial genome
size distribution
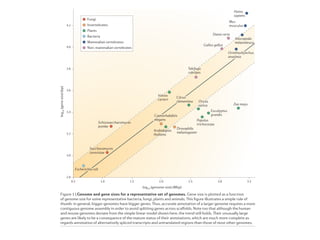
Figure 18. The principal forces of evolution in prokaryotes and their effects on archaeal and bacterial genomes. The horizontal line shows archaeal
and bacterial genome size on a logarithmic scale (in megabase pairs) and the approximate corresponding number of genes (in parentheses). On this
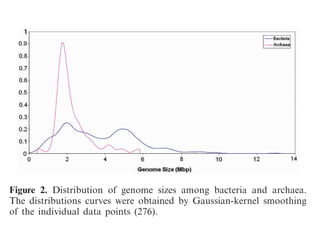
axis, some values that are important in the context of comparative genomics are roughly mapped: the two peaks of genome size distribution
(Figure 2); ‘Van Nimwegen Limit’ (VNL) determined by the ‘cellular bureaucracy’ burden; the minimal genome size of free-living archaea and
bacteria (MFL); the minimal genome size inferred by genome comparison [MG, (133,135,136)]; the smallest (C.r., C. rudii); and the largest (S.c.,
S. cellulosum) known bacterial genome size. The effects of the main forces of prokaryotic genome evolution are denoted by triangles that are
positioned, roughly, over the ranges of genome size for which the corresponding effects are thought to be most pronounced.](https://image.slidesharecdn.com/eve161-160409151540/85/Microbial-Phylogenomics-EVE161-Class-13-Comparative-Genomics-42-320.jpg)
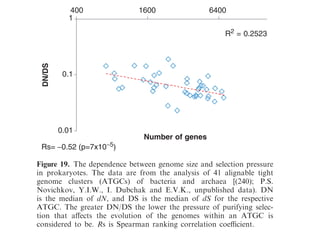

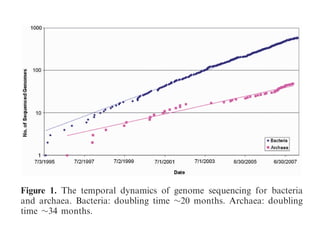
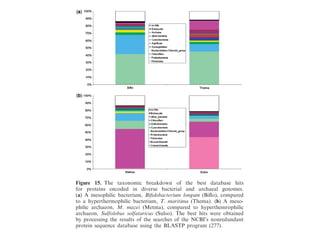
The document discusses the rapid evolution of genome sequencing, beginning with the first bacterial and archaeal genomes in the mid-1990s, which significantly accelerated the field with notable doubling times for bacteria and archaea. A comparison of sequenced genomes reveals conservation among orthologous genes and highlights the importance of horizontal gene transfer in prokaryotic evolution, while also noting the complexities of genome annotation amidst decreasing sequencing costs. Overall, it provides an insight into the principles of genome organization, the challenges of genome annotation, and the current state of research in bacterial and archaeological genomics.


![Polymer [ बहुलक ] Chemistry Notes PDF - Irfanullah Mehar - JJ Sir Chemistry.pdf](https://cdn.slidesharecdn.com/ss_thumbnails/polymerchemistrynotespdf-irfanullahmehar-jjsirchemistry-260210172118-3f9b37f7-thumbnail.jpg?width=640&height=640&fit=bounds)


