Downloaded 18 times


![Sequence uncertainty with depth in a phylogenetic tree.
Sequence uncertainty with
depth in a phylogenetic tree.
Dashed line, not corrected for
unseen changes; solid line,
corrected for unseen changes
using the following estimation:
inferred sequence change
(Knuc) = −3/4 ln[1 − (4/3)D],
where D is the number of
changes counted (31).
Pace N R Microbiol. Mol. Biol. Rev. 2009;73:565-576
Slides for UC Davis EVE161 Course Taught by Jonathan Eisen Winter 2014
!15](https://image.slidesharecdn.com/eve161-140126164752-phpapp02/85/EVE-161-Lecture-6-15-320.jpg)


![Distribution of SSU rRNA among the top 12 eucaryal phyla.
Distribution of SSU rRNA
sequences among the top
12 eucaryal phyla. Shown
is SSU rRNA sequence
distribution in the SILVA 98
SSU Parc database (52)
among the eucaryotic
phyla (EMBL taxonomy
[66]) containing the most
rRNA sequences.
Pace N R Microbiol. Mol. Biol. Rev. 2009;73:565-576
Slides for UC Davis EVE161 Course Taught by Jonathan Eisen Winter 2014
!23](https://image.slidesharecdn.com/eve161-140126164752-phpapp02/85/EVE-161-Lecture-6-23-320.jpg)


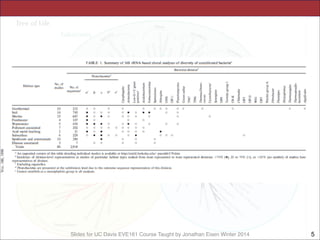
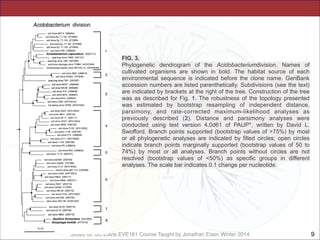
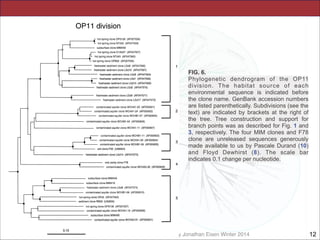
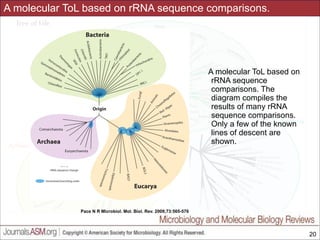
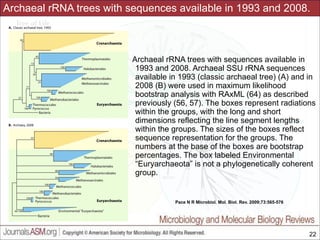
This document contains lecture slides for a course on microbial phylogenomics taught by Jonathan Eisen at UC Davis in winter 2014. The slides discuss the use of rRNA PCR and sequencing to study major microbial groups based on 16S rRNA gene sequences. They provide phylogenetic trees comparing sequences from cultivated vs uncultivated microbes in various bacterial divisions. The slides also address issues with phylogenetic analysis like unseen changes over evolutionary time and limitations in representing diversity due to a lack of cultivated microbes. Overall, the slides aim to provide students with an understanding of how rRNA gene sequencing has expanded knowledge of microbial diversity beyond what was known from culture and the challenges that remain in fully resolving deep phylogenetic relationships.


