Downloaded 25 times
![Open Access
Research article
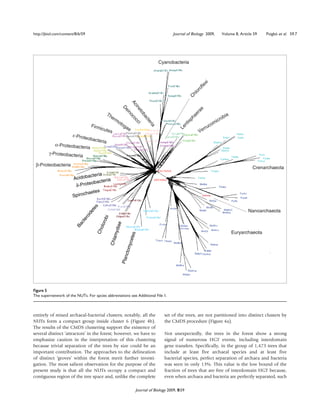
Search for a ‘Tree of Life’ in the thicket of the phylogenetic forest
Pere Puigbò, Yuri I Wolf and Eugene V Koonin
Address: National Center for Biotechnology Information, National Library of Medicine, National Institutes of Health, Bethesda, MD 20894, USA.
Correspondence: Eugene V Koonin. Email: koonin@ncbi.nlm.nih.gov
Published: 13 July 2009 Received: 25 April 2009
Revised: 19 May 2009
Journal of Biology 2009, 8:59 (doi:10.1186/jbiol159)
Accepted: 12 June 2009
The electronic version of this article is the complete one and can be
found online at http://jbiol.com/content/8/6/59
© 2009 Puigbò et al.; licensee BioMed Central Ltd.
This is an Open Access article distributed under the terms of the Creative Commons Attribution License (http://creativecommons.org/licenses/by/2.0),
which permits unrestricted use, distribution, and reproduction in any medium, provided the original work is properly cited.
Abstract
Background: Comparative genomics has revealed extensive horizontal gene transfer among
prokaryotes, a development that is often considered to undermine the ‘tree of life’ concept.
However, the possibility remains that a statistical central trend still exists in the phylogenetic
‘forest of life’.
Results: A comprehensive comparative analysis of a ‘forest’ of 6,901 phylogenetic trees for
prokaryotic genes revealed a consistent phylogenetic signal, particularly among 102 nearly
universal trees, despite high levels of topological inconsistency, probably due to horizontal
gene transfer. Horizontal transfers seemed to be distributed randomly and did not obscure
the central trend. The nearly universal trees were topologically similar to numerous other
trees. Thus, the nearly universal trees might reflect a significant central tendency, although
they cannot represent the forest completely. However, topological consistency was seen
mostly at shallow tree depths and abruptly dropped at the level of the radiation of archaeal
and bacterial phyla, suggesting that early phases of evolution could be non-tree-like (Biological
Big Bang). Simulations of evolution under compressed cladogenesis or Biological Big Bang
yielded a better fit to the observed dependence between tree inconsistency and phylogenetic
depth for the compressed cladogenesis model.
Conclusions: Horizontal gene transfer is pervasive among prokaryotes: very few gene trees
are fully consistent, making the original tree of life concept obsolete. A central trend that
most probably represents vertical inheritance is discernible throughout the evolution of
archaea and bacteria, although compressed cladogenesis complicates unambiguous resolution
of the relationships between the major archaeal and bacterial clades.
Background from the famous single illustration in Darwin’s On the
The tree of life is, probably, the single dominating meta- Origin of Species [1] to 21st-century textbooks. For about a
phor that permeates the discourse of evolutionary biology, century, from the publication of the Origin to the founding
Journal of Biology 2009, 8:59](https://image.slidesharecdn.com/foractivity2padin-091125222754-phpapp02/85/For-Activity-2-Pa-Din-1-320.jpg)
![59.2 Journal of Biology 2009, Volume 8, Article 59 Puigbò et al. http://jbiol.com/content/8/6/59
work in molecular evolution carried out by Zuckerkandl from the actual tree of cells. It should be kept in mind that
and Pauling in the early 1960s [2,3], phylogenetic trees the evolutionary history of genes also describes the evolu-
were constructed on the basis of phenotypic differences tion of the encoded molecular functions, so the phylo-
between organisms. Accordingly, every tree constructed genomic analyses have clear biological connotations. In this
during that century was an ‘organismal’ or ‘species’ tree by article we discuss the phylogenomic tree of life with this
definition; that is, it was assumed to reflect the evolutionary implicit understanding.
history of the corresponding species. Zuckerkandl and
Pauling introduced molecular phylogeny, but for the next The views of evolutionary biologists on the changing status
two decades or so it was viewed simply as another, perhaps of the tree of life (see [23] for a conceptual discussion) span
most powerful, approach to the construction of species trees the entire range from persistent denial of the major
and, ultimately, the tree of life that would embody the importance of HGT for evolutionary biology [26,27]; to
evolutionary relationships between all lineages of cellular ‘moderate’ overhaul of the tree of life concept [28-33]; to
life forms. The introduction of rRNA as the molecule of radical uprooting whereby the representation of the evolu-
choice for the reconstruction of the phylogeny of tion of organisms (or genomes) as a tree of life is declared
prokaryotes by Woese and co-workers [4,5], which was meaningless [34-36]. The moderate approach maintains
accompanied by the discovery of a new domain of life - the that all the differences between individual gene trees
Archaea - boosted hopes that the detailed, definitive topo- notwithstanding, the tree of life concept still makes sense as
logy of the tree of life could be within sight. a representation of a central trend (consensus) that, at least
in principle, could be elucidated by comprehensive com-
Even before the advent of extensive genomic sequencing, it parison of tree topologies. The radical view counters that
had become clear that biologically important common the reality of massive HGT renders illusory the very distinc-
genes of prokaryotes had experienced multiple horizontal tion between the vertical and horizontal transmission of
gene transfers (HGTs), so the idea of a ‘net of life’ genetic information, so that the tree of life concept should
potentially replacing the tree of life was introduced [6,7]. be abandoned altogether in favor of a (broadly defined)
Advances in comparative genomics revealed that different network representation of evolution [17]. Perhaps the tree
genes very often had distinct tree topologies and, accordingly, of life conundrum is epitomized in the recent debate on the
that HGT seemed to be extremely common among pro- tree that was generated from a concatenation of alignments
karyotes (bacteria and archaea) [8-17], and could also have of 31 highly conserved proteins and touted as an auto-
been important in the evolution of eukaryotes, especially as matically constructed, highly resolved tree of life [37], only
a consequence of endosymbiotic events [18-21]. These to be dismissed with the label of a ‘tree of one percent’ (of
findings indicate that a true, perfect tree of life does not the genes in any given genome) [38].
exist because HGT prevents any single gene tree from being
an accurate representation of the evolution of entire Here we report an exhaustive comparison of approximately
genomes. The nearly universal realization that HGT among 7,000 phylogenetic trees for individual genes that collec-
prokaryotes is common and extensive, rather than rare and tively comprise the ‘forest of life’ and show that this set of
inconsequential, led to the idea of ‘uprooting’ the tree of trees does gravitate to a single tree topology, but that the
life, a development that is often viewed as a paradigm shift deep splits in this topology cannot be unambiguously
in evolutionary biology [11,22,23]. resolved, probably due to both extensive HGT and
methodological problems of tree reconstruction. Neverthe-
Of course, no amount of inconsistency between gene phylo- less, computer simulations indicate that the observed pattern
genies caused by HGT or other processes can alter the fact of evolution of archaea and bacteria better corresponds to a
that all cellular life forms are linked by a tree of cell compressed cladogenesis model [39,40] than to a ‘Big Bang’
divisions (Omnis cellula e cellula, quoting the famous motto model that includes non-tree-like phases of evolution [36].
of Rudolf Virchow - paradoxically, an anti-evolutionist [24]) Together, these findings seem to be compatible with the
that goes back to the earliest stages of evolution and is only ‘tree of life as a central trend’ concept.
violated by endosymbiotic events that were key to the
evolution of eukaryotes but not prokaryotes [25]. Thus, the
travails of the tree of life concept in the era of comparative Results and discussion
genomics concern the tree as it can be derived by the phylo- The forest of life: finding paths in the thicket
genetic (phylogenomic) analysis of genes and genomes. The Altogether, we analyzed 6,901 maximum likelihood phylo-
claim that HGT uproots the tree of life more accurately has genetic trees that were built for clusters of orthologous groups
to be read to mean that extensive HGT has the potential to of proteins (COGs) from the COG [41,42] and EggNOG [43]
result in the complete decoupling of molecular phylogenies databases that included a selected, representative set of 100
Journal of Biology 2009, 8:59](https://image.slidesharecdn.com/foractivity2padin-091125222754-phpapp02/85/For-Activity-2-Pa-Din-2-320.jpg)
![http://jbiol.com/content/8/6/59 Journal of Biology 2009, Volume 8, Article 59 Puigbò et al. 59.3
2,000
few trees that could be considered to represent the ‘core of
life’, we analyzed, along with the complete set of trees, a
subset of nearly universal trees (NUTs). As the strictly uni-
versal gene core of cellular life is very small and continues
to shrink (owing to the loss of generally ‘essential’ genes in
Number of trees
some organisms with small genomes, and to errors of
1,000
genome annotation) [45,46], we defined NUTs as trees for
those COGs that were represented in more than 90% of the
included prokaryotes; this definition yielded 102 NUTs. Not
surprisingly, the great majority of the NUTs are genes
encoding proteins involved in translation and the core
0
aspects of transcription (Additional data file 3). For most of
0 20 40 60 80 100
the analyses described below, we analyzed the NUTs in
Number of species in tree
parallel with the complete set of trees in the forest of life or
else traced the position of the NUTs in the results of the
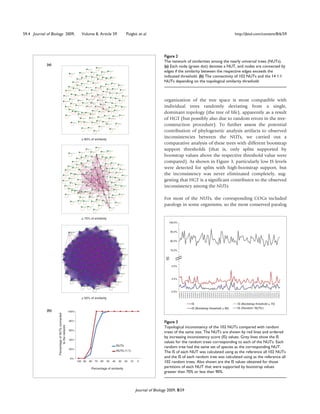
Figure 1 global analysis; however, this approach does not amount to
The distribution of the trees in the forest of life by the number of
species. using the NUTs as an a priori standard against which to
compare the rest of the trees.
prokaryotes (41 archaea and 59 bacteria; Additional data The NUTs contain a strong, consistent phylogenetic signal,
files 1 and 2). The majority of these trees include only a with independent HGT events
small number of species (less than 20): the distribution of We begin the systematic exploration of the forest of life with
the number of species in trees shows an exponential decay, the grove of 102 NUTs. Figure 2a shows the network of
with only 2,040 trees including more than 20 species connections between the NUTs on the basis of topological
(Figure 1). We attempted to identify patterns in this collec- similarity. The results of this analysis indicated that the
tion of trees (forest of life) and, in particular, to address the topologies of the NUTs were, in general, highly coherent,
question whether or not there exists a central trend among with a nearly full connectivity reached at 50% similarity
the trees that, perhaps, could be considered an approxi- ((1 - BSD) × 100) cutoff (BSD is boot split distance; see
mation of a tree of life. The principal object of this analysis Materials and methods for details; Figure 2b).
was a complete, all-against-all matrix of the topological
distances between the trees (see Materials and methods for In 56% of the NUTs, archaea and bacteria were perfectly
details). This matrix was represented as a network of trees separated, whereas the remaining 44% showed indications
and was also subject to classical multidimensional scaling of HGT between archaea and bacteria (13% from archaea to
(CMDS) analysis aimed at the detection of distinct clusters bacteria, 23% from bacteria to archaea and 8% in both
of trees. We further introduced the inconsistency score (IS), directions; see Materials and methods for details and
a measure of how representative the topology of the given Additional data file 3). In the rest of the NUTs, there was no
tree is of the entire forest of life (the IS is the fraction of the sign of such interdomain gene transfer but there were many
times the splits from a given tree are found in all trees of the probable HGT events within one or both domains (data not
forest). The key aspect of the tree analysis using the IS is that shown).
we objectively examine trends in the forest of life, without
relying on the topology of a preselected ‘species tree’ such as The inconsistency among the NUTs ranged from 1.4 to
a supertree used in the most comprehensive previous study 4.3%, whereas the mean value of inconsistency for an
of HGT [31] or a tree of concatenated highly conserved equal-sized set (102) of randomly generated trees with the
proteins or rRNAs [17,37,44]. same number of species was approximately 80%
(Figure 3), indicating that the topologies of the NUTs are
In general, trees consist of different sets of species, mostly highly consistent and non-random. We explored the
small numbers (Figure 1), so the comparison of the tree relationships among the 102 NUTs by embedding them
topologies involves a pruning step where the trees are into a 30-dimensional tree space using the CMDS proce-
reduced to the overlap in the species sets; in many cases, the dure [47,48] (see Materials and methods for details). The
species sets do not overlap, so the distance between the gap statistics analysis [49] reveals a lack of significant
corresponding trees cannot be calculated (see Materials and clustering among the NUTs in the tree space. Thus, all the
methods). To avoid the uncertainty associated with the NUTs seem to belong to a single, unstructured cloud of
pruning procedure and to explore the properties of those points scattered around a single centroid (Figure 4a). This
Journal of Biology 2009, 8:59](https://image.slidesharecdn.com/foractivity2padin-091125222754-phpapp02/85/For-Activity-2-Pa-Din-3-320.jpg)
![http://jbiol.com/content/8/6/59 Journal of Biology 2009, Volume 8, Article 59 Puigbò et al. 59.5
(a) (b)
0.15
0.5
0.4
0.1
0.3 1
0.05 0.2 2
3
0.1
V2
0 4
-0.3 -0.2 -0.1 0 0.1 0.2 0.3 0.4 0
5
-0.05 -0.5 -0.1 0 0.5 1
6
-0.2 7
-0.1
-0.3 NUTs
-0.15 -0.4
V1
-0.5
(c) (d) (e)
100% S
R (6)
Percentage of trees
Number of COGs
1000 Q 48.6 % ** (2)
80% P 63.34 % *
800 O
(1)
N
60% 42.43 % *
600 M
(3)
B L 62.11 % **
400 K
A 40% J
200 I
A&B (4)
20% H 56.21 % ** (7)
0 G (5) 49.66 % **
50.17 % **
2 3 1 4 5 6 7 F
0% E
Clusters D
1 2 3 4 5 6 7 C
CMDS clusters B
A * p = 0.0014
** p < 0.000001
Figure 4
Clustering of the NUTs and the trees in the forest of life using the classical multidimensional scaling (CMDS) method. (a) The best two-dimensional
projection of the clustering of 102 NUTs (brown squares) in a 30-dimensional space. The 14 1:1 NUTs (corresponding to COGs consisting of 1:1
orthologs) are shown as black circles. V1, V2, variables 1 and 2, respectively. (b) The best two-dimensional projection of the clustering of the 3,789
COG trees in a 669-dimensional space. The seven clusters are color-coded and the NUTs are shown by red circles. (c) Partitioning of the trees in
each cluster between the two prokaryotic domains: blue, archaea-only (A); green, bacteria-only (B); brown, COGs including both archaea and
bacteria (A&B). (d) Classification of the trees in each cluster by COG functional categories [41,42]: A, RNA processing and modification; B,
chromatin structure and dynamics; C, energy transformation; D, cell division and chromosome partitioning; E, amino acid metabolism and transport;
F, nucleotide metabolism and transport; G, carbohydrate metabolism and transport; H, coenzyme metabolism and transport; I, lipid metabolism; J,
translation and ribosome biogenesis; K, transcription; L, replication and repair; M, cell envelope and outer membrane biogenesis; N, cell motility and
secretion; O, post-translational modification, protein turnover, chaperones; P, inorganic ion transport and metabolism; Q, secondary metabolism; R,
general functional prediction only; S, uncharacterized. (e) The mean similarity values between the 102 NUTs and each of the seven tree clusters in
the forest of life (colors as in (b)).
was used for tree construction (see Materials and methods The NUTs include highly conserved genes whose phylogenies
for details). However, 14 NUTs corresponded to COGs have been extensively studied previously. It is not our aim
consisting strictly of 1:1 orthologs (all of them ribosomal here to compare these phylogenies in detail and to discuss
proteins). These 1:1 NUTs were similar to others in terms of the implications of particular tree topologies. Nevertheless,
connectivity in the networks of trees, although their it is worth noting, by way of a reality check, that the
characteristic connectivity was somewhat greater than that putative HGT events between archaea and bacteria detected
of the rest of the NUTs (Figure 2b) or their positions in the here by the separation score analysis (see Materials and
single cluster of NUTs obtained using CMDS (Figure 4a), methods for details) are compatible with previous observa-
indicating that the selection of conserved paralogs for tree tions (Additional data file 3). In particular, HGT was inferred
analysis in the other NUTs did not substantially affect the for 83% of the genes encoding aminoacyl-tRNA synthetases
results of topology comparison. (compared with the overall 44%), essential components of
Journal of Biology 2009, 8:59](https://image.slidesharecdn.com/foractivity2padin-091125222754-phpapp02/85/For-Activity-2-Pa-Din-5-320.jpg)
![59.6 Journal of Biology 2009, Volume 8, Article 59 Puigbò et al. http://jbiol.com/content/8/6/59
Table 1
Distances between the NUTs and the ‘universal tree of life’
TOL NUTs NUTs (1:1) Random NUTs
TOL 0
NUTs 0.604 ± 0.096 0.659 ± 0.076
NUTs (1:1) 0.554 ± 0.050 0.639 ± 0.065 0.607 ± 0.065
Random NUTs 0.994 ± 0.011 0.998 ± 0.004 0.999 ± 0.004 0.998 ± 0.005
The table shows the mean split distance ± standard deviation for the three sets of NUTs and the ‘universal tree of life’ (TOL) [37]. The overlap
between the tree of life and the NUTs consisted of 47 species, so the distances were computed after pruning the NUTs to that set of species.
the translation machinery that are known for their horizontal supernetwork built from the 102 NUTs suggests that the
mobility [50,51], whereas no HGT was predicted for any of incongruence among these trees is mainly concentrated at
the ribosomal proteins, which belong to an elaborate the deepest levels (except for the clean archaeal-bacterial
molecular complex, the ribosome, and hence appear to be split), with a much greater congruence at shallow phylo-
non-exchangeable between the two prokaryotic domains genetic depths (Figure 5). Of course, one should keep in
[52,53]. In addition to the aminoacyl-tRNA synthetases, and mind that the unequivocal separation of archaea and bac-
in agreement with many previous observations ([54] and teria in the supernetwork is obtained despite the apparent
references therein), evidence of HGT between archaea and substantial interdomain HGT (in around 44% of the NUTs;
bacteria was seen also for the majority of the metabolic see above), with the implication that HGT is likely to be
enzymes that belonged to the NUTs, including undecaprenyl even more common between the major branches within the
pyrophosphate synthase, glyceraldehyde-3-phosphate de- archaeal and bacterial domains. These results are congruent
hydrogenase, nucleoside diphosphate kinase, thymidylate with previous reports on the apparently random distri-
kinase, and others (Additional data file 3). bution of HGT events in the history of highly conserved
genes, in particular those encoding proteins involved in
Most of the NUTs, as well as the supertree, also showed a translation [29,53], and on the difficulty of resolving the
good topological agreement with trees produced by phylogenetic relationships between the major branches of
analysis of concatenations of universal proteins [37,55]; bacteria [28,56,57] and archaea [58,59].
notably, the mean distance from the NUTs to the tree of 31
concatenated (nearly) universal proteins [37] was very The NUTs versus the forest of life
similar to the mean distance among the 102 NUTs and that We analyzed the structure of the forest of life by embedding
between the full set of NUTs and the 14 1:1 NUTs the 3,789 COG trees into a 669-dimensional space (see
(Table 1). In other words, the ‘Universal Tree of Life’ Materials and methods for details) using the CMDS proce-
constructed by Ciccarelli et al. [37] was statistically dure [47,48] (a CMDS analysis of the entire set of 6,901
indistinguishable from the NUTs but did show obvious trees in the forest was beyond the capacity of the R software
properties of a consensus topology (the 1:1 ribosomal package used for this analysis; however, the set of COG trees
protein NUTs were more similar to the universal tree than included most of the trees with a large number of species for
the rest of the NUTs, in part because these proteins were which the topology comparison is most informative). A gap
used for the construction of the universal tree and, in part, statistics analysis [49] of K-means clustering of these trees in
presumably because of the low level of HGT among the tree space did reveal distinct clusters of trees in the
ribosomal proteins). forest. The partitioning of the forest into seven clusters of
trees (the smallest number of clusters for which the gap
The overall conclusion on the evolutionary trends among function did not significantly increase with the increase of
the NUTs is unequivocal. Although the topologies of the the number of clusters; Figure 4b) produces groups of trees
NUTs were, for the most part, not identical, so that the that differed in terms of the distribution of the trees by the
NUTs could be separated by their degree of inconsistency (a number of species, the partitioning of archaea-only and
proxy for the amount of HGT), the overall high consistency bacteria-only trees, and the functional classification of the
level indicated that the NUTs are scattered in the close respective COGs (Figure 4c,d). For instance, clusters 1, 4, 5
vicinity of a consensus tree, with the HGT events distributed and 6 were enriched for bacterial-only trees, all archaeal-
randomly, at least approximately. Examination of a only trees belong to clusters 2 and 3, and cluster 7 consists
Journal of Biology 2009, 8:59](https://image.slidesharecdn.com/foractivity2padin-091125222754-phpapp02/85/For-Activity-2-Pa-Din-6-320.jpg)
![59.8 Journal of Biology 2009, Volume 8, Article 59 Puigbò et al. http://jbiol.com/content/8/6/59
(a) (b)
100%
100%
2,177
75%
Percentage of trees
Percentage of trees
257
898
50% 50%
952
25%
2,617
0%
0%
A B C D E F G H I J K L M N NOG O P Q R S T U V NUT
IS VH 0 0 54 7 39 11 86 13 17 7 25 64 55 6 1,141 19 64 30 144 293 22 9 22 2
VL L M H VH H 0 0 10 0 9 3 10 4 3 0 2 7 11 2 95 5 12 2 29 28 9 2 4 1
M 1 0 44 3 53 10 40 14 20 8 14 28 29 8 250 23 48 7 102 114 22 5 8 4
L 0 1 49 7 64 23 28 49 17 44 15 36 27 5 235 29 31 8 94 119 14 12 6 20
VL 1 0 59 12 54 34 26 64 17 143 48 49 27 6 1,390 43 19 14 179 361 12 11 1 84
Figure 6
Distribution of the trees in the forest of life by topological inconsistency. (a) All trees. (b) Trees partitioned into COG functional categories. The
data for the NUTs are also shown. The IS values are classified as very low (VL; values less than 40% of mean IS), low (L; values less than 20% of mean
IS), medium (M; values around mean IS ± 20%), high (H; more than 20% of mean IS), and very high (VH; values more than 40% of mean IS).
HGT cannot be ruled out, for instance, in cases when a here, such as the very low inconsistency values among genes
small, compact archaeal branch is embedded within a for enzymes of nucleotide and coenzyme biosynthesis, do
bacterial lineage (or vice versa). We further explored the not readily fit the framework of the complexity hypothesis.
distribution of ISs among the trees. Rather unexpectedly,
the majority of the trees (about 70%) had either a very high We constructed a network of all 6,901 trees that collectively
or a very low level of inconsistency, suggestive of a bimodal comprise the forest and examined the position and the
distribution of the level of HGT (Figure 6a). Furthermore, connectivity of the 102 NUTs in this network (Figure 7). At
the distribution of the ISs across functional classes of genes the 50% similarity cutoff and a P-value <0.05, the 102 NUTs
was distinctly non-random: some categories, in particular, were connected to 2,615 trees (38% of all trees in the forest;
all those related to transcription and translation, but also Figure 7), and the mean similarity of the trees to the NUTs
some classes of metabolic enzymes, were strongly enriched was approximately 50%, with similar distributions of
in trees with very low ISs, whereas others, such as genes for strongly, moderately and weakly similar trees seen for most
enzymes of carbohydrate metabolism or proteins involved of the NUTs (Figure 8a). In sharp contrast, using the same
in inorganic ion transport, were characterized by very high similarity cutoff, 102 randomized NUTs were connected to
inconsistency (Figure 6b). The great majority of the NUTs only 33 trees (about 0.5% of the trees) and the mean
that include, primarily, genes for proteins involved in similarity to the trees in the forest was approximately 28%.
translation have very low ISs (Figure 6b). These observa- Accordingly, the random trees showed completely different
tions, in part, overlap with the predictions of the well- distributions of similarity to the trees in the forest, with the
known complexity hypothesis [52], according to which the consistent predominance of moderately and weakly similar
rate of HGT is low for those genes that encode subunits of trees (Figure 8b). These findings emphasize the highly non-
large macromolecular complexes, such as the ribosome, and random topological similarity between the NUTs and a
much higher for those genes whose products do not form large part of the forest of life, and show that this similarity is
such complexes. However, some of the findings reported not an artifact of the large number of species in the NUTs.
Journal of Biology 2009, 8:59](https://image.slidesharecdn.com/foractivity2padin-091125222754-phpapp02/85/For-Activity-2-Pa-Din-8-320.jpg)
![http://jbiol.com/content/8/6/59 Journal of Biology 2009, Volume 8, Article 59 Puigbò et al. 59.9
significantly differ from the random values at greater depths
(Figure 9b). The only deep signal that was apparent within
the entire forest was seen at depth 40 and corresponded to
the split between archaea and bacteria (Figure 9b); when
only the NUTs were similarly analyzed, an additional signal
was seen at depth 12, which corresponds to the separation
between Crenarchaeota and Euryarchaeota (Figure 9c).
These findings indicate that most of the edges that support
the network of trees are based on the congruence of the
NUTs
topologies in the crowns of trees whereas the deep splits are,
mostly, inconsistent. Together with a previous report that
the congruence between phylogenetic trees of conserved
prokaryotic proteins at deep levels is no greater than
random [57], these findings cast doubt on the feasibility of
identification of a central trend in the forest that could
qualify as a tree of life.
Testing the Biological Big Bang model
The sharply increasing inconsistency at the deep levels of
the forest of life suggests the possibility that the evolu-
Figure 7 tionary processes that were responsible for the formation of
Network representation of the 6,901 trees of the forest of life. The 102 this part of the forest could be much different from those
NUTs are shown as red circles in the middle. The NUTs are connected
that were in operation at lesser phylogenetic depths. More
to trees with similar topologies: trees with at least 50% of similarity with
at least one NUT (P-value <0.05) are shown as purple circles and specifically, we considered two models of early evolution at
connected to the NUTs. The rest of the trees are shown as green circles. the level of archaeal and bacterial phyla: a compressed
cladogenesis (CC) model, whereby there is a tree structure
even at the deepest levels but the internal branches are
A comparison between the NUTs and the seven clusters extremely short [39]; and a Biological Big Bang (BBB)
revealed by the CMDS analysis also showed comparable model under which the early phase of evolution involved
average levels of similarity (close to 50%) to each of the horizontal gene exchange so intensive that there is no signal
clusters (Figure 4e). Considering this relatively high and of vertical inheritance in principle [36].
uniform level of connectivity between the NUTs and the rest
of the trees in the forest, and the lack of a pronounced We simulated the evolutionary processes that produced the
structure within the set of the NUTs themselves (see above), forest of life under each of these models. To this end, it was
it appears that the NUTs potentially could be a reasonable necessary to represent the phylogenetic depth as a con-
representation of a central trend in the forest of life, despite tinuous value that would be comparable between different
the apparent existence of distinct ‘groves’ and the high branches (as opposed to the discrete levels unique for each
prevalence of HGT. tree that were used to generate the plots in Figure 9). This
task was achieved using an ultrametric tree that was
The dependence of tree inconsistency on the phylogenetic produced from the supertree of the 102 NUTs (see Materials
depth and methods; Figure 10). The inconsistency of the forest of
An important issue that could potentially affect the status of life sharply increases, in a phase-transition-like fashion,
the NUTs as a representation of a central trend in the forest between the depths of 0.7 and 0.8 (Figure 10). We attemp-
of life is the dependence of the inconsistency between trees ted to fit this empirically observed curve with the respective
on the phylogenetic depth. As suggested by the structure of curves produced by simulating the BBB at different
the supernetwork of the NUTs (Figure 4), the inconsistency phylogenetic depths by randomly shuffling the tree
of the trees notably increased with phylogenetic depth. We branches at the given depth and modeling the subsequent
examined this problem quantitatively by tallying the IS evolution as a tree-like process with different numbers of
values separately for each depth (the split depth that was HGT events. The results indicate that only by simulating the
determined by counting splits from the leaves to the center BBB at the depth of 0.8 could a good fit with the empirical
of the tree; see Materials and methods; Figure 9a) and found curve be reached (Figures 11c and 12). This depth is below
that the inconsistency of the forest was substantially lower the divergence of the major bacterial and archaeal phyla
than that of random trees at the top levels but did not (Figure 10). Simulation of the BBB at the critical depth of
Journal of Biology 2009, 8:59](https://image.slidesharecdn.com/foractivity2padin-091125222754-phpapp02/85/For-Activity-2-Pa-Din-9-320.jpg)
![59.10 Journal of Biology 2009, Volume 8, Article 59 Puigbò et al. http://jbiol.com/content/8/6/59
(a) Similarity
>80% >60% 40-60% <40% <20%
100%
80%
Percentage
of trees
60%
40%
20%
0%
COG0006
COG0012
COG0018
COG0030
COG0049
COG0057
COG0071
COG0085
COG0088
COG0091
COG0094
COG0098
COG0102
COG0112
COG0126
COG0136
COG0167
COG0186
COG0215
COG0284
COG0449
COG0459
COG0468
COG0495
COG0522
COG0528
COG0540
COG0621
COG1109
COG0148
COG0177
COG0198
COG0244
COG0358
NUTs
(b) Similarity
>80% >60% 40-60% <40% <20%
100%
Percentage
80%
of trees
60%
40%
20%
0%
Random_COG0006
Random_COG0012
Random_COG0018
Random_COG0030
Random_COG0049
Random_COG0057
Random_COG0071
Random_COG0085
Random_COG0088
Random_COG0091
Random_COG0094
Random_COG0098
Random_COG0102
Random_COG0112
Random_COG0126
Random_COG0136
Random_COG0167
Random_COG0186
Random_COG0215
Random_COG0284
Random_COG0449
Random_COG0459
Random_COG0468
Random_COG0495
Random_COG0522
Random_COG0528
Random_COG0540
Random_COG0621
Random_COG1109
Random_COG0148
Random_COG0177
Random_COG0198
Random_COG0244
Random_COG0358
Random ‘NUTs’
Figure 8
Similarity of the trees in the forest of life to the NUTs. (a) For each of the 102 NUTs, the breakdown of the rest of the trees in the forest by
percent similarity is shown. (b) The same breakdown for 102 random trees generated from the NUTs.
0.7 or above (completely erasing the phylogenetic signal Finally, when we compared the dependence of the
below the phylum level) did not yield a satisfactory fit inconsistency on phylogenetic depth for the 102 NUTs and
(Figures 11a,b and 12), suggesting that the CC model is a the complete FOL, the NUTs showed a comparable level of
more appropriate representation of the early phases of inconsistency at low depths but did not display the sharp
evolution of archaea and bacteria than the BBB model. In transition at greater depths, so that below the transition (the
other words, the signal of vertical inheritance (a central CC phase of evolution) seen in the forest of life, the
trend in the forest of life) is detectable even at these phylo- inconsistency of the NUTs was approximately tenfold lower
genetic depths, although given the high level of inconsis- (Figure 13). These results emphasize the relatively strong
tency, the determination of the correct tree topology of the (compared to the rest of the trees in the forest) vertical
deepest branches in the tree is problematic at best. The signal that is present in the NUTs throughout the entire
results of this analysis do not rule out the BBB model as the range of phylogenetic depths.
generative mechanism underlying the divergence of archaea
and bacteria, but this scenario cannot be tested in the
manner described above because of the absence of an out- Conclusions
group. Effectively, simulation of a BBB at a depth of 0.8 or Recent developments in prokaryotic genomics reveal the
greater is meaningless within the context of the present omnipresence of HGT in the prokaryotic world and are
analysis or any imaginable further analysis, because the often considered to undermine the tree of life concept -
archaea and bacteria are thought to be the primary lineages uprooting the tree of life [9,11,22,35,60]. There is no doubt
in the evolution of life on Earth. that the now well-established observations that HGT spares
Journal of Biology 2009, 8:59](https://image.slidesharecdn.com/foractivity2padin-091125222754-phpapp02/85/For-Activity-2-Pa-Din-10-320.jpg)
![http://jbiol.com/content/8/6/59 Journal of Biology 2009, Volume 8, Article 59 Puigbò et al. 59.11
(b)
1.0 10
0.8 8
0.6 6
(a)
Z
IS
0.4 4
1
0.2 2 P < 0.05
2
1 0.0 0
1 1 16 31 46
Split depth
2
(c)
1.0 10
1 1
0.8 8
0.6 6
IS
Z
0.4 4
0.2 2 P < 0.05
0.0 0
1 16 31 46
Split depth
Figure 9
The dependence of tree inconsistency on the split depth. The mean inconsistency value (IS) is shown for each split depth (1 to 46), which was
determined by counting the splits in the trees from leaves to the center of the tree. (a) Schematic of the procedure used to determine the split
depth. (b) IS plotted against split depth for all 6,901 trees of the forest of life. (c) IS plotted against split depth for the 102 NUTs. The vertical axis on
the right in (b,c) shows the z-score, and the grey bars show the z-score values for the respective depths.
virtually no genes at some stages in their history [15,16] archaea and bacteria. On the other hand, we detected a
overthrow a ‘strong’ tree of life concept under which all (or distinct signal of a consensus topology that was particularly
the substantial majority) of the genes would tell a consistent strong in the NUTs. Although the NUTs showed a substan-
story of genome evolution (the species tree, or the tree of life) tial amount of apparent HGT, the transfer events seemed to
if analyzed using appropriate methods. However, is there any be distributed randomly and did not obscure the vertical
hope of salvaging the tree of life as a statistical central trend signal. Moreover, the topology of the NUTs was quite simi-
[28]? The results of a comprehensive comparative analysis of lar to those of numerous other trees in the forest, so
phylogenetic trees for prokaryotic genes described here although the NUTs certainly cannot represent the forest
suggest a positive answer to this crucial question. completely, this set of largely consistent, nearly universal
trees is a reasonable candidate for representing a central
The message from this analysis is twofold. On the one hand, trend. However, the opposite side of the coin is that the
we detected high levels of inconsistency among the trees consistency between the trees in the forest is high at shallow
comprising the forest of life, most probably due to extensive depths of the trees and abruptly drops, almost down to the
HGT, a conclusion that is supported by more direct observa- level of random trees, at greater phylogenetic depths that
tions of numerous probable transfers of genes between correspond to the radiation of archaeal and bacterial phyla.
Journal of Biology 2009, 8:59](https://image.slidesharecdn.com/foractivity2padin-091125222754-phpapp02/85/For-Activity-2-Pa-Din-11-320.jpg)
![59.12 Journal of Biology 2009, Volume 8, Article 59 Puigbò et al. http://jbiol.com/content/8/6/59
Desvu01Bp
Deira01Bd
Ricpr01Bp
1 Bp
p
p
x01B
e01B
Me pe0 1 p
Bp
Agrtu0
01B
Bp
Sta u
fl01
Mete
Neim
01 p
H yp c
ma
1B
ma
0.0
Bp
Me t
S u to
P s t ca 0
B ur
b
Su o
s n a0 1 p
la
t
F u y xx 0 1 B
Me
Su
Es eae
1B p
l
B
Ae
ls
M cco
u
rp
P y ae
0.2
e
Bp
u0
Py
ris
Py
02 Bp Real
r
r sp
T h ca u l y0 1
Ca ete S lp 1B
s 0.030
Th
lm
a
0.4
He rbu0 Bv
1
ep Bo Pr0
Py e n v
ra Ca r01B
Pyr b hlt Bv
ho 0.6 C
lp n01
Pyr Ch 1B s
fu pa0
T he Tre 1 Bv
ko
0.8 Le nar0
C e ns v
a0 1 B
Metma
y Opib
b01B o
0.020
Gemo
Metac o
Plama01B
IS
Metba Blama01Bo
Metbu Rhoba01Bo
Metla Vicva01Bv
Arcfu Versp01Bv
Methu Provi01
Bb 0.010
Metcu Chlte
01Bb
h Cyth
Natp u01B
a Bac b
Halw th01
Bb
p Fla
Hals jo
T h 01B b
lma e
Ha Clo th01B
t ka d
Me tth Le ac01
Me t s t Ac
pin
01 f
B 0.000
Me C So iba0 Bs
M
m
et mp
Th lus 1Bi
e m 0 1B
0 0.5 1
et i
R u o t h 1B c
a0
Th etja
M 1B
M o vi 0 1 B c
Th ac
b x 01
M
o
t
o
y0 B f
e
G l ma0 B c
Phylogenetic depth
ev
1B
P r sp 01
Un icto
S y r0 1 B c
a
o
e
cm
T ri e a 0 1 B c
P
N an a
n
A na
eq
ts
F e rn 0 1 B q
N os
A qu
A c am
Me
L ac c a
Theel0
B acsu01
Dehsp01
Mesfl01Bf
Myctu01Ba
Chlau01Bh
Biflo01Ba
v
sp0
o0 1
ae
a 01 B
0 1B f
1 Bc
Bt
1B c
Bf
Bh
c
Figure 10
Ultrametric tree produced from the supertree of the 102 NUTs (left) and the dependence of mean inconsistency on phylogenetic depth in this tree
(right). The inconsistency versus depth plot is for all 6,901 trees in the forest of life. Species abbreviations as in Figure 5.
This observation casts doubt on the existence of a central high levels of similarity between the NUTs and different
trend in the forest of life and suggests the possibility that the clusters of trees in the forest suggest that the trend, even if
early phases of evolution might have been non-tree-like (a relatively weak, is primarily vertical.
Biological Big Bang [36]). To address this problem directly,
we simulated evolution under the CC model [39,40] and In summary, HGT is pervasive in the prokaryotic world, so
under the BBB model, and found that the CC scenario that there are very few fully consistent NUTs. Thus, the
better approximates the observed dependence between tree original tree of life concept is obsolete: it would not even be
inconsistency and phylogenetic depth. Thus, a consistent a ‘tree of one percent’ [38]. Nevertheless, there seems to be a
phylogenetic signal seems to be discernible throughout the discernible signal of consistency between the trees in the
evolution of archaea and bacteria but, under the CC model, forest of life, down to the deepest branching levels. Whether
the prospect of unequivocally resolving the relationships or not this central trend is denoted a tree of life could be a
between the major archaeal and bacterial clades is bleak. matter of convention and convenience, but the nature of
this trend as well as the other trends that can be discerned
The most straightforward interpretation of the detected in the forest merit further investigation.
central trend in the forest of life is that it represents vertical
inheritance permeating the entire history of archaea and
bacteria. A contribution from ‘highways’ of HGT (that is, Materials and methods
preferential HGT between certain groups of archaea and Clusters of orthologous genes for phylogenetic tree analysis
bacteria) that could mimic vertical evolution [15] cannot be The analyzed dataset consisted of representatives of 6,901
ruled out. However, in our view, the lack of significant clusters of likely orthologs from the COGs database [41,42]
clustering within the group of NUTs and the comparable or the EggNOG database [43] from 100 prokaryotic species -
Journal of Biology 2009, 8:59](https://image.slidesharecdn.com/foractivity2padin-091125222754-phpapp02/85/For-Activity-2-Pa-Din-12-320.jpg)
![http://jbiol.com/content/8/6/59 Journal of Biology 2009, Volume 8, Article 59 Puigbò et al. 59.13
(a) (b) (c)
0.030
IS
0.015
0.000
0 0.5 1 0 0.5 1 0 0.5 1
Phylogenetic depth Phylogenetic depth Phylogenetic depth
Figure 11
Evolutionary simulations of a Biological Big Bang at different phylogenetic depths and with different numbers of HGT events. Each panel is a plot of
the mean tree inconsistency versus phylogenetic depth (in the ultrametric tree). The empirical dependence is shown by a thick blue line, and the
results of simulations with 1 to 200 HGT events are shown by thin lines along a color gradient. (a) BBB simulated at depth 0.6; (b) BBB simulated at
depth 0.7; (c) BBB simulated at depth 0.8.
59 bacteria and 41 archaea - that were manually selected to positions, and the maximum number of allowed
represent all the major divisions of the two prokaryotic contiguous non-conserved amino acid positions set at 20.
domains (Additional data file 1). The BeTs algorithm [41] The maximum likelihood phylogenetic trees were construc-
was used to identify the orthologs with the highest mean ted under the best substitution model using the Multiphyl
similarity to the other members of a cluster (‘index’ ortho- program, which was also used for bootstrap analysis [64].
logs [61]), so that each of the final clusters contained a The Multiphyl program employs methods from the
maximum of 100 sequences (no more than one from each ModelGenerator program to choose, for each alignment, the
of the included organisms). The rationale behind the best of 88 models of amino acid substitution [65]. The
selection of index orthologs for phylogenetic analysis is that entire set of 6,901 trees used in this study is contained in
this procedure identifies the members of co-orthologous Additional data file 2, and all alignments used for the tree
gene sets that experienced minimal (if any) acceleration of construction are available at [66].
evolution as a result of gene duplication, and accordingly
minimizes the potential long-branch artifacts. A group of Supernetwork construction and analysis
102 COGs that were represented in more than 90 organisms The phylogenetic supernetwork from the 102 NUTs was built
was defined as the subset of NUTs (Additional data file 3). following the method developed by Huson et al. [67] and
Finally, 12 COGs containing more than 300 sequences each implemented in the SplitsTree4 program [68] with default
were excluded from the subsequent analysis. parameters. The supernetwork was used for an initial
overview of the 102 NUTs set to identify signals and
Protein sequence alignment and tree construction incongruence at different phylogenetic depths. The signals
The protein sequences from each COG were aligned using identified by the examination of the supernetwork were
the Muscle program [62] with default parameters and all verified by the comparative analysis of the tree topologies and
alignments were refined using the Gblocks program [63] by the calculation of the IS against the phylogenetic depth.
with the minimal length of a block set at six amino acid
Journal of Biology 2009, 8:59](https://image.slidesharecdn.com/foractivity2padin-091125222754-phpapp02/85/For-Activity-2-Pa-Din-13-320.jpg)
![59.14 Journal of Biology 2009, Volume 8, Article 59 Puigbò et al. http://jbiol.com/content/8/6/59
0.025 (a)
0.030
0.020
IS
0.015
IS0.8 - IS0.6
0.015
Real data
0.000
0.010
D0 = 0.8 (b)
D0 = 0.7 0.004
IS
0.005 D0 = 0.6
0.002
0.000 0
0 50 100 150 200
(c)
HGT 0.040
IS
0.020
Figure 12
Drop in IS values between phylogenetic depths of 0.6 and 0.8 for the
0.000
real data and three simulations of the Biological Big Bang (BBB). Red,
0 0.2 0.4 0.6 0.8 1
real data; blue, BBB simulated at the depth of 0.6; green, BBB simulated
at the depth of 0.7; violet, BBB simulated at the depth of 0.8. The Phylogenetic depth
horizontal axis shows the number of simulated HGT events and the
vertical axis shows the differences between IS values at the
phylogenetic depths of 0.8 and 0.6. Figure 13
Drop in IS values between phylogenetic depths of 0.6 and 0.8 for the
real data and three simulations of the Biological Big Bang (BBB). Red,
real data; blue, BBB simulated at the depth of 0.6; green, BBB simulated
Ultrametric tree at the depth of 0.7; violet, BBB simulated at the depth of 0.8. The
horizontal axis shows the number of simulated HGT events and the
The topology of the ultrametric tree was obtained from the
vertical axis shows the differences between IS values at the
supertree of the 102 NUTs using the CLANN program [69]. phylogenetic depths of 0.8 and 0.6.
The branch lengths from each of the 6,901 trees was used to
calculate the average distance between each pair of species.
The matrix obtained was used to calculate the branch of all splits, x is the mean bootstrap value of equal splits,
lengths of the supertree. This supertree with branch lengths and y is the mean bootstrap value of different splits.
was then used to construct an ultrametric tree using the
program KITSCH from the Phylip package [70] and rescaled The pairwise comparison was made for trees with leaf sets
to a depth range of 0 to 1. This tree was used to compute that either completely or partially overlap. If trees partially
phylogenetic depth in the analysis of the dependence of tree overlap in at least four species, they are pruned to their
inconsistency on phylogenetic depth. common leaf set in order to compare the topologies. If two
trees cannot be compared because they overlap by fewer
Tree comparison than four species, a maximum BSD of 1 was assigned.
An all-against-all comparison of the trees was performed
using a new method that we denoted BSD. The BSD method Classical multidimensional scaling analysis
is a modification of the split distance (SD) method for tree CMDS, also known as principal coordinate analysis,
comparison [71] that additionally takes into account the embeds n data points implied by a [n × n] distance matrix
bootstrap values of the trees. Both indices range from 0 to 1 into an m-dimensional space (m < n) in such a manner that,
but the SD method assigns equal weights to all branches in for any k ∈ [1,m], the embedding into the first k dimensions
a tree, whereas under the BSD method the distance between is the best in terms of preserving the original distances
two trees depends on the level of bootstrap support for the between the points [47,48]. Given that in this work the
branches of each tree. The BSD corresponds to the average relationships between phylogenetic trees are defined in
[BSD = (eBSD + dBSD)/2] of the BSD of equal splits bet- terms of tree-to-tree distance, CMDS is the natural approach
ween two trees (eBSD = 1 - [(e/a)·x]) and the BSD of the to analyze the structure of the tree space. The function
different splits (dBSD =(d/a)·y). Here e is the sum of cmdscale of the R package was used to perform CMDS on
bootstrap values of equal splits, d is the sum of bootstrap BSD distances between the trees. The number of dimensions
values of different splits, a is the sum of the bootstrap values corresponding to preserving 75% of the total inertia
Journal of Biology 2009, 8:59](https://image.slidesharecdn.com/foractivity2padin-091125222754-phpapp02/85/For-Activity-2-Pa-Din-14-320.jpg)
![http://jbiol.com/content/8/6/59 Journal of Biology 2009, Volume 8, Article 59 Puigbò et al. 59.15
(30 dimensions for 102 NUTs and 669 dimensions for given tree, and Y is the number of times the splits from the
3,789 COG trees) was chosen for further analysis. given tree are found in all trees of the forest. Under this
formula, ISmin = 1/(XN) and ISmax = [1/(X)] - ISmin. Thus, IS
Clustering of data points in multidimensional space was is a measure of how representative the topology of the given
performed using the kmeans function of the R package that tree is of the entire forest of life.
implements the K-means algorithm [72]. The choice of the
optimal number of clusters was performed using an R script Split depth and phylogenetic depth
implementing the gap statistics algorithm [49]. In the case The IS was calculated along the depth of the trees, namely,
of the 102 NUTs, the highest value of the gap function was split depth and phylogenetic depth. The split depth was
observed at K = 1, for K ∈ [1,30], indicating a single cluster calculated for each phylogenetic tree according to the
in the tree space. In the case of the 3,789 COG trees, the gap number of splits from the tips to the center of the tree. The
function was increasing for K ∈ [1,30], suggesting a strong value of split depth ranged from 1 (2 species - 1) to 49
tendency of these trees to form multiple clusters. Following ((100 species/2) - 1). The phylogenetic depth was obtained
the recommendations of Tibshirani et al. [49], K = 7 was from the branch lengths of the rescaled ultrametric tree and
chosen as the lowest number of clusters for which the value ranged from 0 to 1.
of the gap function for K = k + 1 was not significantly higher
than that for K = k (z-score below 1.96, corresponding to Simulation of Biological Big Bang and HGT
0.05 significance level). The simulation of a BBB was performed by cutting the
ultrametric tree at different levels of depth (D0) and
Inference of horizontal gene transfer reassembling the bottom part of the tree to simulate
To analyze all possible cases of HGT between bacteria and infinite numbers of HGT events. The BBB simulation was
archaea in the NUTs, we used the score of separation B/A made at D0 = 0.6, D0 = 0.7 and D0 = 0.8, and repeated 100
(SSB/A) that was calculated, for each branch in a tree, by times each. The different levels of depth simulated are D0
subtracting the number of bacteria or archaea on one side = 0.6, corresponding to the depth just after the
of the tree from the number of bacteria or archaea on the hypothetical BBB, that is, in the hypothetical tree-like
other side (SSB/A= ⏐pAleft-pAright⏐ = ⏐pBleft-pBright⏐) where phase; D0 = 0.7, which corresponds to the hypothetical
pA and pB are the percentages of archaeal and bacterial BBB; and D0 = 0.8, which corresponds to the hypothetical
species, respectively. The tree was assigned the highest biological inflation phase. Each tree obtained after the
value of the separation score obtained for all its branches. simulation of the BBB was processed to simulate an
This score was also used to analyze possible cases of HGT increasing number of HGT events from 1 to 200. These
between bacteria and archaea in those trees that include HGT simulations were performed by cutting the tree at
at least five archaeal species and at least five bacterial random depth DR (DR < D0) and swapping a random pair
species. of branches.
The value of the B/A score ranges from 0 to 1. A tree is
considered free of archaeal-bacterial HGT if the B/A score
Additional data files
Additional data file 1 contains a list of species (59 bacterial
equals 1, that is, archaea and bacteria are perfectly separated
and 41 archaeal) used for the FOL construction. Additional
in the given tree. The B/A score values of less than 1 are
data file 2 contains all the phylogenetic trees. Additional
considered indicative of HGT. These cases can be classified
data file 3 contains a list of the 102 COGs that are
into three categories: first, HGT from bacteria to archaea
represented in at least 90 of the100 selected archaea and
(B → A) when there is a nearly perfect separation of these
bacteria.
two groups but inside the bacteria there is a small group of
archaeal species; second, HGT from archaea to bacteria
(A → B) when there is a small group of bacterial species Acknowledgements
We are grateful to Liran Carmel (Hebrew University, Israel) for helpful
inside the archaeal domain; and third, bidirectional HGT discussions of multidimensional analysis and clustering. EVK is grateful
events (A ↔ B) when the greatest score of separation B/A is to Michael Gelfand, Andrei Mironov and members of the Moscow
obtained by mixing archaeal and bacterial species (pAleft, Seminar on Bioinformatics for an inspiring discussion. The authors’
research is supported by the Department of Health and Human Ser-
pAright, pBleft and pBright <100%). vices intramural program (NIH, National Library of Medicine).
Inconsistency score References
IS is the fraction of the times that the splits from a given tree 1. Darwin C: On the Origin of Species. London: John Murray; 1859.
2. Zuckerkandl E, Pauling L: Molecular evolution. In Horizons in Bio-
are found in all N trees that comprise the forest of life: IS = chemistry. Edited by Kasha MBP. New York: Academic Press;
[(1/Y - ISmin]/ISmax, where X is the number of splits in the 1962: 189-225.
Journal of Biology 2009, 8:59](https://image.slidesharecdn.com/foractivity2padin-091125222754-phpapp02/85/For-Activity-2-Pa-Din-15-320.jpg)
![http://jbiol.com/content/8/6/59 Journal of Biology 2009, Volume 8, Article 59 Puigbò et al. 59.17
60. Koonin EV: Darwinian evolution in the light of genomics. Nucleic 66. Alignments for tree construction [ftp://ftp.ncbi.nih.gov/pub/koonin/
Acids Res 2009, 37:1011-1034. FOL]
61. Krylov DM, Wolf YI, Rogozin IB, Koonin EV: Gene loss, protein 67. Huson DH, Dezulian T, Klopper T, Steel MA: Phylogenetic super-
sequence divergence, gene dispensability, expression level, and networks from partial trees. IEEE/ACM Trans Comput Biol Bioin-
interactivity are correlated in eukaryotic evolution. Genome Res form 2004, 1:151-158.
2003, 13:2229-2235. 68. Huson DH, Bryant D: Application of phylogenetic networks in
62. Edgar RC: MUSCLE: multiple sequence alignment with high accu - evolutionary studies. Mol Biol Evol 2006, 23:254-267.
racy and high throughput. Nucleic Acids Res 2004, 32:1792-1797. 69. Creevey CJ, McInerney JO: Clann: investigating phylogenetic infor -
63. Talavera G, Castresana J: Improvement of phylogenies after mation through supertree analyses. Bioinformatics 2005, 21:390-
removing divergent and ambiguously aligned blocks from protein 392.
sequence alignments. Syst Biol 2007, 56:564-577. 70. Felsenstein J: Inferring phylogenies from protein sequences by par -
64. Keane TM, Naughton TJ, McInerney JO: MultiPhyl: a high-through - simony, distance, and likelihood methods. Methods Enzymol 1996,
put phylogenomics webserver using distributed computing. 266:418-427.
Nucleic Acids Res 2007, 35(Web Server issue):W33-W37. 71. Puigbo P, Garcia-Vallve S, McInerney JO: TOPD/FMTS: a new soft -
65. Keane TM, Creevey CJ, Pentony MM, Naughton TJ, McLnerney JO: ware to compare phylogenetic trees. Bioinformatics 2007, 23:
Assessment of methods for amino acid matrix selection and their 1556-1558.
use on empirical data shows that ad hoc assumptions for choice of 72. Hartigan JA, Wong MA: A K-means clustering algorithm. Appl Stat
matrix are not justified. BMC Evol Biol 2006, 6:29. 1979, 28:100-108.
Journal of Biology 2009, 8:59](https://image.slidesharecdn.com/foractivity2padin-091125222754-phpapp02/85/For-Activity-2-Pa-Din-17-320.jpg)

1) The study analyzed over 6,900 phylogenetic trees from prokaryotic gene families to investigate the "tree of life" concept in light of extensive horizontal gene transfer among prokaryotes. 2) Analysis of 102 "nearly universal trees" representing genes present in over 90% of species found they were generally consistent with each other and separate archaea from bacteria, despite some evidence of horizontal transfer between domains. 3) The nearly universal trees showed a consistent phylogenetic signal and appeared randomly distributed around a single tree topology, suggesting a discernible central trend despite horizontal gene transfer obscuring deep relationships.