Download as PDF, PPTX


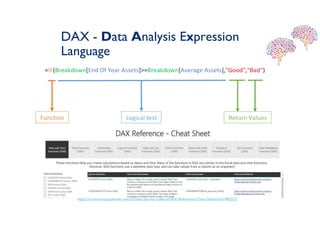


![Backlog – Date Table
Date =
ADDCOLUMNS (
CALENDAR (DATE(2000;1;1); DATE(2025;12;31));
"DateAsInteger"; FORMAT ( [Date]; "YYYYMMDD" );
"Year"; YEAR ( [Date] );
"Monthnumber"; FORMAT ( [Date]; "MM" );
"YearMonthnumber"; FORMAT ( [Date]; "YYYY/MM" );
"YearMonthShort"; FORMAT ( [Date]; "YYYY/mmm" );
"MonthNameShort"; FORMAT ( [Date]; "mmm" );
"MonthNameLong"; FORMAT ( [Date]; "mmmm" );
"DayOfWeekNumber"; WEEKDAY ( [Date] );
"DayOfWeek"; FORMAT ( [Date]; "dddd" );
"DayOfWeekShort"; FORMAT ( [Date]; "ddd" );
"Quarter"; "Q" & FORMAT ( [Date]; "Q" );
"YearQuarter"; FORMAT ( [Date]; "YYYY" ) & "/Q" & FORMAT ( [Date]; "Q" )
)](https://image.slidesharecdn.com/loqutus-adeep-diveintomicrosoftpowerbi-190509105105/85/LoQutus-A-deep-dive-into-Microsoft-Power-BI-32-320.jpg)
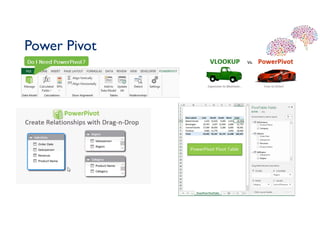
![DAX – Calculating a Backlog
• Add the following columns to the date table:
• ‘Opened’/’Closed’ –The number of tickets opened/closed on that day
• ‘TotalOpened’/’TotalClosed’ – Number of tickets opened/closed up to that day
• The Backlog is nowTotal Opened minusTotal Closed
Opened = CALCULATE(
COUNT(Tickets[TicketNr]);
FILTER(Tickets;Tickets[DatumAangemaakt]=EARLIER('Date'[Date]))
)
TotalOpened = CALCULATE(
SUM('Date'[Opened]);
ALL('Date’);
'Date'[Date]<=EARLIER('Date'[Date])
)](https://image.slidesharecdn.com/loqutus-adeep-diveintomicrosoftpowerbi-190509105105/85/LoQutus-A-deep-dive-into-Microsoft-Power-BI-33-320.jpg)
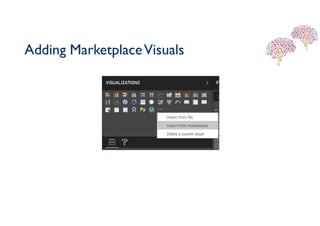


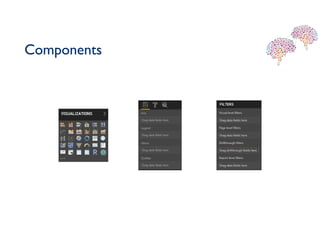
The document outlines a Power BI deep-dive workshop focusing on data visualization and analytics using advanced features of Power BI. It includes practical exercises, such as building a dashboard for tracking support ticket SLA metrics, and covers various analytical methods like descriptive, diagnostic, predictive, and prescriptive analytics. The session aims to equip participants with the necessary skills and templates to enhance their data exploration and visualization capabilities.


![[Infographic] Cloud Integration Drivers and Requirements in 2015](https://cdn.slidesharecdn.com/ss_thumbnails/cloudintegrationdriversandrequirementsin2015-141217184007-conversion-gate02-thumbnail.jpg?width=640&height=640&fit=bounds)


