Downloaded 106 times


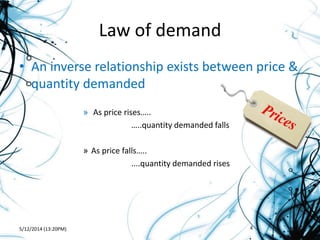


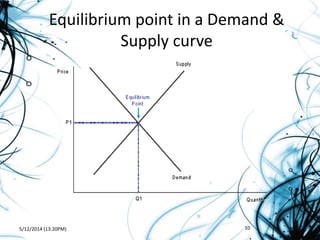
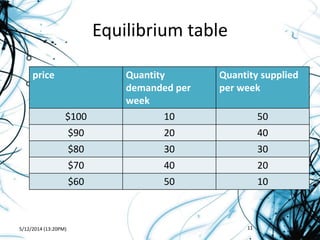


The document discusses the concepts of demand, supply, and market equilibrium. It defines demand as the quantity consumers are willing to buy at a given price, and supply as the quantity producers are willing to provide. Equilibrium exists where supply and demand are equal, establishing an equilibrium price and quantity. The document outlines the laws of supply and demand and how shifts can change the equilibrium point, such as a rise in demand increasing both price and quantity. Causes of excess supply or demand are also examined, and how equilibrium is impacted by changes in underlying market factors.


