Downloaded 380 times


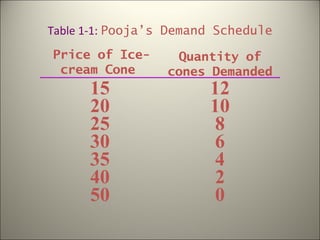
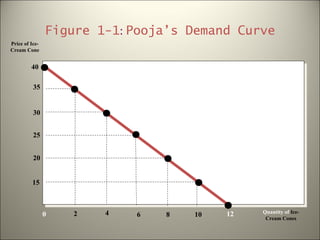

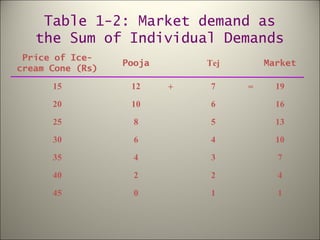


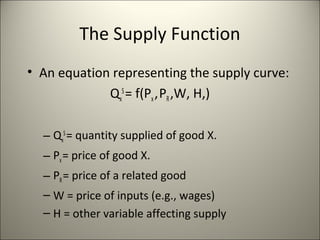


The document discusses the concepts of supply and demand in competitive markets. It examines what determines demand and supply for a good, how supply and demand interact to set market price and quantity, and how prices allocate scarce resources. Key factors that influence demand include price, income, prices of substitutes and complements. Supply is influenced by price, costs of inputs, technology and number of sellers. Market equilibrium occurs when quantity demanded equals quantity supplied. The equilibrium price clears the market.


