SlideShare a Scribd company logo
Merrill Lynch does and seeks to do business with companies covered in its research reports. As a result, investors should be aware that the firm may
have a conflict of interest that could affect the objectivity of this report. Investors should consider this report as only a single factor in making their
investment decision.
Refer to important disclosures on page 18 to 19. 10555923
Canadian Equity Strategy
Staying defensive
Highlights
Over the past six months, our Canadian equity strategy recommendations have
revolved around two key themes – caution on the overall market following the
impressive gains of recent years, as global liquidity ebbs and risk appetites
normalize, and a preference for sectors more exposed to solid domestic economic
conditions (financials, consumer staples) than to softening US and global
conditions (energy, materials). We reiterate those views here.
Our TSX targets remain unchanged at 11,900 at end-2006 and 12,300 at end-
2007; ditto for our earnings per share estimates of C$740 and C$765 respectively.
The latter implies earnings growth of 3% in 2007, well below the prevailing
bottom-up consensus at 13%.
Recent price action and related developments have brought the profile of our
quantitative equity sector scorecard into better alignment with our macro-driven
preference for defensive positioning. The materials sector falls from 1st
to 5
th
in the
rankings; the financials sector rises from 5th
to 2
nd
. Our sector recommendations
(with this quarter’s changes in parentheses) are:
Overweight: Financials, Consumer Staples
Market Weight: Information Technology (UP), Health Care (DOWN),
Telecom Services, Utilities
Under Weight: Consumer Discretionary (DOWN), Materials (DOWN),
Energy, Industrials
Chart 1: TSX composite index price and earnings outlook
11,900
12,300
740
765
4,000
5,000
6,000
7,000
8,000
9,000
10,000
11,000
12,000
13,000
02 03 04 05 06 07 08
200
400
600
800
1000
ML forecastIndex C$
TSX Composite (LHS)
Trailing 12-months EPS (RHS)
Source: Haver Analytics, Merrill Lynch, blue line and bar denote TSX index price history and forecast, red denotes earnings
Investment Strategy
Investment Strategy | Canada
19 October 2006
David D. Wolf +1 416 369 8764
Economist & Strategist
Merrill Lynch (Canada)
d_wolf@ml.com
Kevin Cheng +1 416 369-8741
Economist & Strategist
Merrill Lynch (Canada)
kevin_cheng@ml.com
Table of Contents
Feature article: Staying defensive ....Pg.2
Cross country comparisons.................Pg.6
Equity sector scorecard update...........Pg.7
Consumer Discretionary.................... Pg.8
Consumer Staples.............................. Pg.9
Energy...............................................Pg.10
Financials..........................................Pg.11
Health Care.......................................Pg.12
Industrials..........................................Pg.13
Information Technology.....................Pg.14
Materials............................................Pg.15
Telecom Services..............................Pg.16
Utilities...............................................Pg.17
Canadian Equity Strategy
19 October 2006
2
Staying defensive
Over the past six months, our Canadian equity strategy recommendations have
revolved around two key themes – caution on the overall market following the
impressive gains of recent years, as global liquidity ebbs and risk appetites
normalize, and a preference for sectors more exposed to solid domestic
economic conditions (financials, consumer staples) than to softening US and
global conditions (energy, materials). The result has been a conservative set of
equity market projections (11,900 on the TSX Composite at end-2006, 12,300 at
end-2007) and a defensive profile of sector recommendations. Markets have
increasingly been inclined the same way of late – as Charts 2 and 3 show, the
TSX Composite eked out a meager 1.3% gain in the third quarter, with energy
and materials both in the red after leading the index to the upside through the first
half of the year (and, indeed, further back than that).
We reaffirm our conservative outlook and defensive positioning in this edition of
the Canadian Equity Strategy Quarterly.
Among our greatest concerns for the Canadian market is that analysts’ earnings
expectations have not kept pace with the deterioration in the macro outlook in
recent months. The bottom-up consensus has TSX Composite EPS at C$852 in
2007, essentially unchanged from three months ago, and implying still-robust
13% earnings growth next year. However, corporate profits on a national
accounts basis – which tend to lead reported company profits – have already
started to erode. That measure of profits fell 3.3% through the first half of 2006,
the first two-quarter decline since mid-2003 (see Chart 4). Looking ahead, we
expect slowing economic growth – both domestic and global – to further weigh on
growth in Canadian companies’ earnings ahead. As we highlighted in our feature
global macro piece Global slowdown, local strength: Sources of demand in 2007
(published September 14), we expect that world real GDP growth will slip from an
estimated 5.2% in 2006 to a four-year low of 4.4% in 2007, led by a housing and
consumer-led deceleration in the US economy. That softer global demand growth
is likely to compromise producers’ pricing power globally, particularly in the
commodity space so important to the Canadian market.
Chart 4: Corporate profits decline in H1
-15
-10
-5
0
5
10
15
02 03 04 05 06
Corporate profits before tax es (q/q%)
Source: Haver Analytics, Merrill Lynch
Chart 2: H1 TSX sector performance (%)
-15 -10 -5 0 5 10 15 20
Infotech
Utilities
Cons. Staples
Telecom Serv .
Health Care
Financials
Cons. Discr.
S&P TSX
Industrials
Energy
Materials
Source: Haver Analytics, Merrill Lynch
Chart 3: Q3 TSX sector performance (%)
-15 -10 -5 0 5 10 15 20 25 30
Health Care
Energy
Industrials
Materials
S&P TSX
Cons. Discr.
Cons. Staples
Utilities
Financials
Infotech
Telecom Serv .
Source: Haver Analytics, Merrill Lynch
Canadian Equity Strategy
19 October 2006
3
We expect that Canada’s economy overall will remain fairly resilient to US and
global slowdown, but real GDP growth is still forecast to decline from 2.9% in
2006 to 2.3% in 2007 as exports feel further pressure. That domestic slowdown
should add to lower energy prices in taking down domestic pricing power as well,
even as labour cost growth remains elevated in response to an unemployment
rate hovering near three-decade lows.
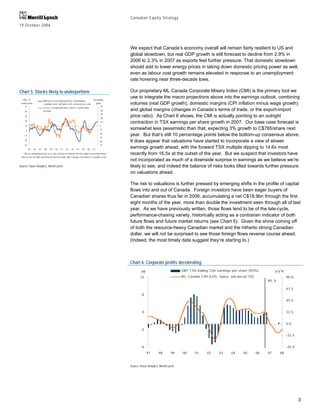
Our proprietary ML Canada Corporate Misery Index (CMI) is the primary tool we
use to integrate the macro projections above into the earnings outlook, combining
volumes (real GDP growth), domestic margins (CPI inflation minus wage growth)
and global margins (changes in Canada’s terms of trade, or the export-import
price ratio). As Chart 6 shows, the CMI is actually pointing to an outright
contraction in TSX earnings per share growth in 2007. Our base case forecast is
somewhat less pessimistic than that, expecting 3% growth to C$765/share next
year. But that’s still 10 percentage points below the bottom-up consensus above.
It does appear that valuations have started to incorporate a view of slower
earnings growth ahead, with the forward TSX multiple dipping to 14.6x most
recently from 16.5x at the outset of the year. But we suspect that investors have
not incorporated as much of a downside surprise in earnings as we believe we’re
likely to see, and indeed the balance of risks looks tilted towards further pressure
on valuations ahead.
The risk to valuations is further pressed by emerging shifts in the profile of capital
flows into and out of Canada. Foreign investors have been eager buyers of
Canadian shares thus far in 2006, accumulating a net C$18.9bn through the first
eight months of the year, more than double the investment seen through all of last
year. As we have previously written, those flows tend to be of the late-cycle,
performance-chasing variety, historically acting as a contrarian indicator of both
future flows and future market returns (see Chart 5). Given the shine coming off
of both the resource-heavy Canadian market and the hitherto strong Canadian
dollar, we will not be surprised to see those foreign flows reverse course ahead.
(Indeed, the most timely data suggest they’re starting to.)
Chart 6: Corporate profits decelerating
-4
0
4
8
12
97 98 99 00 01 02 03 04 05 06 07 08
-45.0
-22.5
0.0
22.5
45.0
67.5
90.0
S&P TSX trailing 12m earnings per share (RHS)
ML Canada CMI (LHS, 4qma, adv anced 1Q)
pp y /y %
ML fc
Source: Haver Analytics, Merrill Lynch
Chart 5: Stocks likely to underperform
-45
-30
-15
0
15
30
45
60
75
95 96 97 98 99 00 01 02 03 04 05 06 07
-75
-60
-45
-30
-15
0
15
30
45
60
75
Difference in net foreign purchases of outstanding*
Canadian stocks and bonds (LHS, adv anced one y ear)
Ex cess 12-month total return, stocks v s bonds (RHS,
inv erted)
C$bn, 12-
month period
percentage
points
* - We use outstanding issues as a 'core' measure to eliminate the intra-capital account transactions
that can toss the data around but do not necessarily reflect changes in positions in Canadian assets
Source: Haver Analytics, Merrill Lynch
Canadian Equity Strategy
19 October 2006
4
Arguably more important, however, is the behaviour of Canadian investors. In
our judgment, the strength of the Canadian dollar and the outperformance of
Canadian markets has ‘ring-fenced’ the preponderance of Canada’s deepening
capital pool into domestic markets in recent years – adding to foreign inflows to
leave too much money chasing a limited pool of domestic assets, inevitably
bidding up the valuations on those assets. But this appears to have left Canadian
investors overly concentrated in domestic assets, particularly relative to the
elimination of foreign content restrictions on Canadian retirement funds, the
increasing lack of breadth in the domestic market, and the decline in home bias
worldwide over the past several years. The portfolio flow data is indeed showing
that the ring-fence is starting to sprout holes – Canadian net purchases of foreign
stocks totaled C$23.9bn through the first eight months of 2006, up from C$16.1bn
through the same period of 2005, and C$4.6bn in 2004 (see Chart 7). We expect
those outflows to accelerate further ahead, compounding the risk to historically
high valuations on Canadian stocks, and indeed investments more broadly (see
Chart 8).
From a sectoral perspective, we expect the 43% of the TSX accounted for by
commodity producers (energy and materials) to provide the greatest restraint on
the market’s price and earnings performances ahead. We reaffirm our
underweight recommendation on the energy sector, and with this publication take
our materials recommendation from neutral to underweight as well. The story, we
think, is one of simple demand and supply. We expect industrial demand for
commodities to soften as global growth slows. We expect financial demand for
commodities (and the underlying company shares) to ebb as well, as the
optimistic extrapolative expectations built up in recent years (reflected in still-
buoyant valuations, and in our colleague Rich Bernstein’s measurement of a
profound speculative premium in commodity markets, as per Chart 9) run head-
long into more subdued actual returns. On the supply side, we are seeing the
inevitable gradual ramping up of capacity as producers respond to the now three-
year-old price signal, and inventories (particularly of energy) are already at
elevated levels. Furthermore, US production appears to have escaped the bulk of
the hurricane season surprisingly unscathed, and geopolitical supply-related
concerns appear to have ebbed somewhat. It’s been a great run for commodity
prices and shares, and while we remain of the view that we are in the midst of a
secular uptrend in both, the cyclical headwinds look to be increasingly taking
over.
Finally, with our downgrade of the materials sector here, we close our
recommendation of a rotation within the resource space from energy to materials,
first initiated on December 16 of last year. Our argument had been that macro
demand/supply factors implied metals stocks in particular had a lot of catch-up to
do given relative performance through 2004/2005. Materials have outperformed
energy by an aggregate 2570 bps in the 10 months since, essentially eliminating
the gap (see Chart 10). Our inclination at this point would, in fact, be to go the
other way. We have an unpleasant feeling that the huge foreign takeovers of
Inco and Falconbridge may ultimately mark the peak of the cycle just as the Time
Warner’s purchase of AOL in the spring of 2000 did the same for the tech boom.
Our primary overweight recommendation remains the financials sector, which
makes up more than half of the non-resource market capitalization of the TSX.
We want defense and exposure to domestic conditions; financials are the only
area of any size in the domestic market that offers both. For greater detail on our
views here, please see our recent feature piece co-written with ML Canada
Chart 7: Ring-fence breaking
-10
0
10
20
30
40
50
60
70
80
90 91 92 93 94 95 96 97 98 99 00 01 02 03 04 05 06
Net Canadian purchases of foreign stocks (12 month mov ing sum)
Net Canadian purchases of foreign bonds (12 month mov ing sum)
C$bn
Source: Haver Analytics, Merrill Lynch
Chart 8: Canada premium at risk
0.6
0.7
0.8
0.9
1.0
1.1
1.2
1.3
95 96 97 98 99 00 01 02 03 04 05 06
Equity v aluations (FY1P/E), ratio of Canada TSX to US S&P 500
Bond v aluations (reciprocal of 10-y r y ield), ratio of Canada to US
Currency v aluations, ratio of CAD/USD rate to estimated PPP
Source: Haver Analytics, Merrill Lynch
Chart 9: Speculative premium in commodities
looks elevated
-30%
-20%
-10%
0%
10%
20%
30%
40%
50%
60%
70%
93 94 95 96 97 98 99 00 01 02 03 04 05 06
12-month performance spread betw een basket of
listed and non-listed commodities (%)
Source: Bloomberg, Merrill Lynch
Chart 10: Materials outperformance closes gap
0.50
0.75
1.00
1.25
1.50
1.75
2.00
99 00 01 02 03 04 05 06
Ratio of TSX GICS Sector Index es: Energy to Materials
Source: Haver Analytics, Merrill Lynch
Canadian Equity Strategy
19 October 2006
5
financials analyst Andre Hardy entitled Canadian financials: relative risk profile
attractive, published September 20. In brief, the defensive nature of the sector in
Canada is well known, and clearly shown in Chart 11, which demonstrates that
the six largest banks and the six largest non-bank financials have each
outperformed through the down-quarters experienced by the TSX over the past
five years. And financials’ heavy exposure to domestic conditions is a relative
plus given our view of a solid Canadian housing market, a resilient Canadian
consumer and a broadly friendly underlying Canadian monetary environment.
That last element, proxied by narrow money supply growth, has in fact shown a
remarkable correlation to financial stocks’ performance over the past 20 or so
years (see Chart 12). And narrow money is currently accelerating in Canada,
with gross M1 growth rising in each of the past four months to a 27-month high of
13.4% y/y in August. The BoC’s current clear holding pattern, and our base case
forecast of 50 bps in rate cuts in 2007, implies that the domestic environment
should remain favourable. Finally, we remain of the view that Canadian financials
will outperform their US counterparts ahead, as the emerging contrast in domestic
conditions in the two countries (particularly with respect to housing and the
consumer) becomes more distinct ahead.
The remaining 25% of the TSX accounted for by the smallish other seven GICS
sectors have been increasingly influenced more by idiosyncratic factors than
macro forces – notably up in the case of infotech (on mergers) and telecoms (on
trust conversions), and down in the case of health care (on Biovail’s issues). We
have made a few changes in our recommended weightings in these sectors (see
Table 1) – up on infotech (to neutral), down on consumer discretionary (to
underweight) and health care (to neutral). But in the spectrum of the TSX, these
are tweaks. The big call, as usual in Canada, is in the relative performance of the
commodity stocks vs the financials. And we continue to make that call in
aggressively favouring the latter.
Table 2: Ratings, Merrill Lynch & Consensus
Merrill Lynch (%) Consensus (%)
Ratings (weighted, sectors): Buy Hold Sell Buy Hold Sell
Consumer Staples 31 31 38 21 74 5
Consumer Discretionary 23 77 0 51 49 0
Energy 24 75 1 62 38 0
Financials 31 69 0 31 69 0
Health Care 34 66 0 10 90 0
Industrials 10 88 2 77 23 0
Information Technology 57 41 2 66 34 0
Materials 62 38 0 72 28 0
Telecom Services 59 41 0 59 41 0
Utilities** 0 0 0 15 85 0
ML Universe 33 65 2 49 51 0
Source: * Includes only stocks covered by ML fundamental research, excludes income trusts
** Not covered by ML fundamental research Source: CMPS, Merrill Lynch
Chart 11: Financials outperform in down markets
Median price performance during negativ e TSX quarters since 2000 (%)
-12 -10 -8 -6 -4 -2 0 2 4 6 8 10 12 14
S&P TSX
TD
SLF
IAG
GWO
CM
BNS
MFC
NA
BMO
RY
POW
PWF
Source: Haver Analytics, Merrill Lynch
Table 1: ML Recommendations
Sector Recommendation Q3 Change
Financials Overweight
Cons. Staples Overweight
Health Care Neutral Downgrade
Infotech Neutral Upgrade
Utilities Neutral
Telecom Serv. Neutral
Materials Underweight Downgrade
Cons. Discr. Underweight Downgrade
Energy Underweight
Industrials Underweight
Source: Merrill Lynch
Chart 12: M1 growth solid proxy for financials
-5
0
5
10
15
20
25
30
89 91 93 95 97 99 01 03 05
-60
-30
0
30
60
90
120
Canada gross M1 (LHS)
TSX composite financials index (RHS)
y /y % y /y %
Source: Haver Analytics, Merrill Lynch
Canadian Equity Strategy
19 October 2006
6
Cross-Country Comparisons: P/E Ratios vs. Canada
Canada’s total market P/E continued to decline against other major indices as
concerns over the slowing global economy and commodity prices increased. In
Q3; the 5% gain in the US S&P 500 caused the TSX to trade at a moderate
discount for the first time in nine months. Compared to the European indices, the
TSX lost significant ground against the German index, while the Canada/UK ratio
also ebbed slightly. Against the Asian indices, Canada also fared poorly as China
and Japan experienced robust multiple expansion. Meanwhile, Canada remained
fairly flat against Australia as both countries have seen forward multiples
compress due to continued downward pressure on commodity prices.
Chart 13: Canada / Australia 12-mth fwd PE
0.6
0.7
0.8
0.9
1.0
1.1
1.2
1.3
1.4
1.5
1.6
Jul-96 Jul-98 Jul-00 Jul-02 Jul-04 Jul-06
CAN/AUS
Source: Factset, Merrill Lynch
Chart 14: Canada / US 12-mth fwd PE
0.6
0.7
0.8
0.9
1.0
1.1
1.2
Jul-96 Jul-98 Jul-00 Jul-02 Jul-04 Jul-06
CAN/US
Source: Factset, Merrill Lynch
Chart 15: Canada / UK 12-mth fwd PE
0.4
0.6
0.8
1.0
1.2
1.4
Jul-96 Jul-98 Jul-00 Jul-02 Jul-04 Jul-06
CAN/UK
Source: Factset, Merrill Lynch
Chart 16: Canada / Japan 12-mth fwd PE
0.2
0.4
0.6
0.8
1.0
1.2
Jul-96 Jul-98 Jul-00 Jul-02 Jul-04 Jul-06
CAN/JP
Source: Factset, Merrill Lynch
Chart 17: Canada / Germany 12-mth fwd PE
0.6
0.7
0.8
0.9
1.0
1.1
1.2
1.3
Jul-96 Jul-98 Jul-00 Jul-02 Jul-04 Jul-06
CAN/GER
Source: Factset, Merrill Lynch
Chart 18: Canada / China 12-mth fwd PE
0.0
0.5
1.0
1.5
2.0
2.5
3.0
Jul-96 Jul-98 Jul-00 Jul-02 Jul-04 Jul-06
CAN/CHN
Source: Factset, Merrill Lynch
Canadian Equity Strategy
19 October 2006
7
Equity sector scorecard update
Our quantitative equity sector scorecard has been updated, reflecting updated
consensus and ML fundamental analysts’ recommendations and price action
data.
In Q3, the overall profile of our equity scorecard showed a distinct thematic shift,
as defensive sectors generally rose steadily in rankings while cyclically sensitive
sectors mostly declined. Leading the way in improvement was the utilities sector,
climbing five spots to third place overall, while financials jumped three spots to
finish second to health care. By contrast, the materials and consumer
discretionary sectors plummeted in the scorecard rankings, dropping four spots
each. This contributed to our decision to downgrade both sectors to underweight
from their previous neutral ratings. The other downgrade we made in Q3 was to
the health care sector, as the increased volatility risk combined with an
unfavourable risk-reward profile now warrants a neutral rating, in our view.
Meanwhile, we upgraded the infotech sector’s rating to neutral despite the
sector’s drop to eighth overall in our scorecard (tied with energy). We believe that
the ATI/AMD merger and continued bullishness on RIM will be enough to support
prices over the near term. However, we would advise cautious selection of
companies within this sector due to the ongoing options dating issue.
Some other highlights from our scorecard that are worth specific mention are in
the energy and materials sectors. Firstly, the energy sector ended the quarter
down 10% and is now in the red on a year-to-date basis (-3%). The sharp price
decline combined with still-elevated earnings estimates led the sector to jump to
fourth place on the valuation metric. However, continued weakness in the
contrarian and momentum metrics coupled with the sharp divide in our
fundamental analysts’ views vs. the market caused this sector to perform poorly
in our scorecard rankings. In our view, we believe that there is too much optimism
built into commodity prices and earnings estimates and we see increasing
downside risk to those expectations. Meanwhile, valuations in materials also
plunged in Q3, as forward multiples hit a 15-month low on a historic basis and
against the overall index. Despite the positive valuation ranking, materials fell to
fifth as the three other metrics showed poor to neutral performances. In addition,
we see the near-term cyclical trends within the resource sectors outweighing the
more positive longer-term secular trends. We anticipate that the combination of a
slowing global economy and cyclical negativity has set the stage for both sectors
to underperform over the near term. The commodity bull market over the last four
years has been a great one, but we see it looking increasingly past its prime.
Table 3: Equity Sector Scorecard Summary
Valuation Momentum Contrarian ML vs. cons. Total Score Rank *
Health Care 1 10 1 1 2.8 1
Financials 6 2 4 2 3.6 2
Utilities 9 4 2 3 4.8 3
Consumer Staples 3 8 3 6 4.9 4
Materials 2 6 9 5 5.1 5
Telecom Services 10 1 6 4 5.6 6
Consumer Discretionary 8 5 5 7 6.5 7
Information Technology 7 3 10 8 7.1 8
Energy 4 9 7 9 7.1 9
Industrials 5 7 8 10 7.5 10
Source: ML, *lower numbers are better (number rank is out of 10 sectors). ** bold denotes ML overweight sector recommendation
Canadian Equity Strategy
19 October 2006
8
Consumer Discretionary
Recommendation: Underweight
Chart 19: Consumer Discretionary
1000
1050
1100
1150
1200
1250
Mar-05 Jun-05 Sep-05 Dec-05 Mar-06 Jun-06 Sep-06
Source: Datastream, Bloomberg, Merrill Lynch
Table 5: Scorecard
Criteria Rank Impact Summary
Valuation 8 Negative Valuations still trade at a premium on a near-term basis and against its US
counterpart. Our primary concern for the sector is its exposure to US
consumer demand.
Momentum 5 Neutral Momentum in Q3 was fairly flat but the sector still managed to modestly
outpace the TSX with a 2.5% gain. Sector performance was mediocre in all
three momentum metrics.
Contrarian 5 Neutral Consensus EPS growth expectations are relatively modest while the
majority of recommendations among fundamental analysts remains neutral.
ML vs. Cons 7 Neutral The ML fundamental team is more bearish on this sector, while consensus
remains broadly neutral.
Overall Rank 7
Overview
We downgraded this sector to underweight from neutral due to concerns over high valuations, exposure to the
US consumer and the ML fundamental view. We expect the Canadian consumer to remain resilient but advise
caution towards companies with high leverage to the US consumer and/or housing market.
Conclusion
We downgrade our rating from neutral to underweight in this sector against the index.
Source: Datastream, Bloomberg, Merrill Lynch
Table 4: Vital Stats
# of companies: 29
Mkt cap, % of TSX: 6.0
Index Price: 1054
'06 performance: 4.7
1-yr performance 5.0
52-week High: 1231
52-week Low: 1049
Beta vs. TSX: 0.66
Forward PE: 18.3
Source: Factset, Bloomberg, Merrill Lynch
Chart 20: FY1 PE* Consumer Discr.
10
12
14
16
18
20
22
24
26
95 96 97 98 99 00 01 02 03 04 05 06
COND
Source: Factset, Merrill Lynch
Chart 21: FY1 PE* vs. SP 500 Cons. Discr.
0.3
0.4
0.5
0.6
0.7
0.8
0.9
1.0
1.1
1.2
1.3
95 96 97 98 99 00 01 02 03 04 05 06
COND
Source: Factset, Merrill Lynch
Chart 22: FY1 PE* vs. FY1 TSX PE.
0.6
0.7
0.8
0.9
1.0
1.1
1.2
1.3
1.4
1.5
95 96 97 98 99 00 01 02 03 04 05 06
COND
Source: Factset, Merrill Lynch
Canadian Equity Strategy
19 October 2006
9
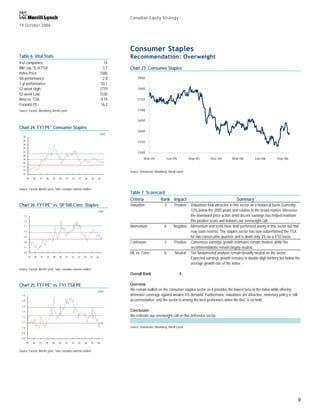
Consumer Staples
Recommendation: Overweight
Chart 23: Consumer Staples
1500
1550
1600
1650
1700
1750
1800
1850
Mar-05 Jun-05 Sep-05 Dec-05 Mar-06 Jun-06 Sep-06
Source: Datastream, Bloomberg, Merrill Lynch
Table 7: Scorecard
Criteria Rank Impact Summary
Valuation 3 Positive Valuations look attractive in this sector on a historical basis (currently
13% below the 2005 peak) and relative to the broad market. Moreover,
the downward price action amid decent earnings has helped maintain
this positive score and bolsters our overweight call.
Momentum 8 Negative Momentum and trend have both performed poorly in this sector but that
may soon reverse. The staples sector has now outperformed the TSX
for two consecutive quarters and is down only 3% on a YTD basis.
Contrarian 3 Positive Consensus earnings growth estimates remain modest, while the
recommendations remain largely neutral.
ML vs. Cons 6 Neutral Our fundamental analysts remain broadly neutral on the sector.
Expected earnings growth remains in double-digit territory but below the
average growth rate of the index.
Overall Rank 4
Overview
We remain bullish on the consumer staples sector as it provides the lowest beta to the index while offering
defensive coverage against weaker US demand. Furthermore, valuations are attractive, monetary policy is still
accommodative, and the sector is among the best performers when the BoC is on hold.
Conclusion
We reiterate our overweight call on this defensive sector.
Source: Datastream, Bloomberg, Merrill Lynch
Table 6: Vital Stats
# of companies: 14
Mkt cap, % of TSX: 3.7
Index Price: 1586
'06 performance: -2.8
1-yr performance -10.1
52-week High: 1779
52-week Low: 1530
Beta vs. TSX: 0.19
Forward PE: 16.2
Source: Factset, Bloomberg, Merrill Lynch
Chart 24: FY1 PE* Consumer Staples
10
12
14
16
18
20
22
24
26
28
30
95 96 97 98 99 00 01 02 03 04 05 06
CONS
Source: Factset, Merrill Lynch, *note: excludes extreme outliers
Chart 25: FY1 PE* vs. FY1 TSX PE
0.8
0.9
1.0
1.1
1.2
1.3
1.4
1.5
1.6
95 96 97 98 99 00 01 02 03 04 05 06
CONS
Source: Factset, Merrill Lynch, *note: excludes extreme outliers
Chart 26: FY1 PE* vs. SP 500 Cons. Staples
0.6
0.7
0.8
0.9
1.0
1.1
1.2
1.3
95 96 97 98 99 00 01 02 03 04 05 06
CONS
Source: Factset, Merrill Lynch, *note: excludes extreme outliers
Canadian Equity Strategy
19 October 2006
10
Energy
Recommendation: Underweight
Chart 27: Energy
2000
2200
2400
2600
2800
3000
3200
3400
3600
Mar-05 Jun-05 Sep-05 Dec-05 Mar-06 Jun-06 Sep-06
Source: Datastream, Bloomberg, Merrill Lynch
Table 9: Scorecard
Criteria Rank Impact Summary
Valuation 4 Neutral Multiples and prices have declined sharply as energy prices have
plummeted. The forward multiple for the sector is at a 17 month low, but
remains expensive compared to the US and the 5-year average discount to
the overall index.
Momentum 9 Negative With crude prices touching negative year-over-year growth in Q3, the energy
sector declined 10% and fell 3% into the red on a YTD basis.
Contrarian 7 Neutral Consensus earnings growth estimates remain stubbornly high despite the
volatility in crude prices and the expected US and global slowdown.
ML vs. Cons 9 Negative The ML fundamental view remains very bearish relative to consensus
estimates. The divergence in views remains the largest within the index as
our analysts expect energy earnings growth to be 14 ppts below consensus
estimates.
Overall Rank 9
Overview
Cost concerns threaten to derail some of the oil sands projects while rising crude inventory and the expected
US slowdown continue to put downward pressure on crude prices. We believe that the market has too much
optimism embedded into prices and earnings; we reiterate our bearish view on the resource sectors.
Conclusion
We reiterate our underweight call in this sector against the index.
Source: Datastream, Bloomberg, Merrill Lynch
Table 8: Vital Stats
# of companies: 76
Mkt cap, % of TSX: 29.7
Index Price: 2652
'06 performance: -3.4
1-yr performance -5.7
52-week High: 3550
52-week Low: 2679
Beta vs. TSX: 1.60
Forward PE: 13.9
Source: Factset, Bloomberg, Merrill Lynch
Chart 28: FY1 PE* Energy
5
10
15
20
25
30
95 96 97 98 99 00 01 02 03 04 05 06
ENRS
Source: Factset, Merrill Lynch, *note: excludes extreme outliers
Chart 29: FY1 PE* vs. FY1 TSX PE
0.5
0.7
0.9
1.1
1.3
1.5
1.7
95 96 97 98 99 00 01 02 03 04 05 06
ENRS
Source: Factset, Merrill Lynch, *note: excludes extreme outliers
Chart 30: FY1 PE* vs. SP 500 Energy
0.5
0.7
0.9
1.1
1.3
1.5
1.7
95 96 97 98 99 00 01 02 03 04 05 06
ENRS
Source: Factset, Merrill Lynch, *note: excludes extreme outliers
Canadian Equity Strategy
19 October 2006
11
Financials
Recommendation: Overweight
Chart 31: Financials
1400
1450
1500
1550
1600
1650
1700
1750
1800
1850
Mar-05 Jun-05 Sep-05 Dec-05 Mar-06 Jun-06 Sep-06
Source: Datastream, Bloomberg, Merrill Lynch
Table 11: Scorecard
Criteria Rank Impact Summary
Valuation 6 Neutral Recent concerns over the slowing global economy have caused some
defensive sector rotation towards financials, which drove valuations
higher in Q3. The sector has risen 9% since Q2, but still looks attractive
when compared to the broad market.
Momentum 2 Positive The trend remains positive over the longer term while momentum has
picked up in the short term. Outside of telecom services, financials
scored the best on a relative strength basis.
Contrarian 4 Neutral Consensus earnings growth estimates, which are modestly below the
index average, keep this sector neutral from a contrarian perspective.
ML vs. Cons 2 Positive The ML analysts' earnings estimates remain in line with the consensus
estimates, while our proportions of buys are also in line with the Street's
recommendations. The ML fundamental team is more bullish on the
insurance sector versus the banks.
Overall Rank 2
Overview
We reiterate our overweight call on the financials sector as it boasts solid fundamentals. A stable Canadian
housing market, modest job growth, robust money supply growth and a resilient Canadian consumer should
help support earnings growth and reduce loan loss risk. The financials sector remains the primary defensive
sector in Canada and is among the best performing sectors when the BoC is on hold.
Conclusion
We reiterate our overweight in the financial sector against the index.
Source: Datastream, Bloomberg, Merrill Lynch
Table 10: Vital Stats
# of companies: 39
Mkt cap, % of TSX: 31.9
Index Price: 1601
'06 performance: 6.3
1-yr performance 13.9
52-week High: 1807
52-week Low: 1513
Beta vs. TSX: 0.59
Forward PE: 14.7
Source: Factset, Bloomberg, Merrill Lynch
Chart 32: FY1 PE* Financials
5
7
9
11
13
15
17
19
95 96 97 98 99 00 01 02 03 04 05 06
FINL
Source: Factset, Merrill Lynch, *note: excludes extreme outliers
Chart 33: FY1 PE* vs. FY1 TSX PE
0.6
0.7
0.8
0.9
1.0
1.1
95 96 97 98 99 00 01 02 03 04 05 06
FINL
Source: Factset, Merrill Lynch, *note: excludes extreme outliers
Chart 34: FY1 PE* vs. SP 500 Financials
0.6
0.7
0.8
0.9
1.0
1.1
1.2
95 96 97 98 99 00 01 02 03 04 05 06
FINL
Source: Factset, Merrill Lynch, *note: excludes extreme outliers
Canadian Equity Strategy
19 October 2006
12
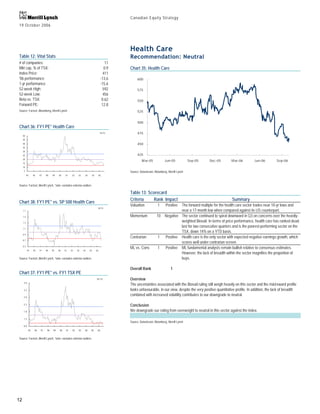
Health Care
Recommendation: Neutral
Chart 35: Health Care
425
450
475
500
525
550
575
600
Mar-05 Jun-05 Sep-05 Dec-05 Mar-06 Jun-06 Sep-06
Source: Datastream, Bloomberg, Merrill Lynch
Table 13: Scorecard
Criteria Rank Impact Summary
Valuation 1 Positive The forward multiple for the health care sector trades near 10-yr lows and
near a 17-month low when compared against its US counterpart.
Momentum 10 Negative The sector continued to spiral downward in Q3 on concerns over the heavily-
weighted Biovail. In terms of price performance, health care has ranked dead-
last for two consecutive quarters and is the poorest-performing sector on the
TSX, down 14% on a YTD basis.
Contrarian 1 Positive Health care is the only sector with expected negative earnings growth, which
scores well under contrarian screen.
ML vs. Cons 1 Positive ML fundamental analysts remain bullish relative to consensus estimates.
However, the lack of breadth within the sector magnifies the proportion of
buys.
Overall Rank 1
Overview
The uncertainties associated with the Biovail ruling still weigh heavily on this sector and the risk/reward profile
looks unfavourable, in our view, despite the very positive quantitative profile. In addition, the lack of breadth
combined with increased volatility contributes to our downgrade to neutral.
Conclusion
We downgrade our rating from overweight to neutral in this sector against the index.
Source: Datastream, Bloomberg, Merrill Lynch
Table 12: Vital Stats
# of companies: 11
Mkt cap, % of TSX: 0.9
Index Price: 411
'06 performance: -13.6
1-yr performance -15.6
52-week High: 592
52-week Low: 456
Beta vs. TSX: 0.62
Forward PE: 12.8
Source: Factset, Bloomberg, Merrill Lynch
Chart 36: FY1 PE* Health Care
5
10
15
20
25
30
35
40
45
50
95 96 97 98 99 00 01 02 03 04 05 06
HLTH
Source: Factset, Merrill Lynch, *note: excludes extreme outliers
Chart 37: FY1 PE* vs. FY1 TSX PE
0.8
1.3
1.8
2.3
2.8
3.3
3.8
95 96 97 98 99 00 01 02 03 04 05 06
HLTH
Source: Factset, Merrill Lynch, *note: excludes extreme outliers
Chart 38: FY1 PE* vs. SP 500 Health Care
0.5
0.7
0.9
1.1
1.3
1.5
1.7
95 96 97 98 99 00 01 02 03 04 05 06
HLTH
Source: Factset, Merrill Lynch, *note: excludes extreme outliers
Canadian Equity Strategy
19 October 2006
13
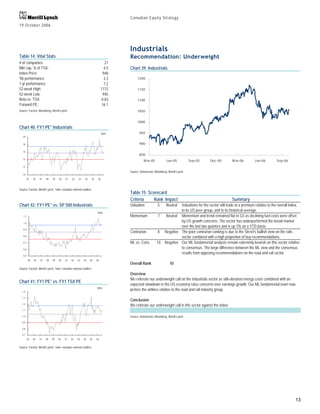
Industrials
Recommendation: Underweight
Chart 39: Industrials
850
900
950
1000
1050
1100
1150
1200
Mar-05 Jun-05 Sep-05 Dec-05 Mar-06 Jun-06 Sep-06
Source: Datastream, Bloomberg, Merrill Lynch
Table 15: Scorecard
Criteria Rank Impact Summary
Valuation 5 Neutral Valuations for the sector still trade at a premium relative to the overall index,
to its US peer group, and to its historical average.
Momentum 7 Neutral Momentum and trend remained flat in Q3 as declining fuel costs were offset
by US growth concerns. The sector has underperformed the broad market
over the last two quarters and is up 3% on a YTD basis.
Contrarian 8 Negative The poor contrarian ranking is due to the Street's bullish view on the rails
sector combined with a high proportion of buy recommendations.
ML vs. Cons 10 Negative Our ML fundamental analysts remain extremely bearish on this sector relative
to consensus. The large difference between the ML view and the consensus
results from opposing recommendations on the road and rail sector.
Overall Rank 10
Overview
We reiterate our underweight call on the industrials sector as still-elevated energy costs combined with an
expected slowdown in the US economy raise concerns over earnings growth. Our ML fundamental team now
prefers the airlines relative to the road and rail industry group.
Conclusion
We reiterate our underweight call in this sector against the index.
Source: Datastream, Bloomberg, Merrill Lynch
Table 14: Vital Stats
# of companies: 21
Mkt cap, % of TSX: 4.5
Index Price: 948
'06 performance: 3.3
1-yr performance 7.2
52-week High: 1172
52-week Low: 945
Beta vs. TSX: 0.83
Forward PE: 16.1
Source: Factset, Bloomberg, Merrill Lynch
Chart 40: FY1 PE* Industrials
10
12
14
16
18
20
95 96 97 98 99 00 01 02 03 04 05 06
INDU
Source: Factset, Merrill Lynch, *note: excludes extreme outliers
Chart 41: FY1 PE* vs. FY1 TSX PE
0.7
0.8
0.9
1.0
1.1
1.2
1.3
1.4
95 96 97 98 99 00 01 02 03 04 05 06
INDU
Source: Factset, Merrill Lynch, *note: excludes extreme outliers
Chart 42: FY1 PE* vs. SP 500 Industrials
0.5
0.6
0.7
0.8
0.9
1.0
1.1
95 96 97 98 99 00 01 02 03 04 05 06
INDU
Source: Factset, Merrill Lynch, *note: excludes extreme outliers
Canadian Equity Strategy
19 October 2006
14
Information Technology
Recommendation: Neutral
Chart 43: Information Technology
150
175
200
225
250
Mar-05 Jun-05 Sep-05 Dec-05 Mar-06 Jun-06 Sep-06
Source: Datastream, Bloomberg, Merrill Lynch
Table 17: Scorecard
Criteria Rank Impact Summary
Valuation 7 Neutral Valuations have increased markedly for this sector on news of the ATI/AMD
merger and the performance of RIM.
Momentum 3 Positive After lagging through the first half of the year, Q3 saw tech rebound sharply
(+23%) and it is now in the black (+7%) on a YTD basis.
Contrarian 10 Negative Earnings growth expectations that are three times higher than the index
average cause tech to rank last in the contrarian screen.
ML vs. Cons 8 Negative The ML fundamental team is marginally more bearish on earnings growth and
has a lower proportion of buy recommendations than consensus.
Overall Rank 8
Overview
We upgrade info tech as the consumer release of Pearl from RIM and the ATI/AMD merger are expected to
provide further solid price support for the sector. However, we would advise caution within this sector as the
ongoing option dating scandal, expensive valuations and lofty earnings growth expectations could subject
investors to high volatility.
Conclusion
We upgrade our rating from underweight to neutral in this sector against the index.
Source: Datastream, Bloomberg, Merrill Lynch
Table 16: Vital Stats
# of companies: 11
Mkt cap, % of TSX: 3.7
Index Price: 200
'06 performance: 6.9
1-yr performance 5.1
52-week High: 233
52-week Low: 170
Beta vs. TSX: 0.70
Forward PE: 21.2
Source: Factset, Bloomberg, Merrill Lynch
Chart 44: FY1 PE* Info Tech
5
10
15
20
25
30
95 96 97 98 99 00 01 02 03 04 05 06
INFT
Source: Factset, Merrill Lynch, *note: excludes extreme outliers
Chart 45: FY1 PE* vs. FY1 TSX PE
0.5
0.7
0.9
1.1
1.3
1.5
1.7
1.9
2.1
2.3
95 96 97 98 99 00 01 02 03 04 05 06
INFT
Source: Factset, Merrill Lynch, *note: excludes extreme outliers
Chart 46: FY1 PE* vs. SP 500 Info Tech
0.2
0.7
1.2
1.7
2.2
2.7
95 96 97 98 99 00 01 02 03 04 05 06
INFT
Source: Factset, Merrill Lynch, *note: excludes extreme outliers
Canadian Equity Strategy
19 October 2006
15
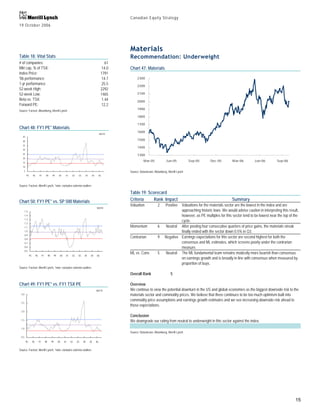
Materials
Recommendation: Underweight
Chart 47: Materials
1300
1400
1500
1600
1700
1800
1900
2000
2100
2200
2300
Mar-05 Jun-05 Sep-05 Dec-05 Mar-06 Jun-06 Sep-06
Source: Datastream, Bloomberg, Merrill Lynch
Table 19: Scorecard
Criteria Rank Impact Summary
Valuation 2 Positive Valuations for the materials sector are the lowest in the index and are
approaching historic lows. We would advise caution in interpreting this result,
however, as PE multiples for this sector tend to be lowest near the top of the
cycle.
Momentum 6 Neutral After posting four consecutive quarters of price gains, the materials streak
finally ended with the sector down 0.5% in Q3.
Contrarian 9 Negative Earnings expectations for this sector are second highest for both the
consensus and ML estimates, which screens poorly under the contrarian
measure.
ML vs. Cons 5 Neutral The ML fundamental team remains modestly more bearish than consensus
on earnings growth and is broadly in line with consensus when measured by
proportion of buys.
Overall Rank 5
Overview
We continue to view the potential downturn in the US and global economies as the biggest downside risk to the
materials sector and commodity prices. We believe that there continues to be too much optimism built into
commodity price assumptions and earnings growth estimates and we see increasing downside risk ahead to
those expectations.
Conclusion
We downgrade our rating from neutral to underweight in this sector against the index.
Source: Datastream, Bloomberg, Merrill Lynch
Table 18: Vital Stats
# of companies: 61
Mkt cap, % of TSX: 14.0
Index Price: 1791
'06 performance: 14.7
1-yr performance 25.5
52-week High: 2292
52-week Low: 1465
Beta vs. TSX: 1.44
Forward PE: 12.2
Source: Factset, Bloomberg, Merrill Lynch
Chart 48: FY1 PE* Materials
5
10
15
20
25
30
35
40
45
95 96 97 98 99 00 01 02 03 04 05 06
MATR
Source: Factset, Merrill Lynch, *note: excludes extreme outliers
Chart 49: FY1 PE* vs. FY1 TSX PE
0.5
1.0
1.5
2.0
2.5
3.0
95 96 97 98 99 00 01 02 03 04 05 06
MATR
Source: Factset, Merrill Lynch, *note: excludes extreme outliers
Chart 50: FY1 PE* vs. SP 500 Materials
0.5
0.6
0.7
0.8
0.9
1.0
1.1
1.2
1.3
1.4
1.5
95 96 97 98 99 00 01 02 03 04 05 06
MATR
Source: Factset, Merrill Lynch, *note: excludes extreme outliers
Canadian Equity Strategy
19 October 2006
16
Telecom Services
Recommendation: Neutral
Chart 51: Telecom Services
675
700
725
750
775
800
825
850
875
900
Mar-05 Jun-05 Sep-05 Dec-05 Mar-06 Jun-06 Sep-06
Source: Datastream, Bloomberg, Merrill Lynch
Table 21: Scorecard
Criteria Rank Impact Summary
Valuation 10 Negative Valuations have sky-rocketed to a 5-year high due to the Telus and
BCE trust conversion announcements.
Momentum 1 Positive Momentum and trend have soared along with valuations. Telcos
returned an impressive 24% in Q3 and overtook the materials sector
as the best performing sector on a YTD basis.
Contrarian 6 Neutral Consensus EPS growth estimates rank fifth overall, which places
telecom services squarely in the middle of the field.
ML vs. Cons 4 Neutral Our fundamental team remains in line with the consensus view and
expects earnings growth to broadly match the overall index.
Overall Rank 6
Overview
Despite the defensive qualities that the sector offers, such as solid earnings, high dividends and low beta, we
would be inclined not to chase performance at this point. We believe that the momentum built in Q3 should
provide solid support for prices, but we don't see much potential upside remaining. Furthermore, the sector's
lack of breadth discounts it from being a truly defensive sector.
Conclusion
We reiterate our neutral weight in this sector against the index.
Source: Datastream, Bloomberg, Merrill Lynch
Table 20: Vital Stats
# of companies: 6
Mkt cap, % of TSX: 4.1
Index Price: 780
'06 performance: 18.7
1-yr performance 10.3
52-week High: 878
52-week Low: 686
Beta vs. TSX: 0.54
Forward PE: 26.5
Source: Factset, Bloomberg, Merrill Lynch
Chart 52: FY1 PE* Telecom Services
0
10
20
30
40
50
60
70
95 96 97 98 99 00 01 02 03 04 05 06
TELS
Source: Factset, Merrill Lynch, *note: excludes extreme outliers
Chart 53: FY1 PE* vs. FY1 TSX PE
0.0
0.5
1.0
1.5
2.0
2.5
3.0
3.5
4.0
4.5
5.0
95 96 97 98 99 00 01 02 03 04 05 06
TELS
Source: Factset, Merrill Lynch, *note: excludes extreme outliers
Chart 54: FY1 PE* vs. SP 500 Telecom Services
0.2
0.4
0.6
0.8
1.0
1.2
1.4
1.6
1.8
2.0
2.2
95 96 97 98 99 00 01 02 03 04 05 06
TELS
Source: Factset, Merrill Lynch, *note: excludes extreme outliers
Canadian Equity Strategy
19 October 2006
17
Utilities
Recommendation: Neutral
Chart 55: Utilities
1300
1400
1500
1600
1700
1800
1900
Mar-05 Jun-05 Sep-05 Dec-05 Mar-06 Jun-06 Sep-06
Source: Datastream, Bloomberg, Merrill Lynch
Table 23: Scorecard
Criteria Rank Impact Summary
Valuation 9 Negative Investor concerns over slowing global growth drove bond yields lower and
utility valuations to near record highs.
Momentum 4 Neutral Momentum for the sector continued to build in Q3 as utilities managed to
outperform the TSX for the second consecutive quarter. The sector is still
performing poorly on a YTD basis though, down 6%.
Contrarian 2 Positive Sluggish expected earnings growth combined with neutral
recommendations bode well under the contrarian ranking.
ML vs. Cons 3 Positive We used consensus estimates to determine this result as ML does not
cover the Canadian sector.
Overall Rank 3
Overview
A flight to quality was the theme in Q3 as investors grew worried over slowing global growth. Valuations for the
utility sector currently trade at a significant premium to the index (third most expensive) and are nearing record
highs. Although we like the utility sector's low beta and high dividend qualities, we believe that there are more
attractive opportunities in financials and income trusts. The financials sector, for example, offers more breadth,
comparable dividend ratios, higher earnings growth and trades at a lower multiple.
Conclusion
We reiterate our neutral rating for utilities and prefer financials to this sector.
Source: Datastream, Bloomberg, Merrill Lynch
Table 22: Vital Stats
# of companies: 11
Mkt cap, % of TSX: 1.5
Index Price: 1538
'06 performance: -5.6
1-yr performance -1.3
52-week High: 1865
52-week Low: 1572
Beta vs. TSX: 0.54
Forward PE: 18.7
Source: Factset, Bloomberg, Merrill Lynch
Chart 56: FY1 PE* Utilities
9
11
13
15
17
19
21
95 96 97 98 99 00 01 02 03 04 05 06
UTIL
Source: Factset, Merrill Lynch, *note: excludes extreme outliers
Chart 57: FY1 PE* vs. FY1 TSX PE
0.7
0.8
0.9
1.0
1.1
1.2
1.3
1.4
95 96 97 98 99 00 01 02 03 04 05 06
UTIL
Source: Factset, Merrill Lynch, *note: excludes extreme outliers
Chart 58: FY1 PE* vs. SP 500 Utilities
0.7
0.9
1.1
1.3
1.5
1.7
1.9
2.1
95 96 97 98 99 00 01 02 03 04 05 06
UTIL
Source: Factset, Merrill Lynch, *note: excludes extreme outliers
Canadian Equity Strategy
19 October 2006
18
Important Disclosures
Investment Rating Distribution: Global Group (as of 30 Sep 2006)
Coverage Universe Count Percent Inv. Banking Relationships* Count Percent
Buy 1325 44.76% Buy 434 32.75%
Neutral 1420 47.97% Neutral 412 29.01%
Sell 215 7.26% Sell 48 22.33%
* Companies in respect of which MLPF&S or an affiliate has received compensation for investment banking services within the past 12 months.
FUNDAMENTAL EQUITY OPINION KEY: Opinions include a Volatility Risk Rating, an Investment Rating and an Income Rating. VOLATILITY RISK
RATINGS, indicators of potential price fluctuation, are: A - Low, B - Medium, and C - High. INVESTMENT RATINGS, indicators of expected total return
(price appreciation plus yield) within the 12-month period from the date of the initial rating, are: 1 - Buy (10% or more for Low and Medium Volatility Risk
Securities - 20% or more for High Volatility Risk securities); 2 - Neutral (0-10% for Low and Medium Volatility Risk securities - 0-20% for High Volatility
Risk securities); 3 - Sell (negative return); and 6 - No Rating. INCOME RATINGS, indicators of potential cash dividends, are: 7 - same/higher (dividend
considered to be secure); 8 - same/lower (dividend not considered to be secure); and 9 - pays no cash dividend.
Due to the nature of strategic analysis, the issuers or securities recommended or discussed in this report are not continuously followed. Accordingly, investors
must regard this report as providing stand-alone analysis and should not expect continuing analysis or additional reports relating to such issuers and/or securities.
The analyst(s) responsible for covering the securities in this report receive compensation based upon, among other factors, the overall profitability of Merrill
Lynch, including profits derived from investment banking revenues.
Canadian Equity Strategy
19 October 2006
19
Other Important Disclosures
UK readers: MLPF&S or an affiliate is a liquidity provider for the securities discussed in this report.
Information relating to Non-U.S. affiliates of Merrill Lynch, Pierce, Fenner & Smith Incorporated (MLPF&S):
MLPF&S distributes research reports of the following non-US affiliates in the US (short name: legal name): Merrill Lynch (France): Merrill Lynch Capital Markets
(France) SAS; Merrill Lynch (Frankfurt Branch): Merrill Lynch International Bank Ltd, Frankfurt Branch; Merrill Lynch (South Africa): Merrill Lynch South Africa (Pty)
Ltd; Merrill Lynch (Milan): Merrill Lynch International Bank Limited; MLPF&S (UK): Merrill Lynch, Pierce, Fenner & Smith Limited; Merrill Lynch (Australia): Merrill
Lynch Equities (Australia) Limited; Merrill Lynch (Hong Kong): Merrill Lynch (Asia Pacific) Limited; Merrill Lynch (Singapore): Merrill Lynch (Singapore) Pte Ltd;
Merrill Lynch (Canada): Merrill Lynch Canada Inc; Merrill Lynch (Mexico): Merrill Lynch Mexico, SA de CV, Casa de Bolsa; Merrill Lynch (Argentina): Merrill Lynch
Argentina SA; Merrill Lynch (Brazil): Banco Merrill Lynch de Investimentos SA; Merrill Lynch (Japan): Merrill Lynch Japan Securities Co, Ltd; Merrill Lynch (Seoul):
Merrill Lynch International Incorporated (Seoul Branch); Merrill Lynch (Taiwan): Merrill Lynch Global (Taiwan) Limited; DSP Merrill Lynch (India): DSP Merrill Lynch
Limited; PT Merrill Lynch (Indonesia): PT Merrill Lynch Indonesia; Merrill Lynch (KL) Sdn. Bhd.: Merrill Lynch (Malaysia); Merrill Lynch (Israel): Merrill Lynch Israel
Limited; Merrill Lynch (Russia): Merrill Lynch CIS Limited, Moscow.
This research report has been prepared and issued by MLPF&S and/or one or more of its non-U.S. affiliates. MLPF&S is the distributor of this research report in
the U.S. and accepts full responsibility for research reports of its non-U.S. affiliates distributed in the U.S. Any U.S. person receiving this research report and wishing
to effect any transaction in any security discussed in the report should do so through MLPF&S and not such foreign affiliates.
This research report has been approved for publication in the United Kingdom by Merrill Lynch, Pierce, Fenner & Smith Limited, which is authorized and
regulated by the Financial Services Authority; has been considered and distributed in Japan by Merrill Lynch Japan Securities Co, Ltd, a registered securities dealer
under the Securities and Exchange Law in Japan; is distributed in Hong Kong by Merrill Lynch (Asia Pacific) Limited, which is regulated by the Hong Kong SFC; is
issued and distributed in Taiwan by Merrill Lynch (Taiwan) Ltd or Merrill Lynch, Pierce, Fenner & Smith Limited (Taiwan Branch); is issued and distributed in
Malaysia by Merrill Lynch (KL) Sdn. Bhd., a licensed investment adviser regulated by the Malaysian Securities Commission; and is issued and distributed in
Singapore by Merrill Lynch International Bank Limited (Merchant Bank) and Merrill Lynch (Singapore) Pte Ltd (Company Registration No.’s F 06872E and
198602883D respectively). Merrill Lynch International Bank Limited (Merchant Bank) and Merrill Lynch (Singapore) Pte Ltd. are regulated by the Monetary Authority
of Singapore. Merrill Lynch Equities (Australia) Limited, (ABN 65 006 276 795), AFS License 235132, provides this report in Australia. No approval is required for
publication or distribution of this report in Brazil.
Merrill Lynch Dublin is regulated by BaFin.
Copyright, User Agreement and other general information related to this report:
Copyright 2006 Merrill Lynch, Pierce, Fenner & Smith Incorporated. All rights reserved. This research report is prepared for the use of Merrill Lynch clients and
may not be redistributed, retransmitted or disclosed, in whole or in part, or in any form or manner, without the express written consent of Merrill Lynch. Merrill Lynch
research reports are distributed simultaneously to internal and client websites eligible to receive such research prior to any public dissemination by Merrill Lynch of
the research report or information or opinion contained therein. Any unauthorized use or disclosure is prohibited. Receipt and review of this research report
constitutes your agreement not to redistribute, retransmit, or disclose to others the contents, opinions, conclusion, or information contained in this report (including
any investment recommendations, estimates or price targets) prior to Merrill Lynch's public disclosure of such information. The information herein (other than
disclosure information relating to Merrill Lynch and its affiliates) was obtained from various sources and we do not guarantee its accuracy. Merrill Lynch makes no
representations or warranties whatsoever as to the data and information provided in any third party referenced website and shall have no liability or responsibility
arising out of or in connection with any such referenced website.
This research report provides general information only. Neither the information nor any opinion expressed constitutes an offer or an invitation to make an offer,
to buy or sell any securities or other investment or any options, futures or derivatives related to such securities or investments. It is not intended to provide personal
investment advice and it does not take into account the specific investment objectives, financial situation and the particular needs of any specific person who may
receive this report. Investors should seek financial advice regarding the appropriateness of investing in any securities, other investment or investment strategies
discussed or recommended in this report and should understand that statements regarding future prospects may not be realized. Investors should note that income
from such securities or other investments, if any, may fluctuate and that price or value of such securities and investments may rise or fall. Accordingly, investors may
receive back less than originally invested. Past performance is not necessarily a guide to future performance. Any information relating to the tax status of financial
instruments discussed herein is not intended to provide tax advice or to be used by anyone to provide tax advice. Investors are urged to seek tax advice based on
their particular circumstances from an independent tax professional.
Foreign currency rates of exchange may adversely affect the value, price or income of any security or related investment mentioned in this report. In addition,
investors in securities such as ADRs, whose values are influenced by the currency of the underlying security, effectively assume currency risk.
Officers of MLPF&S or one or more of its affiliates (other than research analysts) may have a financial interest in securities of the issuer(s) or in related
investments.
Merrill Lynch Research policies relating to conflicts of interest are described at http://www.ml.com/media/43347.pdf.
Fundamental equity reports are produced on a regular basis as necessary to keep the investment recommendation current.

More Related Content

What's hot

Capital Markets Industry Insights - Q1 2016
Capital Markets Industry Insights - Q1 2016Capital Markets Industry Insights - Q1 2016
Capital Markets Industry Insights - Q1 2016
Duff & Phelps
 
EY Analyst themes of quarterly oil & gas earnings: 3Q18
EY Analyst themes of quarterly oil & gas earnings: 3Q18EY Analyst themes of quarterly oil & gas earnings: 3Q18
EY Analyst themes of quarterly oil & gas earnings: 3Q18
EY
 
Capital Markets Insights - Spring 2017
Capital Markets Insights - Spring 2017Capital Markets Insights - Spring 2017
Capital Markets Insights - Spring 2017
Duff & Phelps
 
Newsletter 08302016 Final Volume 2 Issue 6
Newsletter 08302016 Final Volume 2 Issue 6Newsletter 08302016 Final Volume 2 Issue 6
Newsletter 08302016 Final Volume 2 Issue 6Jonathan M. Lamb
 
AZTLAN Investment Outlook 2019
AZTLAN Investment Outlook 2019AZTLAN Investment Outlook 2019
AZTLAN Investment Outlook 2019
Alejandro H. Garza Salazar
 
Starkstes IPO-Jahr seit Jahrtausendwende
Starkstes IPO-Jahr seit JahrtausendwendeStarkstes IPO-Jahr seit Jahrtausendwende
Starkstes IPO-Jahr seit Jahrtausendwende
EY
 
BoyarMiller Breakfast Forum: The Energy Industry 2016 – Looking Forward
BoyarMiller Breakfast Forum: The Energy Industry 2016 – Looking ForwardBoyarMiller Breakfast Forum: The Energy Industry 2016 – Looking Forward
BoyarMiller Breakfast Forum: The Energy Industry 2016 – Looking Forward
BoyarMiller
 
Capital Markets Insights - Q2 2016
Capital Markets Insights - Q2 2016Capital Markets Insights - Q2 2016
Capital Markets Insights - Q2 2016
Duff & Phelps
 
Special report-03-dec-2018-epic-research
Special report-03-dec-2018-epic-researchSpecial report-03-dec-2018-epic-research
Special report-03-dec-2018-epic-research
Epic Research Limited
 
The Arabian Markets - Neverland
The Arabian Markets - Neverland The Arabian Markets - Neverland
The Arabian Markets - Neverland
Tarek Fadlallah
 
C&W-Marketbeat-U.S.Shopping Center-Q3-2018 #CRE #REALESTATE #RETAIL
C&W-Marketbeat-U.S.Shopping Center-Q3-2018 #CRE #REALESTATE #RETAILC&W-Marketbeat-U.S.Shopping Center-Q3-2018 #CRE #REALESTATE #RETAIL
C&W-Marketbeat-U.S.Shopping Center-Q3-2018 #CRE #REALESTATE #RETAIL
Guy Masse
 
Before the Open May 12 2017
Before the Open May 12 2017Before the Open May 12 2017
Before the Open May 12 2017
John Pendrith
 
C&W MARKETBEAT- CAPITAL MARKETS Q4 2016 – #CRE #REALESTATE #CCIM #SIOR @YOURT...
C&W MARKETBEAT- CAPITAL MARKETS Q4 2016 – #CRE #REALESTATE #CCIM #SIOR @YOURT...C&W MARKETBEAT- CAPITAL MARKETS Q4 2016 – #CRE #REALESTATE #CCIM #SIOR @YOURT...
C&W MARKETBEAT- CAPITAL MARKETS Q4 2016 – #CRE #REALESTATE #CCIM #SIOR @YOURT...
Guy Masse
 
Accenture Spend Trends Report Q1 2015
Accenture Spend Trends Report Q1 2015Accenture Spend Trends Report Q1 2015
Accenture Spend Trends Report Q1 2015
Accenture Operations
 
Trump100 days- Implications for the Property Markets
Trump100 days-  Implications for the Property Markets Trump100 days-  Implications for the Property Markets
Trump100 days- Implications for the Property Markets
Guy Masse
 
IRR_2016_Annual_Viewpoint
IRR_2016_Annual_ViewpointIRR_2016_Annual_Viewpoint
IRR_2016_Annual_ViewpointJames Goodard
 
IRR_2016_Annual_Viewpoint
IRR_2016_Annual_ViewpointIRR_2016_Annual_Viewpoint
IRR_2016_Annual_ViewpointCourtney Bergk
 
Capital Markets Industry Insights - Fall 2016
Capital Markets Industry Insights - Fall 2016Capital Markets Industry Insights - Fall 2016
Capital Markets Industry Insights - Fall 2016
Duff & Phelps
 
Sprung investment management commentary 3rd quarter, 2014
Sprung investment management commentary   3rd quarter, 2014Sprung investment management commentary   3rd quarter, 2014
Sprung investment management commentary 3rd quarter, 2014
Robert Champion
 
C&W-Marketbeat-U.S. Industrial-Q3-2018 #CRE #REALESTATE
C&W-Marketbeat-U.S. Industrial-Q3-2018 #CRE #REALESTATEC&W-Marketbeat-U.S. Industrial-Q3-2018 #CRE #REALESTATE
C&W-Marketbeat-U.S. Industrial-Q3-2018 #CRE #REALESTATE
Guy Masse
 

What's hot (20)

Capital Markets Industry Insights - Q1 2016
Capital Markets Industry Insights - Q1 2016Capital Markets Industry Insights - Q1 2016
Capital Markets Industry Insights - Q1 2016
 
EY Analyst themes of quarterly oil & gas earnings: 3Q18
EY Analyst themes of quarterly oil & gas earnings: 3Q18EY Analyst themes of quarterly oil & gas earnings: 3Q18
EY Analyst themes of quarterly oil & gas earnings: 3Q18
 
Capital Markets Insights - Spring 2017
Capital Markets Insights - Spring 2017Capital Markets Insights - Spring 2017
Capital Markets Insights - Spring 2017
 
Newsletter 08302016 Final Volume 2 Issue 6
Newsletter 08302016 Final Volume 2 Issue 6Newsletter 08302016 Final Volume 2 Issue 6
Newsletter 08302016 Final Volume 2 Issue 6
 
AZTLAN Investment Outlook 2019
AZTLAN Investment Outlook 2019AZTLAN Investment Outlook 2019
AZTLAN Investment Outlook 2019
 
Starkstes IPO-Jahr seit Jahrtausendwende
Starkstes IPO-Jahr seit JahrtausendwendeStarkstes IPO-Jahr seit Jahrtausendwende
Starkstes IPO-Jahr seit Jahrtausendwende
 
BoyarMiller Breakfast Forum: The Energy Industry 2016 – Looking Forward
BoyarMiller Breakfast Forum: The Energy Industry 2016 – Looking ForwardBoyarMiller Breakfast Forum: The Energy Industry 2016 – Looking Forward
BoyarMiller Breakfast Forum: The Energy Industry 2016 – Looking Forward
 
Capital Markets Insights - Q2 2016
Capital Markets Insights - Q2 2016Capital Markets Insights - Q2 2016
Capital Markets Insights - Q2 2016
 
Special report-03-dec-2018-epic-research
Special report-03-dec-2018-epic-researchSpecial report-03-dec-2018-epic-research
Special report-03-dec-2018-epic-research
 
The Arabian Markets - Neverland
The Arabian Markets - Neverland The Arabian Markets - Neverland
The Arabian Markets - Neverland
 
C&W-Marketbeat-U.S.Shopping Center-Q3-2018 #CRE #REALESTATE #RETAIL
C&W-Marketbeat-U.S.Shopping Center-Q3-2018 #CRE #REALESTATE #RETAILC&W-Marketbeat-U.S.Shopping Center-Q3-2018 #CRE #REALESTATE #RETAIL
C&W-Marketbeat-U.S.Shopping Center-Q3-2018 #CRE #REALESTATE #RETAIL
 
Before the Open May 12 2017
Before the Open May 12 2017Before the Open May 12 2017
Before the Open May 12 2017
 
C&W MARKETBEAT- CAPITAL MARKETS Q4 2016 – #CRE #REALESTATE #CCIM #SIOR @YOURT...
C&W MARKETBEAT- CAPITAL MARKETS Q4 2016 – #CRE #REALESTATE #CCIM #SIOR @YOURT...C&W MARKETBEAT- CAPITAL MARKETS Q4 2016 – #CRE #REALESTATE #CCIM #SIOR @YOURT...
C&W MARKETBEAT- CAPITAL MARKETS Q4 2016 – #CRE #REALESTATE #CCIM #SIOR @YOURT...
 
Accenture Spend Trends Report Q1 2015
Accenture Spend Trends Report Q1 2015Accenture Spend Trends Report Q1 2015
Accenture Spend Trends Report Q1 2015
 
Trump100 days- Implications for the Property Markets
Trump100 days-  Implications for the Property Markets Trump100 days-  Implications for the Property Markets
Trump100 days- Implications for the Property Markets
 
IRR_2016_Annual_Viewpoint
IRR_2016_Annual_ViewpointIRR_2016_Annual_Viewpoint
IRR_2016_Annual_Viewpoint
 
IRR_2016_Annual_Viewpoint
IRR_2016_Annual_ViewpointIRR_2016_Annual_Viewpoint
IRR_2016_Annual_Viewpoint
 
Capital Markets Industry Insights - Fall 2016
Capital Markets Industry Insights - Fall 2016Capital Markets Industry Insights - Fall 2016
Capital Markets Industry Insights - Fall 2016
 
Sprung investment management commentary 3rd quarter, 2014
Sprung investment management commentary   3rd quarter, 2014Sprung investment management commentary   3rd quarter, 2014
Sprung investment management commentary 3rd quarter, 2014
 
C&W-Marketbeat-U.S. Industrial-Q3-2018 #CRE #REALESTATE
C&W-Marketbeat-U.S. Industrial-Q3-2018 #CRE #REALESTATEC&W-Marketbeat-U.S. Industrial-Q3-2018 #CRE #REALESTATE
C&W-Marketbeat-U.S. Industrial-Q3-2018 #CRE #REALESTATE
 

Similar to Equity Strategy - Staying Defensive

Equity Strategy - Consumer Staples
Equity Strategy - Consumer StaplesEquity Strategy - Consumer Staples
Equity Strategy - Consumer Staples
Kevin Cheng, CFA
 
Agf market outlook
Agf market outlookAgf market outlook
Agf market outlook
Kevin Cheng, CFA
 
LBS Asset Allocation August Update - July 28, 2017
LBS Asset Allocation August Update - July 28, 2017LBS Asset Allocation August Update - July 28, 2017
LBS Asset Allocation August Update - July 28, 2017
Mark MacIsaac
 
Finlight Research - Market Perspectives - Jan 2016
Finlight Research - Market Perspectives - Jan 2016Finlight Research - Market Perspectives - Jan 2016
Finlight Research - Market Perspectives - Jan 2016
FinLight Research
 
BMO-TCH-Mid-Q3-Update_FINAL
BMO-TCH-Mid-Q3-Update_FINALBMO-TCH-Mid-Q3-Update_FINAL
BMO-TCH-Mid-Q3-Update_FINALAdam Phillips
 
January 2010 atm
January 2010 atmJanuary 2010 atm
January 2010 atmGreg Meier
 
4th Quarter 2017 Market Update
4th Quarter 2017 Market Update4th Quarter 2017 Market Update
4th Quarter 2017 Market Update
Sarah Cuddy
 
Outlook For Commodities
Outlook For CommoditiesOutlook For Commodities
Outlook For Commodities
RusNewton
 
Global Insight
Global Insight Global Insight
Global Insight
David Apted
 
2009 - August (Autumn)
2009 - August (Autumn)2009 - August (Autumn)
2009 - August (Autumn)Greg Meier
 
U.S. Real Rates
U.S. Real RatesU.S. Real Rates
U.S. Real Rates
Kevin Cheng, CFA
 
2016 ETF and investment outlook
2016 ETF and investment outlook2016 ETF and investment outlook
2016 ETF and investment outlook
Ying wei (Joe) Chou
 
Avant garde wealth mgmt - Quarterly letter - 1306
Avant garde wealth mgmt - Quarterly letter - 1306Avant garde wealth mgmt - Quarterly letter - 1306
Avant garde wealth mgmt - Quarterly letter - 1306
Gaurav Jalan
 
LBS - Asset Allocation Model – February Update
LBS - Asset Allocation Model – February UpdateLBS - Asset Allocation Model – February Update
LBS - Asset Allocation Model – February Update
Mark MacIsaac
 
U_S_PORTFOLIO_STRATEGY_W_102803589
U_S_PORTFOLIO_STRATEGY_W_102803589U_S_PORTFOLIO_STRATEGY_W_102803589
U_S_PORTFOLIO_STRATEGY_W_102803589Barry Knapp
 
Invbots training materials 20210104 - Macro Strategy
Invbots training materials 20210104 - Macro StrategyInvbots training materials 20210104 - Macro Strategy
Invbots training materials 20210104 - Macro Strategy
Invbots Limited
 
Q1 2016-credit third avenue
Q1 2016-credit third avenueQ1 2016-credit third avenue
Q1 2016-credit third avenue
Frank Ragol
 
Laurentian Bank Securities - Economic Research and Strategy
Laurentian Bank Securities - Economic Research and Strategy Laurentian Bank Securities - Economic Research and Strategy
Laurentian Bank Securities - Economic Research and Strategy
Mark MacIsaac
 
Monthly highlights
Monthly highlightsMonthly highlights
Monthly highlights
Bennett Gordon Cfa Cfp
 
Spring '18 Portfolio Performance
Spring '18 Portfolio PerformanceSpring '18 Portfolio Performance
Spring '18 Portfolio Performance
Mike Roma
 

Similar to Equity Strategy - Staying Defensive (20)

Equity Strategy - Consumer Staples
Equity Strategy - Consumer StaplesEquity Strategy - Consumer Staples
Equity Strategy - Consumer Staples
 
Agf market outlook
Agf market outlookAgf market outlook
Agf market outlook
 
LBS Asset Allocation August Update - July 28, 2017
LBS Asset Allocation August Update - July 28, 2017LBS Asset Allocation August Update - July 28, 2017
LBS Asset Allocation August Update - July 28, 2017
 
Finlight Research - Market Perspectives - Jan 2016
Finlight Research - Market Perspectives - Jan 2016Finlight Research - Market Perspectives - Jan 2016
Finlight Research - Market Perspectives - Jan 2016
 
BMO-TCH-Mid-Q3-Update_FINAL
BMO-TCH-Mid-Q3-Update_FINALBMO-TCH-Mid-Q3-Update_FINAL
BMO-TCH-Mid-Q3-Update_FINAL
 
January 2010 atm
January 2010 atmJanuary 2010 atm
January 2010 atm
 
4th Quarter 2017 Market Update
4th Quarter 2017 Market Update4th Quarter 2017 Market Update
4th Quarter 2017 Market Update
 
Outlook For Commodities
Outlook For CommoditiesOutlook For Commodities
Outlook For Commodities
 
Global Insight
Global Insight Global Insight
Global Insight
 
2009 - August (Autumn)
2009 - August (Autumn)2009 - August (Autumn)
2009 - August (Autumn)
 
U.S. Real Rates
U.S. Real RatesU.S. Real Rates
U.S. Real Rates
 
2016 ETF and investment outlook
2016 ETF and investment outlook2016 ETF and investment outlook
2016 ETF and investment outlook
 
Avant garde wealth mgmt - Quarterly letter - 1306
Avant garde wealth mgmt - Quarterly letter - 1306Avant garde wealth mgmt - Quarterly letter - 1306
Avant garde wealth mgmt - Quarterly letter - 1306
 
LBS - Asset Allocation Model – February Update
LBS - Asset Allocation Model – February UpdateLBS - Asset Allocation Model – February Update
LBS - Asset Allocation Model – February Update
 
U_S_PORTFOLIO_STRATEGY_W_102803589
U_S_PORTFOLIO_STRATEGY_W_102803589U_S_PORTFOLIO_STRATEGY_W_102803589
U_S_PORTFOLIO_STRATEGY_W_102803589
 
Invbots training materials 20210104 - Macro Strategy
Invbots training materials 20210104 - Macro StrategyInvbots training materials 20210104 - Macro Strategy
Invbots training materials 20210104 - Macro Strategy
 
Q1 2016-credit third avenue
Q1 2016-credit third avenueQ1 2016-credit third avenue
Q1 2016-credit third avenue
 
Laurentian Bank Securities - Economic Research and Strategy
Laurentian Bank Securities - Economic Research and Strategy Laurentian Bank Securities - Economic Research and Strategy
Laurentian Bank Securities - Economic Research and Strategy
 
Monthly highlights
Monthly highlightsMonthly highlights
Monthly highlights
 
Spring '18 Portfolio Performance
Spring '18 Portfolio PerformanceSpring '18 Portfolio Performance
Spring '18 Portfolio Performance
 

More from Kevin Cheng, CFA

Brookfield Office Properties - BPO - Quarterly Earnings
Brookfield Office Properties - BPO - Quarterly EarningsBrookfield Office Properties - BPO - Quarterly Earnings
Brookfield Office Properties - BPO - Quarterly Earnings
Kevin Cheng, CFA
 
First Capital Realty - FCR
First Capital Realty - FCRFirst Capital Realty - FCR
First Capital Realty - FCR
Kevin Cheng, CFA
 
Equity Strategy - TSX
Equity Strategy - TSXEquity Strategy - TSX
Equity Strategy - TSX
Kevin Cheng, CFA
 
Focus - Economic Research
Focus - Economic ResearchFocus - Economic Research
Focus - Economic Research
Kevin Cheng, CFA
 
DEA Initiation Report
DEA Initiation ReportDEA Initiation Report
DEA Initiation Report
Kevin Cheng, CFA
 
CXP initiation - Office REIT
CXP initiation - Office REITCXP initiation - Office REIT
CXP initiation - Office REIT
Kevin Cheng, CFA
 
Canadian Asset Managers - Initiation Report
Canadian Asset Managers - Initiation ReportCanadian Asset Managers - Initiation Report
Canadian Asset Managers - Initiation Report
Kevin Cheng, CFA
 
Asset Managers - Recession risks, Trust Banks & Asset Mgrs
Asset Managers - Recession risks, Trust Banks & Asset MgrsAsset Managers - Recession risks, Trust Banks & Asset Mgrs
Asset Managers - Recession risks, Trust Banks & Asset Mgrs
Kevin Cheng, CFA
 
Asset Managers - Defensive But Not Immune
Asset Managers - Defensive But Not ImmuneAsset Managers - Defensive But Not Immune
Asset Managers - Defensive But Not Immune
Kevin Cheng, CFA
 
The deleveraging cycle
The deleveraging cycleThe deleveraging cycle
The deleveraging cycle
Kevin Cheng, CFA
 
Market Strategy
Market StrategyMarket Strategy
Market Strategy
Kevin Cheng, CFA
 

More from Kevin Cheng, CFA (11)

Brookfield Office Properties - BPO - Quarterly Earnings
Brookfield Office Properties - BPO - Quarterly EarningsBrookfield Office Properties - BPO - Quarterly Earnings
Brookfield Office Properties - BPO - Quarterly Earnings
 
First Capital Realty - FCR
First Capital Realty - FCRFirst Capital Realty - FCR
First Capital Realty - FCR
 
Equity Strategy - TSX
Equity Strategy - TSXEquity Strategy - TSX
Equity Strategy - TSX
 
Focus - Economic Research
Focus - Economic ResearchFocus - Economic Research
Focus - Economic Research
 
DEA Initiation Report
DEA Initiation ReportDEA Initiation Report
DEA Initiation Report
 
CXP initiation - Office REIT
CXP initiation - Office REITCXP initiation - Office REIT
CXP initiation - Office REIT
 
Canadian Asset Managers - Initiation Report
Canadian Asset Managers - Initiation ReportCanadian Asset Managers - Initiation Report
Canadian Asset Managers - Initiation Report
 
Asset Managers - Recession risks, Trust Banks & Asset Mgrs
Asset Managers - Recession risks, Trust Banks & Asset MgrsAsset Managers - Recession risks, Trust Banks & Asset Mgrs
Asset Managers - Recession risks, Trust Banks & Asset Mgrs
 
Asset Managers - Defensive But Not Immune
Asset Managers - Defensive But Not ImmuneAsset Managers - Defensive But Not Immune
Asset Managers - Defensive But Not Immune
 
The deleveraging cycle
The deleveraging cycleThe deleveraging cycle
The deleveraging cycle
 
Market Strategy
Market StrategyMarket Strategy
Market Strategy
 

Recently uploaded

This assessment plan proposal is to outline a structured approach to evaluati...
This assessment plan proposal is to outline a structured approach to evaluati...This assessment plan proposal is to outline a structured approach to evaluati...
This assessment plan proposal is to outline a structured approach to evaluati...
lamluanvan.net Viết thuê luận văn
 
Abhay Bhutada Leads Poonawalla Fincorp To Record Low NPA And Unprecedented Gr...
Abhay Bhutada Leads Poonawalla Fincorp To Record Low NPA And Unprecedented Gr...Abhay Bhutada Leads Poonawalla Fincorp To Record Low NPA And Unprecedented Gr...
Abhay Bhutada Leads Poonawalla Fincorp To Record Low NPA And Unprecedented Gr...
Vighnesh Shashtri
 
how to swap pi coins to foreign currency withdrawable.
how to swap pi coins to foreign currency withdrawable.how to swap pi coins to foreign currency withdrawable.
how to swap pi coins to foreign currency withdrawable.
DOT TECH
 
Analyzing the instability of equilibrium in thr harrod domar model
Analyzing the instability of equilibrium in thr harrod domar modelAnalyzing the instability of equilibrium in thr harrod domar model
Analyzing the instability of equilibrium in thr harrod domar model
ManthanBhardwaj4
 
where can I find a legit pi merchant online
where can I find a legit pi merchant onlinewhere can I find a legit pi merchant online
where can I find a legit pi merchant online
DOT TECH
 
Instant Issue Debit Cards - High School Spirit
Instant Issue Debit Cards - High School SpiritInstant Issue Debit Cards - High School Spirit
Instant Issue Debit Cards - High School Spirit
egoetzinger
 
can I really make money with pi network.
can I really make money with pi network.can I really make money with pi network.
can I really make money with pi network.
DOT TECH
 
innovative-invoice-discounting-platforms-in-india-empowering-retail-investors...
innovative-invoice-discounting-platforms-in-india-empowering-retail-investors...innovative-invoice-discounting-platforms-in-india-empowering-retail-investors...
innovative-invoice-discounting-platforms-in-india-empowering-retail-investors...
Falcon Invoice Discounting
 
Tumelo-deep-dive-into-pass-through-voting-Feb23 (1).pdf
Tumelo-deep-dive-into-pass-through-voting-Feb23 (1).pdfTumelo-deep-dive-into-pass-through-voting-Feb23 (1).pdf
Tumelo-deep-dive-into-pass-through-voting-Feb23 (1).pdf
Henry Tapper
 
US Economic Outlook - Being Decided - M Capital Group August 2021.pdf
US Economic Outlook - Being Decided - M Capital Group August 2021.pdfUS Economic Outlook - Being Decided - M Capital Group August 2021.pdf
US Economic Outlook - Being Decided - M Capital Group August 2021.pdf
pchutichetpong
 
Instant Issue Debit Cards - School Designs
Instant Issue Debit Cards - School DesignsInstant Issue Debit Cards - School Designs
Instant Issue Debit Cards - School Designs
egoetzinger
 
USDA Loans in California: A Comprehensive Overview.pptx
USDA Loans in California: A Comprehensive Overview.pptxUSDA Loans in California: A Comprehensive Overview.pptx
USDA Loans in California: A Comprehensive Overview.pptx
marketing367770
 
SWAIAP Fraud Risk Mitigation Prof Oyedokun.pptx
SWAIAP Fraud Risk Mitigation   Prof Oyedokun.pptxSWAIAP Fraud Risk Mitigation   Prof Oyedokun.pptx
SWAIAP Fraud Risk Mitigation Prof Oyedokun.pptx
Godwin Emmanuel Oyedokun MBA MSc PhD FCA FCTI FCNA CFE FFAR
 
Webinar Exploring DORA for Fintechs - Simont Braun
Webinar Exploring DORA for Fintechs - Simont BraunWebinar Exploring DORA for Fintechs - Simont Braun
Webinar Exploring DORA for Fintechs - Simont Braun
FinTech Belgium
 
一比一原版(UCSB毕业证)圣芭芭拉分校毕业证如何办理
一比一原版(UCSB毕业证)圣芭芭拉分校毕业证如何办理一比一原版(UCSB毕业证)圣芭芭拉分校毕业证如何办理
一比一原版(UCSB毕业证)圣芭芭拉分校毕业证如何办理
bbeucd
 
how to sell pi coins effectively (from 50 - 100k pi)
how to sell pi coins effectively (from 50 - 100k  pi)how to sell pi coins effectively (from 50 - 100k  pi)
how to sell pi coins effectively (from 50 - 100k pi)
DOT TECH
 
1. Elemental Economics - Introduction to mining.pdf
1. Elemental Economics - Introduction to mining.pdf1. Elemental Economics - Introduction to mining.pdf
1. Elemental Economics - Introduction to mining.pdf
Neal Brewster
 
Introduction to Value Added Tax System.ppt
Introduction to Value Added Tax System.pptIntroduction to Value Added Tax System.ppt
Introduction to Value Added Tax System.ppt
VishnuVenugopal84
 
What price will pi network be listed on exchanges
What price will pi network be listed on exchangesWhat price will pi network be listed on exchanges
What price will pi network be listed on exchanges
DOT TECH
 
一比一原版(IC毕业证)帝国理工大学毕业证如何办理
一比一原版(IC毕业证)帝国理工大学毕业证如何办理一比一原版(IC毕业证)帝国理工大学毕业证如何办理
一比一原版(IC毕业证)帝国理工大学毕业证如何办理
conose1
 

Recently uploaded (20)

This assessment plan proposal is to outline a structured approach to evaluati...
This assessment plan proposal is to outline a structured approach to evaluati...This assessment plan proposal is to outline a structured approach to evaluati...
This assessment plan proposal is to outline a structured approach to evaluati...
 
Abhay Bhutada Leads Poonawalla Fincorp To Record Low NPA And Unprecedented Gr...
Abhay Bhutada Leads Poonawalla Fincorp To Record Low NPA And Unprecedented Gr...Abhay Bhutada Leads Poonawalla Fincorp To Record Low NPA And Unprecedented Gr...
Abhay Bhutada Leads Poonawalla Fincorp To Record Low NPA And Unprecedented Gr...
 
how to swap pi coins to foreign currency withdrawable.
how to swap pi coins to foreign currency withdrawable.how to swap pi coins to foreign currency withdrawable.
how to swap pi coins to foreign currency withdrawable.
 
Analyzing the instability of equilibrium in thr harrod domar model
Analyzing the instability of equilibrium in thr harrod domar modelAnalyzing the instability of equilibrium in thr harrod domar model
Analyzing the instability of equilibrium in thr harrod domar model
 
where can I find a legit pi merchant online
where can I find a legit pi merchant onlinewhere can I find a legit pi merchant online
where can I find a legit pi merchant online
 
Instant Issue Debit Cards - High School Spirit
Instant Issue Debit Cards - High School SpiritInstant Issue Debit Cards - High School Spirit
Instant Issue Debit Cards - High School Spirit
 
can I really make money with pi network.
can I really make money with pi network.can I really make money with pi network.
can I really make money with pi network.
 
innovative-invoice-discounting-platforms-in-india-empowering-retail-investors...
innovative-invoice-discounting-platforms-in-india-empowering-retail-investors...innovative-invoice-discounting-platforms-in-india-empowering-retail-investors...
innovative-invoice-discounting-platforms-in-india-empowering-retail-investors...
 
Tumelo-deep-dive-into-pass-through-voting-Feb23 (1).pdf
Tumelo-deep-dive-into-pass-through-voting-Feb23 (1).pdfTumelo-deep-dive-into-pass-through-voting-Feb23 (1).pdf
Tumelo-deep-dive-into-pass-through-voting-Feb23 (1).pdf
 
US Economic Outlook - Being Decided - M Capital Group August 2021.pdf
US Economic Outlook - Being Decided - M Capital Group August 2021.pdfUS Economic Outlook - Being Decided - M Capital Group August 2021.pdf
US Economic Outlook - Being Decided - M Capital Group August 2021.pdf
 
Instant Issue Debit Cards - School Designs
Instant Issue Debit Cards - School DesignsInstant Issue Debit Cards - School Designs
Instant Issue Debit Cards - School Designs
 
USDA Loans in California: A Comprehensive Overview.pptx
USDA Loans in California: A Comprehensive Overview.pptxUSDA Loans in California: A Comprehensive Overview.pptx
USDA Loans in California: A Comprehensive Overview.pptx
 
SWAIAP Fraud Risk Mitigation Prof Oyedokun.pptx
SWAIAP Fraud Risk Mitigation   Prof Oyedokun.pptxSWAIAP Fraud Risk Mitigation   Prof Oyedokun.pptx
SWAIAP Fraud Risk Mitigation Prof Oyedokun.pptx
 
Webinar Exploring DORA for Fintechs - Simont Braun
Webinar Exploring DORA for Fintechs - Simont BraunWebinar Exploring DORA for Fintechs - Simont Braun
Webinar Exploring DORA for Fintechs - Simont Braun
 
一比一原版(UCSB毕业证)圣芭芭拉分校毕业证如何办理
一比一原版(UCSB毕业证)圣芭芭拉分校毕业证如何办理一比一原版(UCSB毕业证)圣芭芭拉分校毕业证如何办理
一比一原版(UCSB毕业证)圣芭芭拉分校毕业证如何办理
 
how to sell pi coins effectively (from 50 - 100k pi)
how to sell pi coins effectively (from 50 - 100k  pi)how to sell pi coins effectively (from 50 - 100k  pi)
how to sell pi coins effectively (from 50 - 100k pi)
 
1. Elemental Economics - Introduction to mining.pdf
1. Elemental Economics - Introduction to mining.pdf1. Elemental Economics - Introduction to mining.pdf
1. Elemental Economics - Introduction to mining.pdf
 
Introduction to Value Added Tax System.ppt
Introduction to Value Added Tax System.pptIntroduction to Value Added Tax System.ppt
Introduction to Value Added Tax System.ppt
 
What price will pi network be listed on exchanges
What price will pi network be listed on exchangesWhat price will pi network be listed on exchanges
What price will pi network be listed on exchanges
 
一比一原版(IC毕业证)帝国理工大学毕业证如何办理
一比一原版(IC毕业证)帝国理工大学毕业证如何办理一比一原版(IC毕业证)帝国理工大学毕业证如何办理
一比一原版(IC毕业证)帝国理工大学毕业证如何办理
 

Equity Strategy - Staying Defensive

  • 1. Merrill Lynch does and seeks to do business with companies covered in its research reports. As a result, investors should be aware that the firm may have a conflict of interest that could affect the objectivity of this report. Investors should consider this report as only a single factor in making their investment decision. Refer to important disclosures on page 18 to 19. 10555923 Canadian Equity Strategy Staying defensive Highlights Over the past six months, our Canadian equity strategy recommendations have revolved around two key themes – caution on the overall market following the impressive gains of recent years, as global liquidity ebbs and risk appetites normalize, and a preference for sectors more exposed to solid domestic economic conditions (financials, consumer staples) than to softening US and global conditions (energy, materials). We reiterate those views here. Our TSX targets remain unchanged at 11,900 at end-2006 and 12,300 at end- 2007; ditto for our earnings per share estimates of C$740 and C$765 respectively. The latter implies earnings growth of 3% in 2007, well below the prevailing bottom-up consensus at 13%. Recent price action and related developments have brought the profile of our quantitative equity sector scorecard into better alignment with our macro-driven preference for defensive positioning. The materials sector falls from 1st to 5 th in the rankings; the financials sector rises from 5th to 2 nd . Our sector recommendations (with this quarter’s changes in parentheses) are: Overweight: Financials, Consumer Staples Market Weight: Information Technology (UP), Health Care (DOWN), Telecom Services, Utilities Under Weight: Consumer Discretionary (DOWN), Materials (DOWN), Energy, Industrials Chart 1: TSX composite index price and earnings outlook 11,900 12,300 740 765 4,000 5,000 6,000 7,000 8,000 9,000 10,000 11,000 12,000 13,000 02 03 04 05 06 07 08 200 400 600 800 1000 ML forecastIndex C$ TSX Composite (LHS) Trailing 12-months EPS (RHS) Source: Haver Analytics, Merrill Lynch, blue line and bar denote TSX index price history and forecast, red denotes earnings Investment Strategy Investment Strategy | Canada 19 October 2006 David D. Wolf +1 416 369 8764 Economist & Strategist Merrill Lynch (Canada) d_wolf@ml.com Kevin Cheng +1 416 369-8741 Economist & Strategist Merrill Lynch (Canada) kevin_cheng@ml.com Table of Contents Feature article: Staying defensive ....Pg.2 Cross country comparisons.................Pg.6 Equity sector scorecard update...........Pg.7 Consumer Discretionary.................... Pg.8 Consumer Staples.............................. Pg.9 Energy...............................................Pg.10 Financials..........................................Pg.11 Health Care.......................................Pg.12 Industrials..........................................Pg.13 Information Technology.....................Pg.14 Materials............................................Pg.15 Telecom Services..............................Pg.16 Utilities...............................................Pg.17
  • 2. Canadian Equity Strategy 19 October 2006 2 Staying defensive Over the past six months, our Canadian equity strategy recommendations have revolved around two key themes – caution on the overall market following the impressive gains of recent years, as global liquidity ebbs and risk appetites normalize, and a preference for sectors more exposed to solid domestic economic conditions (financials, consumer staples) than to softening US and global conditions (energy, materials). The result has been a conservative set of equity market projections (11,900 on the TSX Composite at end-2006, 12,300 at end-2007) and a defensive profile of sector recommendations. Markets have increasingly been inclined the same way of late – as Charts 2 and 3 show, the TSX Composite eked out a meager 1.3% gain in the third quarter, with energy and materials both in the red after leading the index to the upside through the first half of the year (and, indeed, further back than that). We reaffirm our conservative outlook and defensive positioning in this edition of the Canadian Equity Strategy Quarterly. Among our greatest concerns for the Canadian market is that analysts’ earnings expectations have not kept pace with the deterioration in the macro outlook in recent months. The bottom-up consensus has TSX Composite EPS at C$852 in 2007, essentially unchanged from three months ago, and implying still-robust 13% earnings growth next year. However, corporate profits on a national accounts basis – which tend to lead reported company profits – have already started to erode. That measure of profits fell 3.3% through the first half of 2006, the first two-quarter decline since mid-2003 (see Chart 4). Looking ahead, we expect slowing economic growth – both domestic and global – to further weigh on growth in Canadian companies’ earnings ahead. As we highlighted in our feature global macro piece Global slowdown, local strength: Sources of demand in 2007 (published September 14), we expect that world real GDP growth will slip from an estimated 5.2% in 2006 to a four-year low of 4.4% in 2007, led by a housing and consumer-led deceleration in the US economy. That softer global demand growth is likely to compromise producers’ pricing power globally, particularly in the commodity space so important to the Canadian market. Chart 4: Corporate profits decline in H1 -15 -10 -5 0 5 10 15 02 03 04 05 06 Corporate profits before tax es (q/q%) Source: Haver Analytics, Merrill Lynch Chart 2: H1 TSX sector performance (%) -15 -10 -5 0 5 10 15 20 Infotech Utilities Cons. Staples Telecom Serv . Health Care Financials Cons. Discr. S&P TSX Industrials Energy Materials Source: Haver Analytics, Merrill Lynch Chart 3: Q3 TSX sector performance (%) -15 -10 -5 0 5 10 15 20 25 30 Health Care Energy Industrials Materials S&P TSX Cons. Discr. Cons. Staples Utilities Financials Infotech Telecom Serv . Source: Haver Analytics, Merrill Lynch
  • 3. Canadian Equity Strategy 19 October 2006 3 We expect that Canada’s economy overall will remain fairly resilient to US and global slowdown, but real GDP growth is still forecast to decline from 2.9% in 2006 to 2.3% in 2007 as exports feel further pressure. That domestic slowdown should add to lower energy prices in taking down domestic pricing power as well, even as labour cost growth remains elevated in response to an unemployment rate hovering near three-decade lows. Our proprietary ML Canada Corporate Misery Index (CMI) is the primary tool we use to integrate the macro projections above into the earnings outlook, combining volumes (real GDP growth), domestic margins (CPI inflation minus wage growth) and global margins (changes in Canada’s terms of trade, or the export-import price ratio). As Chart 6 shows, the CMI is actually pointing to an outright contraction in TSX earnings per share growth in 2007. Our base case forecast is somewhat less pessimistic than that, expecting 3% growth to C$765/share next year. But that’s still 10 percentage points below the bottom-up consensus above. It does appear that valuations have started to incorporate a view of slower earnings growth ahead, with the forward TSX multiple dipping to 14.6x most recently from 16.5x at the outset of the year. But we suspect that investors have not incorporated as much of a downside surprise in earnings as we believe we’re likely to see, and indeed the balance of risks looks tilted towards further pressure on valuations ahead. The risk to valuations is further pressed by emerging shifts in the profile of capital flows into and out of Canada. Foreign investors have been eager buyers of Canadian shares thus far in 2006, accumulating a net C$18.9bn through the first eight months of the year, more than double the investment seen through all of last year. As we have previously written, those flows tend to be of the late-cycle, performance-chasing variety, historically acting as a contrarian indicator of both future flows and future market returns (see Chart 5). Given the shine coming off of both the resource-heavy Canadian market and the hitherto strong Canadian dollar, we will not be surprised to see those foreign flows reverse course ahead. (Indeed, the most timely data suggest they’re starting to.) Chart 6: Corporate profits decelerating -4 0 4 8 12 97 98 99 00 01 02 03 04 05 06 07 08 -45.0 -22.5 0.0 22.5 45.0 67.5 90.0 S&P TSX trailing 12m earnings per share (RHS) ML Canada CMI (LHS, 4qma, adv anced 1Q) pp y /y % ML fc Source: Haver Analytics, Merrill Lynch Chart 5: Stocks likely to underperform -45 -30 -15 0 15 30 45 60 75 95 96 97 98 99 00 01 02 03 04 05 06 07 -75 -60 -45 -30 -15 0 15 30 45 60 75 Difference in net foreign purchases of outstanding* Canadian stocks and bonds (LHS, adv anced one y ear) Ex cess 12-month total return, stocks v s bonds (RHS, inv erted) C$bn, 12- month period percentage points * - We use outstanding issues as a 'core' measure to eliminate the intra-capital account transactions that can toss the data around but do not necessarily reflect changes in positions in Canadian assets Source: Haver Analytics, Merrill Lynch
  • 4. Canadian Equity Strategy 19 October 2006 4 Arguably more important, however, is the behaviour of Canadian investors. In our judgment, the strength of the Canadian dollar and the outperformance of Canadian markets has ‘ring-fenced’ the preponderance of Canada’s deepening capital pool into domestic markets in recent years – adding to foreign inflows to leave too much money chasing a limited pool of domestic assets, inevitably bidding up the valuations on those assets. But this appears to have left Canadian investors overly concentrated in domestic assets, particularly relative to the elimination of foreign content restrictions on Canadian retirement funds, the increasing lack of breadth in the domestic market, and the decline in home bias worldwide over the past several years. The portfolio flow data is indeed showing that the ring-fence is starting to sprout holes – Canadian net purchases of foreign stocks totaled C$23.9bn through the first eight months of 2006, up from C$16.1bn through the same period of 2005, and C$4.6bn in 2004 (see Chart 7). We expect those outflows to accelerate further ahead, compounding the risk to historically high valuations on Canadian stocks, and indeed investments more broadly (see Chart 8). From a sectoral perspective, we expect the 43% of the TSX accounted for by commodity producers (energy and materials) to provide the greatest restraint on the market’s price and earnings performances ahead. We reaffirm our underweight recommendation on the energy sector, and with this publication take our materials recommendation from neutral to underweight as well. The story, we think, is one of simple demand and supply. We expect industrial demand for commodities to soften as global growth slows. We expect financial demand for commodities (and the underlying company shares) to ebb as well, as the optimistic extrapolative expectations built up in recent years (reflected in still- buoyant valuations, and in our colleague Rich Bernstein’s measurement of a profound speculative premium in commodity markets, as per Chart 9) run head- long into more subdued actual returns. On the supply side, we are seeing the inevitable gradual ramping up of capacity as producers respond to the now three- year-old price signal, and inventories (particularly of energy) are already at elevated levels. Furthermore, US production appears to have escaped the bulk of the hurricane season surprisingly unscathed, and geopolitical supply-related concerns appear to have ebbed somewhat. It’s been a great run for commodity prices and shares, and while we remain of the view that we are in the midst of a secular uptrend in both, the cyclical headwinds look to be increasingly taking over. Finally, with our downgrade of the materials sector here, we close our recommendation of a rotation within the resource space from energy to materials, first initiated on December 16 of last year. Our argument had been that macro demand/supply factors implied metals stocks in particular had a lot of catch-up to do given relative performance through 2004/2005. Materials have outperformed energy by an aggregate 2570 bps in the 10 months since, essentially eliminating the gap (see Chart 10). Our inclination at this point would, in fact, be to go the other way. We have an unpleasant feeling that the huge foreign takeovers of Inco and Falconbridge may ultimately mark the peak of the cycle just as the Time Warner’s purchase of AOL in the spring of 2000 did the same for the tech boom. Our primary overweight recommendation remains the financials sector, which makes up more than half of the non-resource market capitalization of the TSX. We want defense and exposure to domestic conditions; financials are the only area of any size in the domestic market that offers both. For greater detail on our views here, please see our recent feature piece co-written with ML Canada Chart 7: Ring-fence breaking -10 0 10 20 30 40 50 60 70 80 90 91 92 93 94 95 96 97 98 99 00 01 02 03 04 05 06 Net Canadian purchases of foreign stocks (12 month mov ing sum) Net Canadian purchases of foreign bonds (12 month mov ing sum) C$bn Source: Haver Analytics, Merrill Lynch Chart 8: Canada premium at risk 0.6 0.7 0.8 0.9 1.0 1.1 1.2 1.3 95 96 97 98 99 00 01 02 03 04 05 06 Equity v aluations (FY1P/E), ratio of Canada TSX to US S&P 500 Bond v aluations (reciprocal of 10-y r y ield), ratio of Canada to US Currency v aluations, ratio of CAD/USD rate to estimated PPP Source: Haver Analytics, Merrill Lynch Chart 9: Speculative premium in commodities looks elevated -30% -20% -10% 0% 10% 20% 30% 40% 50% 60% 70% 93 94 95 96 97 98 99 00 01 02 03 04 05 06 12-month performance spread betw een basket of listed and non-listed commodities (%) Source: Bloomberg, Merrill Lynch Chart 10: Materials outperformance closes gap 0.50 0.75 1.00 1.25 1.50 1.75 2.00 99 00 01 02 03 04 05 06 Ratio of TSX GICS Sector Index es: Energy to Materials Source: Haver Analytics, Merrill Lynch
  • 5. Canadian Equity Strategy 19 October 2006 5 financials analyst Andre Hardy entitled Canadian financials: relative risk profile attractive, published September 20. In brief, the defensive nature of the sector in Canada is well known, and clearly shown in Chart 11, which demonstrates that the six largest banks and the six largest non-bank financials have each outperformed through the down-quarters experienced by the TSX over the past five years. And financials’ heavy exposure to domestic conditions is a relative plus given our view of a solid Canadian housing market, a resilient Canadian consumer and a broadly friendly underlying Canadian monetary environment. That last element, proxied by narrow money supply growth, has in fact shown a remarkable correlation to financial stocks’ performance over the past 20 or so years (see Chart 12). And narrow money is currently accelerating in Canada, with gross M1 growth rising in each of the past four months to a 27-month high of 13.4% y/y in August. The BoC’s current clear holding pattern, and our base case forecast of 50 bps in rate cuts in 2007, implies that the domestic environment should remain favourable. Finally, we remain of the view that Canadian financials will outperform their US counterparts ahead, as the emerging contrast in domestic conditions in the two countries (particularly with respect to housing and the consumer) becomes more distinct ahead. The remaining 25% of the TSX accounted for by the smallish other seven GICS sectors have been increasingly influenced more by idiosyncratic factors than macro forces – notably up in the case of infotech (on mergers) and telecoms (on trust conversions), and down in the case of health care (on Biovail’s issues). We have made a few changes in our recommended weightings in these sectors (see Table 1) – up on infotech (to neutral), down on consumer discretionary (to underweight) and health care (to neutral). But in the spectrum of the TSX, these are tweaks. The big call, as usual in Canada, is in the relative performance of the commodity stocks vs the financials. And we continue to make that call in aggressively favouring the latter. Table 2: Ratings, Merrill Lynch & Consensus Merrill Lynch (%) Consensus (%) Ratings (weighted, sectors): Buy Hold Sell Buy Hold Sell Consumer Staples 31 31 38 21 74 5 Consumer Discretionary 23 77 0 51 49 0 Energy 24 75 1 62 38 0 Financials 31 69 0 31 69 0 Health Care 34 66 0 10 90 0 Industrials 10 88 2 77 23 0 Information Technology 57 41 2 66 34 0 Materials 62 38 0 72 28 0 Telecom Services 59 41 0 59 41 0 Utilities** 0 0 0 15 85 0 ML Universe 33 65 2 49 51 0 Source: * Includes only stocks covered by ML fundamental research, excludes income trusts ** Not covered by ML fundamental research Source: CMPS, Merrill Lynch Chart 11: Financials outperform in down markets Median price performance during negativ e TSX quarters since 2000 (%) -12 -10 -8 -6 -4 -2 0 2 4 6 8 10 12 14 S&P TSX TD SLF IAG GWO CM BNS MFC NA BMO RY POW PWF Source: Haver Analytics, Merrill Lynch Table 1: ML Recommendations Sector Recommendation Q3 Change Financials Overweight Cons. Staples Overweight Health Care Neutral Downgrade Infotech Neutral Upgrade Utilities Neutral Telecom Serv. Neutral Materials Underweight Downgrade Cons. Discr. Underweight Downgrade Energy Underweight Industrials Underweight Source: Merrill Lynch Chart 12: M1 growth solid proxy for financials -5 0 5 10 15 20 25 30 89 91 93 95 97 99 01 03 05 -60 -30 0 30 60 90 120 Canada gross M1 (LHS) TSX composite financials index (RHS) y /y % y /y % Source: Haver Analytics, Merrill Lynch
  • 6. Canadian Equity Strategy 19 October 2006 6 Cross-Country Comparisons: P/E Ratios vs. Canada Canada’s total market P/E continued to decline against other major indices as concerns over the slowing global economy and commodity prices increased. In Q3; the 5% gain in the US S&P 500 caused the TSX to trade at a moderate discount for the first time in nine months. Compared to the European indices, the TSX lost significant ground against the German index, while the Canada/UK ratio also ebbed slightly. Against the Asian indices, Canada also fared poorly as China and Japan experienced robust multiple expansion. Meanwhile, Canada remained fairly flat against Australia as both countries have seen forward multiples compress due to continued downward pressure on commodity prices. Chart 13: Canada / Australia 12-mth fwd PE 0.6 0.7 0.8 0.9 1.0 1.1 1.2 1.3 1.4 1.5 1.6 Jul-96 Jul-98 Jul-00 Jul-02 Jul-04 Jul-06 CAN/AUS Source: Factset, Merrill Lynch Chart 14: Canada / US 12-mth fwd PE 0.6 0.7 0.8 0.9 1.0 1.1 1.2 Jul-96 Jul-98 Jul-00 Jul-02 Jul-04 Jul-06 CAN/US Source: Factset, Merrill Lynch Chart 15: Canada / UK 12-mth fwd PE 0.4 0.6 0.8 1.0 1.2 1.4 Jul-96 Jul-98 Jul-00 Jul-02 Jul-04 Jul-06 CAN/UK Source: Factset, Merrill Lynch Chart 16: Canada / Japan 12-mth fwd PE 0.2 0.4 0.6 0.8 1.0 1.2 Jul-96 Jul-98 Jul-00 Jul-02 Jul-04 Jul-06 CAN/JP Source: Factset, Merrill Lynch Chart 17: Canada / Germany 12-mth fwd PE 0.6 0.7 0.8 0.9 1.0 1.1 1.2 1.3 Jul-96 Jul-98 Jul-00 Jul-02 Jul-04 Jul-06 CAN/GER Source: Factset, Merrill Lynch Chart 18: Canada / China 12-mth fwd PE 0.0 0.5 1.0 1.5 2.0 2.5 3.0 Jul-96 Jul-98 Jul-00 Jul-02 Jul-04 Jul-06 CAN/CHN Source: Factset, Merrill Lynch
  • 7. Canadian Equity Strategy 19 October 2006 7 Equity sector scorecard update Our quantitative equity sector scorecard has been updated, reflecting updated consensus and ML fundamental analysts’ recommendations and price action data. In Q3, the overall profile of our equity scorecard showed a distinct thematic shift, as defensive sectors generally rose steadily in rankings while cyclically sensitive sectors mostly declined. Leading the way in improvement was the utilities sector, climbing five spots to third place overall, while financials jumped three spots to finish second to health care. By contrast, the materials and consumer discretionary sectors plummeted in the scorecard rankings, dropping four spots each. This contributed to our decision to downgrade both sectors to underweight from their previous neutral ratings. The other downgrade we made in Q3 was to the health care sector, as the increased volatility risk combined with an unfavourable risk-reward profile now warrants a neutral rating, in our view. Meanwhile, we upgraded the infotech sector’s rating to neutral despite the sector’s drop to eighth overall in our scorecard (tied with energy). We believe that the ATI/AMD merger and continued bullishness on RIM will be enough to support prices over the near term. However, we would advise cautious selection of companies within this sector due to the ongoing options dating issue. Some other highlights from our scorecard that are worth specific mention are in the energy and materials sectors. Firstly, the energy sector ended the quarter down 10% and is now in the red on a year-to-date basis (-3%). The sharp price decline combined with still-elevated earnings estimates led the sector to jump to fourth place on the valuation metric. However, continued weakness in the contrarian and momentum metrics coupled with the sharp divide in our fundamental analysts’ views vs. the market caused this sector to perform poorly in our scorecard rankings. In our view, we believe that there is too much optimism built into commodity prices and earnings estimates and we see increasing downside risk to those expectations. Meanwhile, valuations in materials also plunged in Q3, as forward multiples hit a 15-month low on a historic basis and against the overall index. Despite the positive valuation ranking, materials fell to fifth as the three other metrics showed poor to neutral performances. In addition, we see the near-term cyclical trends within the resource sectors outweighing the more positive longer-term secular trends. We anticipate that the combination of a slowing global economy and cyclical negativity has set the stage for both sectors to underperform over the near term. The commodity bull market over the last four years has been a great one, but we see it looking increasingly past its prime. Table 3: Equity Sector Scorecard Summary Valuation Momentum Contrarian ML vs. cons. Total Score Rank * Health Care 1 10 1 1 2.8 1 Financials 6 2 4 2 3.6 2 Utilities 9 4 2 3 4.8 3 Consumer Staples 3 8 3 6 4.9 4 Materials 2 6 9 5 5.1 5 Telecom Services 10 1 6 4 5.6 6 Consumer Discretionary 8 5 5 7 6.5 7 Information Technology 7 3 10 8 7.1 8 Energy 4 9 7 9 7.1 9 Industrials 5 7 8 10 7.5 10 Source: ML, *lower numbers are better (number rank is out of 10 sectors). ** bold denotes ML overweight sector recommendation
  • 8. Canadian Equity Strategy 19 October 2006 8 Consumer Discretionary Recommendation: Underweight Chart 19: Consumer Discretionary 1000 1050 1100 1150 1200 1250 Mar-05 Jun-05 Sep-05 Dec-05 Mar-06 Jun-06 Sep-06 Source: Datastream, Bloomberg, Merrill Lynch Table 5: Scorecard Criteria Rank Impact Summary Valuation 8 Negative Valuations still trade at a premium on a near-term basis and against its US counterpart. Our primary concern for the sector is its exposure to US consumer demand. Momentum 5 Neutral Momentum in Q3 was fairly flat but the sector still managed to modestly outpace the TSX with a 2.5% gain. Sector performance was mediocre in all three momentum metrics. Contrarian 5 Neutral Consensus EPS growth expectations are relatively modest while the majority of recommendations among fundamental analysts remains neutral. ML vs. Cons 7 Neutral The ML fundamental team is more bearish on this sector, while consensus remains broadly neutral. Overall Rank 7 Overview We downgraded this sector to underweight from neutral due to concerns over high valuations, exposure to the US consumer and the ML fundamental view. We expect the Canadian consumer to remain resilient but advise caution towards companies with high leverage to the US consumer and/or housing market. Conclusion We downgrade our rating from neutral to underweight in this sector against the index. Source: Datastream, Bloomberg, Merrill Lynch Table 4: Vital Stats # of companies: 29 Mkt cap, % of TSX: 6.0 Index Price: 1054 '06 performance: 4.7 1-yr performance 5.0 52-week High: 1231 52-week Low: 1049 Beta vs. TSX: 0.66 Forward PE: 18.3 Source: Factset, Bloomberg, Merrill Lynch Chart 20: FY1 PE* Consumer Discr. 10 12 14 16 18 20 22 24 26 95 96 97 98 99 00 01 02 03 04 05 06 COND Source: Factset, Merrill Lynch Chart 21: FY1 PE* vs. SP 500 Cons. Discr. 0.3 0.4 0.5 0.6 0.7 0.8 0.9 1.0 1.1 1.2 1.3 95 96 97 98 99 00 01 02 03 04 05 06 COND Source: Factset, Merrill Lynch Chart 22: FY1 PE* vs. FY1 TSX PE. 0.6 0.7 0.8 0.9 1.0 1.1 1.2 1.3 1.4 1.5 95 96 97 98 99 00 01 02 03 04 05 06 COND Source: Factset, Merrill Lynch
  • 9. Canadian Equity Strategy 19 October 2006 9 Consumer Staples Recommendation: Overweight Chart 23: Consumer Staples 1500 1550 1600 1650 1700 1750 1800 1850 Mar-05 Jun-05 Sep-05 Dec-05 Mar-06 Jun-06 Sep-06 Source: Datastream, Bloomberg, Merrill Lynch Table 7: Scorecard Criteria Rank Impact Summary Valuation 3 Positive Valuations look attractive in this sector on a historical basis (currently 13% below the 2005 peak) and relative to the broad market. Moreover, the downward price action amid decent earnings has helped maintain this positive score and bolsters our overweight call. Momentum 8 Negative Momentum and trend have both performed poorly in this sector but that may soon reverse. The staples sector has now outperformed the TSX for two consecutive quarters and is down only 3% on a YTD basis. Contrarian 3 Positive Consensus earnings growth estimates remain modest, while the recommendations remain largely neutral. ML vs. Cons 6 Neutral Our fundamental analysts remain broadly neutral on the sector. Expected earnings growth remains in double-digit territory but below the average growth rate of the index. Overall Rank 4 Overview We remain bullish on the consumer staples sector as it provides the lowest beta to the index while offering defensive coverage against weaker US demand. Furthermore, valuations are attractive, monetary policy is still accommodative, and the sector is among the best performers when the BoC is on hold. Conclusion We reiterate our overweight call on this defensive sector. Source: Datastream, Bloomberg, Merrill Lynch Table 6: Vital Stats # of companies: 14 Mkt cap, % of TSX: 3.7 Index Price: 1586 '06 performance: -2.8 1-yr performance -10.1 52-week High: 1779 52-week Low: 1530 Beta vs. TSX: 0.19 Forward PE: 16.2 Source: Factset, Bloomberg, Merrill Lynch Chart 24: FY1 PE* Consumer Staples 10 12 14 16 18 20 22 24 26 28 30 95 96 97 98 99 00 01 02 03 04 05 06 CONS Source: Factset, Merrill Lynch, *note: excludes extreme outliers Chart 25: FY1 PE* vs. FY1 TSX PE 0.8 0.9 1.0 1.1 1.2 1.3 1.4 1.5 1.6 95 96 97 98 99 00 01 02 03 04 05 06 CONS Source: Factset, Merrill Lynch, *note: excludes extreme outliers Chart 26: FY1 PE* vs. SP 500 Cons. Staples 0.6 0.7 0.8 0.9 1.0 1.1 1.2 1.3 95 96 97 98 99 00 01 02 03 04 05 06 CONS Source: Factset, Merrill Lynch, *note: excludes extreme outliers
  • 10. Canadian Equity Strategy 19 October 2006 10 Energy Recommendation: Underweight Chart 27: Energy 2000 2200 2400 2600 2800 3000 3200 3400 3600 Mar-05 Jun-05 Sep-05 Dec-05 Mar-06 Jun-06 Sep-06 Source: Datastream, Bloomberg, Merrill Lynch Table 9: Scorecard Criteria Rank Impact Summary Valuation 4 Neutral Multiples and prices have declined sharply as energy prices have plummeted. The forward multiple for the sector is at a 17 month low, but remains expensive compared to the US and the 5-year average discount to the overall index. Momentum 9 Negative With crude prices touching negative year-over-year growth in Q3, the energy sector declined 10% and fell 3% into the red on a YTD basis. Contrarian 7 Neutral Consensus earnings growth estimates remain stubbornly high despite the volatility in crude prices and the expected US and global slowdown. ML vs. Cons 9 Negative The ML fundamental view remains very bearish relative to consensus estimates. The divergence in views remains the largest within the index as our analysts expect energy earnings growth to be 14 ppts below consensus estimates. Overall Rank 9 Overview Cost concerns threaten to derail some of the oil sands projects while rising crude inventory and the expected US slowdown continue to put downward pressure on crude prices. We believe that the market has too much optimism embedded into prices and earnings; we reiterate our bearish view on the resource sectors. Conclusion We reiterate our underweight call in this sector against the index. Source: Datastream, Bloomberg, Merrill Lynch Table 8: Vital Stats # of companies: 76 Mkt cap, % of TSX: 29.7 Index Price: 2652 '06 performance: -3.4 1-yr performance -5.7 52-week High: 3550 52-week Low: 2679 Beta vs. TSX: 1.60 Forward PE: 13.9 Source: Factset, Bloomberg, Merrill Lynch Chart 28: FY1 PE* Energy 5 10 15 20 25 30 95 96 97 98 99 00 01 02 03 04 05 06 ENRS Source: Factset, Merrill Lynch, *note: excludes extreme outliers Chart 29: FY1 PE* vs. FY1 TSX PE 0.5 0.7 0.9 1.1 1.3 1.5 1.7 95 96 97 98 99 00 01 02 03 04 05 06 ENRS Source: Factset, Merrill Lynch, *note: excludes extreme outliers Chart 30: FY1 PE* vs. SP 500 Energy 0.5 0.7 0.9 1.1 1.3 1.5 1.7 95 96 97 98 99 00 01 02 03 04 05 06 ENRS Source: Factset, Merrill Lynch, *note: excludes extreme outliers
  • 11. Canadian Equity Strategy 19 October 2006 11 Financials Recommendation: Overweight Chart 31: Financials 1400 1450 1500 1550 1600 1650 1700 1750 1800 1850 Mar-05 Jun-05 Sep-05 Dec-05 Mar-06 Jun-06 Sep-06 Source: Datastream, Bloomberg, Merrill Lynch Table 11: Scorecard Criteria Rank Impact Summary Valuation 6 Neutral Recent concerns over the slowing global economy have caused some defensive sector rotation towards financials, which drove valuations higher in Q3. The sector has risen 9% since Q2, but still looks attractive when compared to the broad market. Momentum 2 Positive The trend remains positive over the longer term while momentum has picked up in the short term. Outside of telecom services, financials scored the best on a relative strength basis. Contrarian 4 Neutral Consensus earnings growth estimates, which are modestly below the index average, keep this sector neutral from a contrarian perspective. ML vs. Cons 2 Positive The ML analysts' earnings estimates remain in line with the consensus estimates, while our proportions of buys are also in line with the Street's recommendations. The ML fundamental team is more bullish on the insurance sector versus the banks. Overall Rank 2 Overview We reiterate our overweight call on the financials sector as it boasts solid fundamentals. A stable Canadian housing market, modest job growth, robust money supply growth and a resilient Canadian consumer should help support earnings growth and reduce loan loss risk. The financials sector remains the primary defensive sector in Canada and is among the best performing sectors when the BoC is on hold. Conclusion We reiterate our overweight in the financial sector against the index. Source: Datastream, Bloomberg, Merrill Lynch Table 10: Vital Stats # of companies: 39 Mkt cap, % of TSX: 31.9 Index Price: 1601 '06 performance: 6.3 1-yr performance 13.9 52-week High: 1807 52-week Low: 1513 Beta vs. TSX: 0.59 Forward PE: 14.7 Source: Factset, Bloomberg, Merrill Lynch Chart 32: FY1 PE* Financials 5 7 9 11 13 15 17 19 95 96 97 98 99 00 01 02 03 04 05 06 FINL Source: Factset, Merrill Lynch, *note: excludes extreme outliers Chart 33: FY1 PE* vs. FY1 TSX PE 0.6 0.7 0.8 0.9 1.0 1.1 95 96 97 98 99 00 01 02 03 04 05 06 FINL Source: Factset, Merrill Lynch, *note: excludes extreme outliers Chart 34: FY1 PE* vs. SP 500 Financials 0.6 0.7 0.8 0.9 1.0 1.1 1.2 95 96 97 98 99 00 01 02 03 04 05 06 FINL Source: Factset, Merrill Lynch, *note: excludes extreme outliers
  • 12. Canadian Equity Strategy 19 October 2006 12 Health Care Recommendation: Neutral Chart 35: Health Care 425 450 475 500 525 550 575 600 Mar-05 Jun-05 Sep-05 Dec-05 Mar-06 Jun-06 Sep-06 Source: Datastream, Bloomberg, Merrill Lynch Table 13: Scorecard Criteria Rank Impact Summary Valuation 1 Positive The forward multiple for the health care sector trades near 10-yr lows and near a 17-month low when compared against its US counterpart. Momentum 10 Negative The sector continued to spiral downward in Q3 on concerns over the heavily- weighted Biovail. In terms of price performance, health care has ranked dead- last for two consecutive quarters and is the poorest-performing sector on the TSX, down 14% on a YTD basis. Contrarian 1 Positive Health care is the only sector with expected negative earnings growth, which scores well under contrarian screen. ML vs. Cons 1 Positive ML fundamental analysts remain bullish relative to consensus estimates. However, the lack of breadth within the sector magnifies the proportion of buys. Overall Rank 1 Overview The uncertainties associated with the Biovail ruling still weigh heavily on this sector and the risk/reward profile looks unfavourable, in our view, despite the very positive quantitative profile. In addition, the lack of breadth combined with increased volatility contributes to our downgrade to neutral. Conclusion We downgrade our rating from overweight to neutral in this sector against the index. Source: Datastream, Bloomberg, Merrill Lynch Table 12: Vital Stats # of companies: 11 Mkt cap, % of TSX: 0.9 Index Price: 411 '06 performance: -13.6 1-yr performance -15.6 52-week High: 592 52-week Low: 456 Beta vs. TSX: 0.62 Forward PE: 12.8 Source: Factset, Bloomberg, Merrill Lynch Chart 36: FY1 PE* Health Care 5 10 15 20 25 30 35 40 45 50 95 96 97 98 99 00 01 02 03 04 05 06 HLTH Source: Factset, Merrill Lynch, *note: excludes extreme outliers Chart 37: FY1 PE* vs. FY1 TSX PE 0.8 1.3 1.8 2.3 2.8 3.3 3.8 95 96 97 98 99 00 01 02 03 04 05 06 HLTH Source: Factset, Merrill Lynch, *note: excludes extreme outliers Chart 38: FY1 PE* vs. SP 500 Health Care 0.5 0.7 0.9 1.1 1.3 1.5 1.7 95 96 97 98 99 00 01 02 03 04 05 06 HLTH Source: Factset, Merrill Lynch, *note: excludes extreme outliers
  • 13. Canadian Equity Strategy 19 October 2006 13 Industrials Recommendation: Underweight Chart 39: Industrials 850 900 950 1000 1050 1100 1150 1200 Mar-05 Jun-05 Sep-05 Dec-05 Mar-06 Jun-06 Sep-06 Source: Datastream, Bloomberg, Merrill Lynch Table 15: Scorecard Criteria Rank Impact Summary Valuation 5 Neutral Valuations for the sector still trade at a premium relative to the overall index, to its US peer group, and to its historical average. Momentum 7 Neutral Momentum and trend remained flat in Q3 as declining fuel costs were offset by US growth concerns. The sector has underperformed the broad market over the last two quarters and is up 3% on a YTD basis. Contrarian 8 Negative The poor contrarian ranking is due to the Street's bullish view on the rails sector combined with a high proportion of buy recommendations. ML vs. Cons 10 Negative Our ML fundamental analysts remain extremely bearish on this sector relative to consensus. The large difference between the ML view and the consensus results from opposing recommendations on the road and rail sector. Overall Rank 10 Overview We reiterate our underweight call on the industrials sector as still-elevated energy costs combined with an expected slowdown in the US economy raise concerns over earnings growth. Our ML fundamental team now prefers the airlines relative to the road and rail industry group. Conclusion We reiterate our underweight call in this sector against the index. Source: Datastream, Bloomberg, Merrill Lynch Table 14: Vital Stats # of companies: 21 Mkt cap, % of TSX: 4.5 Index Price: 948 '06 performance: 3.3 1-yr performance 7.2 52-week High: 1172 52-week Low: 945 Beta vs. TSX: 0.83 Forward PE: 16.1 Source: Factset, Bloomberg, Merrill Lynch Chart 40: FY1 PE* Industrials 10 12 14 16 18 20 95 96 97 98 99 00 01 02 03 04 05 06 INDU Source: Factset, Merrill Lynch, *note: excludes extreme outliers Chart 41: FY1 PE* vs. FY1 TSX PE 0.7 0.8 0.9 1.0 1.1 1.2 1.3 1.4 95 96 97 98 99 00 01 02 03 04 05 06 INDU Source: Factset, Merrill Lynch, *note: excludes extreme outliers Chart 42: FY1 PE* vs. SP 500 Industrials 0.5 0.6 0.7 0.8 0.9 1.0 1.1 95 96 97 98 99 00 01 02 03 04 05 06 INDU Source: Factset, Merrill Lynch, *note: excludes extreme outliers
  • 14. Canadian Equity Strategy 19 October 2006 14 Information Technology Recommendation: Neutral Chart 43: Information Technology 150 175 200 225 250 Mar-05 Jun-05 Sep-05 Dec-05 Mar-06 Jun-06 Sep-06 Source: Datastream, Bloomberg, Merrill Lynch Table 17: Scorecard Criteria Rank Impact Summary Valuation 7 Neutral Valuations have increased markedly for this sector on news of the ATI/AMD merger and the performance of RIM. Momentum 3 Positive After lagging through the first half of the year, Q3 saw tech rebound sharply (+23%) and it is now in the black (+7%) on a YTD basis. Contrarian 10 Negative Earnings growth expectations that are three times higher than the index average cause tech to rank last in the contrarian screen. ML vs. Cons 8 Negative The ML fundamental team is marginally more bearish on earnings growth and has a lower proportion of buy recommendations than consensus. Overall Rank 8 Overview We upgrade info tech as the consumer release of Pearl from RIM and the ATI/AMD merger are expected to provide further solid price support for the sector. However, we would advise caution within this sector as the ongoing option dating scandal, expensive valuations and lofty earnings growth expectations could subject investors to high volatility. Conclusion We upgrade our rating from underweight to neutral in this sector against the index. Source: Datastream, Bloomberg, Merrill Lynch Table 16: Vital Stats # of companies: 11 Mkt cap, % of TSX: 3.7 Index Price: 200 '06 performance: 6.9 1-yr performance 5.1 52-week High: 233 52-week Low: 170 Beta vs. TSX: 0.70 Forward PE: 21.2 Source: Factset, Bloomberg, Merrill Lynch Chart 44: FY1 PE* Info Tech 5 10 15 20 25 30 95 96 97 98 99 00 01 02 03 04 05 06 INFT Source: Factset, Merrill Lynch, *note: excludes extreme outliers Chart 45: FY1 PE* vs. FY1 TSX PE 0.5 0.7 0.9 1.1 1.3 1.5 1.7 1.9 2.1 2.3 95 96 97 98 99 00 01 02 03 04 05 06 INFT Source: Factset, Merrill Lynch, *note: excludes extreme outliers Chart 46: FY1 PE* vs. SP 500 Info Tech 0.2 0.7 1.2 1.7 2.2 2.7 95 96 97 98 99 00 01 02 03 04 05 06 INFT Source: Factset, Merrill Lynch, *note: excludes extreme outliers
  • 15. Canadian Equity Strategy 19 October 2006 15 Materials Recommendation: Underweight Chart 47: Materials 1300 1400 1500 1600 1700 1800 1900 2000 2100 2200 2300 Mar-05 Jun-05 Sep-05 Dec-05 Mar-06 Jun-06 Sep-06 Source: Datastream, Bloomberg, Merrill Lynch Table 19: Scorecard Criteria Rank Impact Summary Valuation 2 Positive Valuations for the materials sector are the lowest in the index and are approaching historic lows. We would advise caution in interpreting this result, however, as PE multiples for this sector tend to be lowest near the top of the cycle. Momentum 6 Neutral After posting four consecutive quarters of price gains, the materials streak finally ended with the sector down 0.5% in Q3. Contrarian 9 Negative Earnings expectations for this sector are second highest for both the consensus and ML estimates, which screens poorly under the contrarian measure. ML vs. Cons 5 Neutral The ML fundamental team remains modestly more bearish than consensus on earnings growth and is broadly in line with consensus when measured by proportion of buys. Overall Rank 5 Overview We continue to view the potential downturn in the US and global economies as the biggest downside risk to the materials sector and commodity prices. We believe that there continues to be too much optimism built into commodity price assumptions and earnings growth estimates and we see increasing downside risk ahead to those expectations. Conclusion We downgrade our rating from neutral to underweight in this sector against the index. Source: Datastream, Bloomberg, Merrill Lynch Table 18: Vital Stats # of companies: 61 Mkt cap, % of TSX: 14.0 Index Price: 1791 '06 performance: 14.7 1-yr performance 25.5 52-week High: 2292 52-week Low: 1465 Beta vs. TSX: 1.44 Forward PE: 12.2 Source: Factset, Bloomberg, Merrill Lynch Chart 48: FY1 PE* Materials 5 10 15 20 25 30 35 40 45 95 96 97 98 99 00 01 02 03 04 05 06 MATR Source: Factset, Merrill Lynch, *note: excludes extreme outliers Chart 49: FY1 PE* vs. FY1 TSX PE 0.5 1.0 1.5 2.0 2.5 3.0 95 96 97 98 99 00 01 02 03 04 05 06 MATR Source: Factset, Merrill Lynch, *note: excludes extreme outliers Chart 50: FY1 PE* vs. SP 500 Materials 0.5 0.6 0.7 0.8 0.9 1.0 1.1 1.2 1.3 1.4 1.5 95 96 97 98 99 00 01 02 03 04 05 06 MATR Source: Factset, Merrill Lynch, *note: excludes extreme outliers
  • 16. Canadian Equity Strategy 19 October 2006 16 Telecom Services Recommendation: Neutral Chart 51: Telecom Services 675 700 725 750 775 800 825 850 875 900 Mar-05 Jun-05 Sep-05 Dec-05 Mar-06 Jun-06 Sep-06 Source: Datastream, Bloomberg, Merrill Lynch Table 21: Scorecard Criteria Rank Impact Summary Valuation 10 Negative Valuations have sky-rocketed to a 5-year high due to the Telus and BCE trust conversion announcements. Momentum 1 Positive Momentum and trend have soared along with valuations. Telcos returned an impressive 24% in Q3 and overtook the materials sector as the best performing sector on a YTD basis. Contrarian 6 Neutral Consensus EPS growth estimates rank fifth overall, which places telecom services squarely in the middle of the field. ML vs. Cons 4 Neutral Our fundamental team remains in line with the consensus view and expects earnings growth to broadly match the overall index. Overall Rank 6 Overview Despite the defensive qualities that the sector offers, such as solid earnings, high dividends and low beta, we would be inclined not to chase performance at this point. We believe that the momentum built in Q3 should provide solid support for prices, but we don't see much potential upside remaining. Furthermore, the sector's lack of breadth discounts it from being a truly defensive sector. Conclusion We reiterate our neutral weight in this sector against the index. Source: Datastream, Bloomberg, Merrill Lynch Table 20: Vital Stats # of companies: 6 Mkt cap, % of TSX: 4.1 Index Price: 780 '06 performance: 18.7 1-yr performance 10.3 52-week High: 878 52-week Low: 686 Beta vs. TSX: 0.54 Forward PE: 26.5 Source: Factset, Bloomberg, Merrill Lynch Chart 52: FY1 PE* Telecom Services 0 10 20 30 40 50 60 70 95 96 97 98 99 00 01 02 03 04 05 06 TELS Source: Factset, Merrill Lynch, *note: excludes extreme outliers Chart 53: FY1 PE* vs. FY1 TSX PE 0.0 0.5 1.0 1.5 2.0 2.5 3.0 3.5 4.0 4.5 5.0 95 96 97 98 99 00 01 02 03 04 05 06 TELS Source: Factset, Merrill Lynch, *note: excludes extreme outliers Chart 54: FY1 PE* vs. SP 500 Telecom Services 0.2 0.4 0.6 0.8 1.0 1.2 1.4 1.6 1.8 2.0 2.2 95 96 97 98 99 00 01 02 03 04 05 06 TELS Source: Factset, Merrill Lynch, *note: excludes extreme outliers
  • 17. Canadian Equity Strategy 19 October 2006 17 Utilities Recommendation: Neutral Chart 55: Utilities 1300 1400 1500 1600 1700 1800 1900 Mar-05 Jun-05 Sep-05 Dec-05 Mar-06 Jun-06 Sep-06 Source: Datastream, Bloomberg, Merrill Lynch Table 23: Scorecard Criteria Rank Impact Summary Valuation 9 Negative Investor concerns over slowing global growth drove bond yields lower and utility valuations to near record highs. Momentum 4 Neutral Momentum for the sector continued to build in Q3 as utilities managed to outperform the TSX for the second consecutive quarter. The sector is still performing poorly on a YTD basis though, down 6%. Contrarian 2 Positive Sluggish expected earnings growth combined with neutral recommendations bode well under the contrarian ranking. ML vs. Cons 3 Positive We used consensus estimates to determine this result as ML does not cover the Canadian sector. Overall Rank 3 Overview A flight to quality was the theme in Q3 as investors grew worried over slowing global growth. Valuations for the utility sector currently trade at a significant premium to the index (third most expensive) and are nearing record highs. Although we like the utility sector's low beta and high dividend qualities, we believe that there are more attractive opportunities in financials and income trusts. The financials sector, for example, offers more breadth, comparable dividend ratios, higher earnings growth and trades at a lower multiple. Conclusion We reiterate our neutral rating for utilities and prefer financials to this sector. Source: Datastream, Bloomberg, Merrill Lynch Table 22: Vital Stats # of companies: 11 Mkt cap, % of TSX: 1.5 Index Price: 1538 '06 performance: -5.6 1-yr performance -1.3 52-week High: 1865 52-week Low: 1572 Beta vs. TSX: 0.54 Forward PE: 18.7 Source: Factset, Bloomberg, Merrill Lynch Chart 56: FY1 PE* Utilities 9 11 13 15 17 19 21 95 96 97 98 99 00 01 02 03 04 05 06 UTIL Source: Factset, Merrill Lynch, *note: excludes extreme outliers Chart 57: FY1 PE* vs. FY1 TSX PE 0.7 0.8 0.9 1.0 1.1 1.2 1.3 1.4 95 96 97 98 99 00 01 02 03 04 05 06 UTIL Source: Factset, Merrill Lynch, *note: excludes extreme outliers Chart 58: FY1 PE* vs. SP 500 Utilities 0.7 0.9 1.1 1.3 1.5 1.7 1.9 2.1 95 96 97 98 99 00 01 02 03 04 05 06 UTIL Source: Factset, Merrill Lynch, *note: excludes extreme outliers
  • 18. Canadian Equity Strategy 19 October 2006 18 Important Disclosures Investment Rating Distribution: Global Group (as of 30 Sep 2006) Coverage Universe Count Percent Inv. Banking Relationships* Count Percent Buy 1325 44.76% Buy 434 32.75% Neutral 1420 47.97% Neutral 412 29.01% Sell 215 7.26% Sell 48 22.33% * Companies in respect of which MLPF&S or an affiliate has received compensation for investment banking services within the past 12 months. FUNDAMENTAL EQUITY OPINION KEY: Opinions include a Volatility Risk Rating, an Investment Rating and an Income Rating. VOLATILITY RISK RATINGS, indicators of potential price fluctuation, are: A - Low, B - Medium, and C - High. INVESTMENT RATINGS, indicators of expected total return (price appreciation plus yield) within the 12-month period from the date of the initial rating, are: 1 - Buy (10% or more for Low and Medium Volatility Risk Securities - 20% or more for High Volatility Risk securities); 2 - Neutral (0-10% for Low and Medium Volatility Risk securities - 0-20% for High Volatility Risk securities); 3 - Sell (negative return); and 6 - No Rating. INCOME RATINGS, indicators of potential cash dividends, are: 7 - same/higher (dividend considered to be secure); 8 - same/lower (dividend not considered to be secure); and 9 - pays no cash dividend. Due to the nature of strategic analysis, the issuers or securities recommended or discussed in this report are not continuously followed. Accordingly, investors must regard this report as providing stand-alone analysis and should not expect continuing analysis or additional reports relating to such issuers and/or securities. The analyst(s) responsible for covering the securities in this report receive compensation based upon, among other factors, the overall profitability of Merrill Lynch, including profits derived from investment banking revenues.
  • 19. Canadian Equity Strategy 19 October 2006 19 Other Important Disclosures UK readers: MLPF&S or an affiliate is a liquidity provider for the securities discussed in this report. Information relating to Non-U.S. affiliates of Merrill Lynch, Pierce, Fenner & Smith Incorporated (MLPF&S): MLPF&S distributes research reports of the following non-US affiliates in the US (short name: legal name): Merrill Lynch (France): Merrill Lynch Capital Markets (France) SAS; Merrill Lynch (Frankfurt Branch): Merrill Lynch International Bank Ltd, Frankfurt Branch; Merrill Lynch (South Africa): Merrill Lynch South Africa (Pty) Ltd; Merrill Lynch (Milan): Merrill Lynch International Bank Limited; MLPF&S (UK): Merrill Lynch, Pierce, Fenner & Smith Limited; Merrill Lynch (Australia): Merrill Lynch Equities (Australia) Limited; Merrill Lynch (Hong Kong): Merrill Lynch (Asia Pacific) Limited; Merrill Lynch (Singapore): Merrill Lynch (Singapore) Pte Ltd; Merrill Lynch (Canada): Merrill Lynch Canada Inc; Merrill Lynch (Mexico): Merrill Lynch Mexico, SA de CV, Casa de Bolsa; Merrill Lynch (Argentina): Merrill Lynch Argentina SA; Merrill Lynch (Brazil): Banco Merrill Lynch de Investimentos SA; Merrill Lynch (Japan): Merrill Lynch Japan Securities Co, Ltd; Merrill Lynch (Seoul): Merrill Lynch International Incorporated (Seoul Branch); Merrill Lynch (Taiwan): Merrill Lynch Global (Taiwan) Limited; DSP Merrill Lynch (India): DSP Merrill Lynch Limited; PT Merrill Lynch (Indonesia): PT Merrill Lynch Indonesia; Merrill Lynch (KL) Sdn. Bhd.: Merrill Lynch (Malaysia); Merrill Lynch (Israel): Merrill Lynch Israel Limited; Merrill Lynch (Russia): Merrill Lynch CIS Limited, Moscow. This research report has been prepared and issued by MLPF&S and/or one or more of its non-U.S. affiliates. MLPF&S is the distributor of this research report in the U.S. and accepts full responsibility for research reports of its non-U.S. affiliates distributed in the U.S. Any U.S. person receiving this research report and wishing to effect any transaction in any security discussed in the report should do so through MLPF&S and not such foreign affiliates. This research report has been approved for publication in the United Kingdom by Merrill Lynch, Pierce, Fenner & Smith Limited, which is authorized and regulated by the Financial Services Authority; has been considered and distributed in Japan by Merrill Lynch Japan Securities Co, Ltd, a registered securities dealer under the Securities and Exchange Law in Japan; is distributed in Hong Kong by Merrill Lynch (Asia Pacific) Limited, which is regulated by the Hong Kong SFC; is issued and distributed in Taiwan by Merrill Lynch (Taiwan) Ltd or Merrill Lynch, Pierce, Fenner & Smith Limited (Taiwan Branch); is issued and distributed in Malaysia by Merrill Lynch (KL) Sdn. Bhd., a licensed investment adviser regulated by the Malaysian Securities Commission; and is issued and distributed in Singapore by Merrill Lynch International Bank Limited (Merchant Bank) and Merrill Lynch (Singapore) Pte Ltd (Company Registration No.’s F 06872E and 198602883D respectively). Merrill Lynch International Bank Limited (Merchant Bank) and Merrill Lynch (Singapore) Pte Ltd. are regulated by the Monetary Authority of Singapore. Merrill Lynch Equities (Australia) Limited, (ABN 65 006 276 795), AFS License 235132, provides this report in Australia. No approval is required for publication or distribution of this report in Brazil. Merrill Lynch Dublin is regulated by BaFin. Copyright, User Agreement and other general information related to this report: Copyright 2006 Merrill Lynch, Pierce, Fenner & Smith Incorporated. All rights reserved. This research report is prepared for the use of Merrill Lynch clients and may not be redistributed, retransmitted or disclosed, in whole or in part, or in any form or manner, without the express written consent of Merrill Lynch. Merrill Lynch research reports are distributed simultaneously to internal and client websites eligible to receive such research prior to any public dissemination by Merrill Lynch of the research report or information or opinion contained therein. Any unauthorized use or disclosure is prohibited. Receipt and review of this research report constitutes your agreement not to redistribute, retransmit, or disclose to others the contents, opinions, conclusion, or information contained in this report (including any investment recommendations, estimates or price targets) prior to Merrill Lynch's public disclosure of such information. The information herein (other than disclosure information relating to Merrill Lynch and its affiliates) was obtained from various sources and we do not guarantee its accuracy. Merrill Lynch makes no representations or warranties whatsoever as to the data and information provided in any third party referenced website and shall have no liability or responsibility arising out of or in connection with any such referenced website. This research report provides general information only. Neither the information nor any opinion expressed constitutes an offer or an invitation to make an offer, to buy or sell any securities or other investment or any options, futures or derivatives related to such securities or investments. It is not intended to provide personal investment advice and it does not take into account the specific investment objectives, financial situation and the particular needs of any specific person who may receive this report. Investors should seek financial advice regarding the appropriateness of investing in any securities, other investment or investment strategies discussed or recommended in this report and should understand that statements regarding future prospects may not be realized. Investors should note that income from such securities or other investments, if any, may fluctuate and that price or value of such securities and investments may rise or fall. Accordingly, investors may receive back less than originally invested. Past performance is not necessarily a guide to future performance. Any information relating to the tax status of financial instruments discussed herein is not intended to provide tax advice or to be used by anyone to provide tax advice. Investors are urged to seek tax advice based on their particular circumstances from an independent tax professional. Foreign currency rates of exchange may adversely affect the value, price or income of any security or related investment mentioned in this report. In addition, investors in securities such as ADRs, whose values are influenced by the currency of the underlying security, effectively assume currency risk. Officers of MLPF&S or one or more of its affiliates (other than research analysts) may have a financial interest in securities of the issuer(s) or in related investments. Merrill Lynch Research policies relating to conflicts of interest are described at http://www.ml.com/media/43347.pdf. Fundamental equity reports are produced on a regular basis as necessary to keep the investment recommendation current.