SlideShare a Scribd company logo
1 of 12
Download to read offline
COMPANY UPDATE | COMMENT
AUGUST 6, 2012
Brookfield Office Properties (NYSE: BPO; TSX: BPO)
Underlying Q2 As Expected; The Large-Cap Value
Name, As Investors Focus On The 3L's
Sector Perform
Average Risk
Price: 16.82
Shares O/S (MM): 503.8
Dividend: 0.56
NAVPS: 20.75
BVPS: 18.64
Float (MM): 252.0
Debt to Cap: 47%
Price Target: 20.00
Implied All-In Return: 22%
Market Cap (MM): 8,474
Yield: 3.3%
P/NAVPS: 0.8x
P/BVPS: 0.9x
Event
Brookfield Office Properties ("BPO") has reported Q2/12 results,
Investment Opinion
• Q2/12 Results Exceed Expectations On Non-Operating Items – FFO/unit of
$0.30 was flat with Q2/11’s $0.30 yet ahead of our $0.27E (consensus~$0.26).
Two items of note: i) non recurring income of $12MM (~$0.02/share); and, ii)
a sequential increase of $11MM (~$0.02/share) in S/L rent (both discussed
herein) unexpectedly buoyed FFO.
• Macro Headwinds In The Face Of Major Leasing Momentum – Q2/12
leasing of 2.6MM sf at an average Y1 rent of $28.59/sf generated a strong
+34% leasing spread. While leasing spreads are up YoY, overall leasing
velocity has moderated from 2011. A robust pipeline (~3.5MM sf signed/in
negot'n) positions BPO to push occupancy higher by y/e. Despite this, macro
headwinds seem to be causing hesitation by large users, unless motivated by
near-term maturities or space consolidation needs. These dynamics appear to be
frustrating efforts to address ~3MM sf expiries at WFC in late-13.
• Increasing Focus On Leverage/Liquidity – A point of repeated discussion on
the recent Q2/12 quarterly conference call related to BPO’s sources of liquidity
and its financial leverage. Our sources/uses analysis through Q4/13 identifies
$2B in uses and $2.8B of sources, thus providing $800MM of leeway. We
expect current gearing of ~50% LTV will also stay largely static over this time
frame, which many not suit the de-leveraging desires of some.
• Lack Of Earnings Momentum Through 2014 – It’s an increasing probability
that BPO will have to carry a major chunk of the WFC vacancy in late
2013-H1/14. Hence, BPO is likely in for a period of flat- to declining
FFO/share into H1/14. During this transitory period, the shares are likely to
trade at elevated P/AFFO multiples, hence valuation will include a greater
emphasis upon underlying NAV.
• The “Value” Name Within The Large-Cap Office REITs – With the shares
at a 6.5% implied cap rate and a 19% discount to NAV ($20.75), BPO would
appear to be the “value” stock within the large-cap office segment. We attribute
this to lack of AFFO/share momentum headed into H2/13-H1/14, and investor
concern related to the “3L’s” (Leasing/Liquidity/Leverage).
• $20 Price Target And Sector Perform Rating Reiterated
Priced as of prior trading day's market close, EST (unless otherwise noted).
125 WEEKS 19MAR10 - 03AUG12
12.00
14.00
16.00
18.00
20.00
M A M J J A S O N
2010
D J F M A M J J A S O N
2011
D J F M A M J J A
2012
HI-08JUL11 20.07
LO/HI DIFF 73.46%
CLOSE 16.82
LO-07MAY10 11.57
5000
10000
15000
20000
25000
PEAK VOL. 27917.2
VOLUME 9506.5
100.00
110.00
Rel. S&P 500 HI-05NOV10 115.29
HI/LO DIFF -21.50%
CLOSE 92.51
LO-07OCT11 90.51
RBC Dominion Securities Inc.
Neil Downey, CA, CFA (Analyst)
(416) 842-7835; neil.downey@rbccm.com
Michael Markidis, CFA (Analyst)
(416) 842-7897; michael.markidis@rbccm.com
Kevin Cheng, CFA (Associate)
(416) 842-3803; kevin.cheng@rbccm.com
Wayne Che, CA, CFA (Associate)
(416) 842-7894; wayne.che@rbccm.com
FY Dec 2010A 2011A 2012E 2013E
EPS (Op) - FD 2.71 2.92 1.62 1.30
Prev. 1.63 1.37
P/E 6.2x 5.8x 10.4x 12.9x
FFO (Op) - FD 1.19 1.14 1.12 1.14
Prev. 1.11 1.19
P/FFO 14.1x 14.8x 15.0x 14.8x
AFFO - FD 0.90 0.69 0.68 0.71
Prev. 0.71 0.80
P/AFFO 18.7x 24.4x 24.7x 23.7x
FFO (Op) - FD Q1 Q2 Q3 Q4
2010 0.25A 0.40A 0.32A 0.34A
2011 0.28A 0.30A 0.30A 0.26A
2012 0.27A 0.30A 0.28E 0.27E
Prev. 0.27E 0.29E
FFO (Op): 2010A reported FFO (including realization gains +
large lease termination recepits) was $1.37.
All values in USD unless otherwise noted.
For Required Non-U.S. Analyst and Conflicts Disclosures, see page 9.
2
Highlights & Overview
Q2/12 Results Exceed Expectations on Non-Recurring and Accounting Items – FFO/unit of $0.30 was flat with Q2/11’s $0.30 yet
ahead of our $0.27 estimate and consensus ($0.26-$0.27). Two items of note: i) non recurring income of $12 million (~$0.02/share)
included lease termination receipts (mostly Wachovia) of $11 million and a $1 million tax refund (Ottawa); and ii) a sequential
increase of $11 million (~$0.02/share) in straight-line rent related to Brookfield Place (Perth), a Morgan Stanley lease
renewal/expansion (1 New York Plaza) and other accounting adjustments (straight-line rent re-set due to change of control of the U.S.
office fund and 4WFC) were not in our forecast and likely not within “Street” estimates. Overall, we see core operating trends and
underlying financial results as being in accordance with expectations.
Macro Headwinds In The Face Of Leasing Momentum; BofAML Space At WFC Is Still The Overhang – In Q2/12, BPO leased
2.6 million sf at an average year-one net rent of $28.59/sf, representing a substantial +34% spread over the average expiring rent of
$21.34/sf. While leasing spreads are higher than year-ago levels, overall leasing activity has moderated from 2011. Management
continues to suggest a robust pipeline (~3.5 million sf that has either been signed or is in the documentation or advanced negotiation
stages) positions the company well to push occupancy higher by year-end. Despite this momentum, commentary suggests that macro-
headwinds are causing larger users to hesitate in their leasing decisions, unless they are motivated by H2/12-2013 lease maturities or
the need to consolidate space requirements. This appears to be a frustration in addressing the ~3 million sf BofAML expiry at WFC.
Increasing Focus On Leverage And Liquidity; We Are Comfortable With Sources/Uses, Yet We See No Reduction From
~50% Gearing – A point of repeated discussion on the recent Q2/12 quarterly conference call related to BPO’s sources of liquidity
and its financial leverage. Our analysis of source/uses of funds identifies $2.0 billion of expected uses through Q4/13 versus potential
sources of $2.8 billon, thus providing for ~$800 million of leeway. Thus, we believe BPO has adequate liquidity. This same analysis
also suggests overall LTV will hold constant at ~50% over the time period. Others are clearly of the view that reduced leverage would
be desirable. We note the company has historically employed higher-than-average gearing. Based on this history and management
commentary about the future, we believe this is not likely to change.
Lack Of Earnings Momentum Through 2014 – It is increasingly likely that BPO will have to carry a major chunk of the BofAML
space at WFC as vacancy in late 2013 and H1/14. The degree of FFO/AFFO “hit” during this time frame will, in part, be the product
of the accounting policies employed. It appears to us that BPO is in for a period of flat- to declining FFO/share into H1/14. Hence,
intermediate-term FFO/share and AFFO/share momentum does not look great. During this transitory period, the shares are likely to
trade at elevated P/AFFO multiples and valuation analysis will likely require a greater emphasis upon underlying NAV.
The “Value” Name Within The Large-Cap Office REITs – With the shares trading a 6.5% implied cap rate and a 19% discount to
our $20.75 NAV, BPO would appear to be the “value” stock within the large-cap office segment. We attribute this to the lack of
FFO/share and AFFO/share momentum headed into 2013-14, and investor focus upon the “3L’s” (Leasing; Liquidity; Leverage).
Q2/12 Results And Re-Cap
Occupancy And Same Property NOI Growth Edge Higher – Q2/12 total portfolio occupancy was 93.4%, 50bps above Q1/12’s
92.9% and 10bps higher than Q2/11. Sequential results were strong across the board, lifting the Q2/12 occupancy rate to its highest
level since Q1/11. Regional occupancy metrics include:
 United States – Q2/12 occupancy was 91.3% (up 70bps sequentially and unchanged Y/Y). Notable sequential increases were seen
in Boston (+230bps to 66.2%), Los Angeles (+100bps to 85.0%) and Downtown New York (+140bps to 95.1%). In general, the
U.S. portfolio experienced broad-based occupancy increases on a Q/Q basis (with the exception of Minneapolis).
 Australia – Q2/12 occupancy was 98.1% (+30bps sequentially but down 120bps from Q2/11) as all Australian properties
experienced an uptick in occupancy rates. Perth (+140bps to 97.4%) had the largest sequential improvement compared to Sydney
(+50bps to 98.4%) and Melbourne (+10bps to 97.4%).
 Canada – Q2/12 occupancy was 97.0% (+20bps sequentially and up 80bps Y/Y). Occupancy rates were mixed with notable
strength experienced in the Toronto. Toronto’s occupancy increased by 40bps sequentially, to 94.7%, while Ottawa (unchanged
Q/Q at 99.7%) and Calgary (-20bps Q/Q to 99.6%) experienced slightly weaker results.
Q2/12’s same-property NOI growth was +3.6% on a constant currency basis (+1.5%, including the effect of currency fluctuations).
The Q2 result was a 280bps improvement over Q1/12’s 0.8%, yet was also on the back of an easy “comp” as Q2/11 organic growth
had been -2.5%. The improved Q2/12 result lifted the trailing twelve month organic growth rate to 1.4%, which marked the fastest
growth rate since Q4/10, as shown in Exhibit 1.
Brookfield Office PropertiesAugust 6, 2012
3
Exhibit 1: Historical Portfolio Occupancy1
And Same-Property NOI2
Statistics (Q1/08 to Q2/12)
88%
90%
92%
94%
96%
98%
100%
Q1/08 Q1/09 Q1/10 Q1/11 Q1/12
Canada U.S. Australia Total
-4%
-2%
0%
2%
4%
6%
8%
Q1/08 Q1/09 Q1/10 Q1/11 Q1/12
Same-Property NOI Growth 4Q Moving Average
Source: RBC Capital Markets and Company reports
Notes: 1
Portfolio occupancy statistics include unconsolidated JVs. 2
Historical same-property NOI excludes the impact of FX. Beginning with Q1/10,
same-property NOI is presented on a proportionate basis.
Source: RBC Capital Markets and Company reports
Market Rents Edge Higher– BPO’s overall average market rent estimate of $34.86/sf (net) was marginally higher versus Q1/12 ’s
$34.59/sf. On a regional basis, market rent estimates were mixed, as there were sequential gains in Australia (+3%) and Canada (+1%)
with a modest drop in the U.S. (-1%). As shown in Exhibit 2b, the gap between in-place and market rents was $6.01 (21% in
percentage terms) in Q2/12, slightly lower than $6.16 in Q1/12. While it will take many years for BPO to capture a large component
of this mark-to-market potential, it nonetheless represents a substantial long-term NOI and FFO growth opportunity.
Exhibit 2a: Lease Maturity Profile (in MM sf)
0
2
4
6
2012 2013 2014 2015
U.S. Canada Australia
Exhibit 2b: Average In-Place And Estimated Market Rent (Net)
$20
$25
$30
$35
$40
Q1/08 Q1/09 Q1/10 Q1/11 Q1/12
Average In-Place Rent Average Market Rent
Source: RBC Capital Markets and Company reports
Leasing Velocity Totals 2.6MM In Q2; H2/12 Pipeline Still Looking Strong – In Q2/12, BPO leased 2.6 million sf at an average
year-one net rent of $28.59/sf, representing a substantial +34% spread over the average expiring rent of $21.34/sf. While leasing
spreads are higher than year-ago levels, overall leasing activity has moderated from 2011. In H1/12, BPO leased 3.7 million sf, down
~16% compared to H1/11’s 4.4 million sf. Management continues to suggest a robust pipeline (~3.5 million sf that has either been
signed or is in the documentation or advanced negotiation stages) positions the company well to push occupancy higher by year-end.
Q2/12 leasing highlights include:
 New York (1,300,000 sf) – including a 17-year lease renewal and expansion with Morgan Stanley for 1.2 million sf at One New
York Plaza. The expansion space was part of the early take-back (and related lease termination receipt) from Wachovia.
 Houston (404,000 sf) – including a 5-year, 164,000 sf lease renewal with Chevron at 1600 Smith Street and an 11-year 110,000 sf
new lease with Rosetta Resources at Heritage Plaza.
Brookfield Office PropertiesAugust 6, 2012
4
 Los Angeles (275,000 sf) – including a 3-year, 94,000 sf lease renewal with the U.S. Secret Service and a 10-year, 54,000 sf
renewal and expansion with Jackson Lewis LLP. Both tenants are located in the Ernst & Young Plaza.
Subsequent to the quarter, Management announced that it signed a 91,000 sf lease with Georgetown University at 650 Massachusetts
Avenue, NW, in Washington D.C. The “650 Mass” property is performing ahead of Management’s expectations and is now 97%
leased, up from 72% in December 2010 when Brookfield acquired the building.
Macro Backdrop Takes The Edge Off Of Larger Out-Year Leasing Decisions – Broadly speaking, the ~3 million sf of vacancy
related to the BofAML space at 2 and 4 World Financial Center (“WFC”) continues to be a front and centre concern for investors.
Early this year, Management had outlined a goal of leasing ~50% of the ~3 million sf (set to expire in October of 2013) by the end of
the year. Commentary from Management suggested it’s not given up on this goal, yet the probability of meeting the target is declining.
Citing macro-factors such as: i) lingering macro economic uncertainty; ii) the European debt crisis; and iii) the upcoming U.S.
Presidential election, Management has suggested the attitude of larger tenants (say ~1 million sf or more) has become more subdued,
and that decisions are only being made with respect to near-term (i.e., late 2012 and 2013) lease expiries, or where there is a desire on
behalf of the tenant to consolidate space requirements. The hurdle is that BPO will likely not be in a position to deliver (for physical
occupancy) the WFC space until mid-2014. Therefore it must target larger users with a late-2014/early-2015 lease expiries. And, in
the current environment, many of these prospects are seemingly satisfied to continue to defer on their decisions.
$1.3B Of Properties Acquired Or Under Contract In H1/12; $237MM Of Property Sales – As summarized in Exhibit 3, BPO has
either acquired or agreed to acquire $1.3 billion of properties and development sites in H1/12. Year-to-date, two properties with a total
value of $237 million have been sold. Management has suggested that it could sell another 5 properties having a total value of ~$500
million by year end. RBC Plaza and 33 South Six Street, Minneapolis (aggregate value of $335 million and related debt of $170
million) have been classified as “held for sale” for some time now. 2012 acquisitions have typically included a value-add angle, while
sales would be characterized by smaller properties, those in non-core markets, or those where BPO believes that cash flow and values
have been maximized.
Exhibit 3: 2012 Acquisition and Disposition Activity ($MM, unless noted)
GLA in MM sf Total BPO
Date Property City (ex-parking) Price Debt2
Equity Price/sf Interest Total Equity
2012 Acquisitions
Q1 Bow Parkade Calgary n.a. 90 55 35 n.a. 100% 90 35
Q2 Metropolitan Park East & West Seattle 0.7 210 126 84 $300 100% 210 84
Q2 799 9th Street Washington 0.2 106 72 35 $525 100% 106 35
Q3 London Portfolio - IPP1,2
London 0.7 714 106 608 $992 100% 714 608
Q3 London Portfolio - dev't sites1,2,3
London n.a. 157 0 157 n.a. 100% 157 157
Totals/Averages 1.6 1,277 359 919 $635 1,277 919
2012 Dispositions
Q1 Altius Center Calgary 0.3 180 20 160 $593 100% 180 160
Q1 Defence Plaza Melbourne 0.2 78 47 31 $386 73% 57 23
Totals/Averages 0.5 258 67 191 $510 237 182
BPO Share of:
Notes:
1
The London acquisitions total $871MM and consist of "the Hammerson" portfolio ($829MM) and 50% stake in London Wall Place development site
($42MM)
2
The Hammerson portfolio acquisition will have a staged closing and BPO will assume $106 million of debt in this deal. Phase One will close on Sept
30, 2012 and will include 99 Bishopsgate, Principal Place and other smaller assets (with an estimated cost of $450-500 million) BPO will place new
debt (estimated 50-55% LTV against these properties). Phase 2 will close in June 2013 and will include 125 Old Broad Street and Leaden hall Court.
3
The development sites include 1.4MM sf gross or 1.1MM sf at BPO's share
Source: RBC Capital Markets
The Q2/2012 acquisition highlights include:
Metropolitan Park East & West (Seattle, WA) – On June 5, 2012 Brookfield acquired Metropolitan Park East and West Office
Towers for $210 million (~$300/sf). The purchase of the 699,000 sf Class A property was financed through an acquisition facility
totaling $126 million with the remainder in cash. The region has a large concentration of leading tech and life science companies
and fits into Brookfield’s strategy of owning premier assets situated in high barrier to entry urban markets. Moreover, the
acquisition fits BPO’s goal of further diversify its tenant base towards the high tech, IT and social media sectors.
Brookfield Office PropertiesAugust 6, 2012
5
London, UK Investments – On June 19, 2012 Brookfield agreed to acquire a portfolio of premier office buildings and a
development site in London’s financial district from Hammerson plc for £518 million ($829 million). Subsequent to the quarter,
BPO took assignment of an option agreement for an additional development site (London Wall Place) in a 50/50 JV with Oxford.
In addition to Principal Place, both development sites can now accommodate approximately 1.4 million sf of density. The 50%
stake in London Wall Place has increased the total London investment to $871 million.
The Hammerson portfolio includes four operating assets totaling 884,000 sf (720,000 sf at Brookfield’s ownership). The operating
assets (50% of 125 Old Broad Street, 99 Bishopsgate, Leadenhall Court, and 1 Puddle Dock) are 85% leased. Also included in the
deal are several smaller assets on Shoreditch High Street adjoining Principal Place. For additional details, we refer readers to our
June 19th
note entitled “London Calling: To Acquire £518MM Office And Dev't Portfolio From Hammerson plc”.
While BPO is taking some leasing risk (related to a large 2014 lease expiry), we believe the transaction risk-reward profile appears
favourable. Within the Insurance District (Leadenhall/Bishopsgate), there are a limited number of good quality alternatives, which
leaves BPO encouraged on the leasing front. Offering a going-in yield of 6.0% on the operating assets, BPO believes it can
improve the yield to 7.0% within 3-years (perhaps sooner) with some re-leasing wins. If so, we believe the deal offers good value
creation based upon our view of 5.0% to 5.5% “fair-value” cap rates.
799 9th
Street (Washington, DC) – On June 25, 2012, Brookfield acquired 799 9th Street, NW in Washington, D.C. for $106
million (~$525/sf). The building is a 10-story LEED Gold-certified, Class A office building, with 202,000 sf, which is currently
96% occupied. The property is located in the DC east-end submarket, near two other BPO properties (650 Massachusetts Avenue,
NW and the Victor Building).
All leases at 799 9th
Street expire in December 2012 and January 2013. Hence, the acquisition represents another BPO value-add
acquisition. The deal was funded through new property-level financing of $71.5 million, with the remainder from available cash.
BPO has noted to us that its pro-forma includes a 3-year lease-up assumption, subject to a repositioning program which could
increase the total cost/sf to ~$700-$725. Assuming the building can be leased at a net rent of ~$45/sf, we see to potential for a
stabilized NOI yield approaching 7% and a levered IRR in the low- to mid-teens.
$768 Million Of Corporate Liquidity – On a proportionate basis, Q2/12 liquidity was $768 million, consisting of $301 million of
cash and $467 million of availability under two corporate credit facilities. On this basis, corporate liquidity increased marginally
during Q2, from $705 million at March 31. Exhibit 4 below summarizes and graphically depicts BPO’s liquidity, leverage, and debt
maturity profile.
Exhibit 4: Liquidity and Debt Maturity Profile, Proportionate Basis ($MM, unless noted, continuing operations)
Cash 301
Undrawn Lines 467
Liquidity 768
Lines 348
Res.l & Land Dev. Debt 0
Commercial Property Debt 11,985
Total Debt 12,333
Liquidity as a % of Total Debt 6%
% Unsecured 5%
% Secured 95%
0
1,000
2,000
3,000
4,000
5,000
6,000
Liquidity Lines 2012 2013 2014 2015 2016+
Commercial Property Debt
Note: Brookfield’s consolidated balance sheet contains $847 million of Capital Securities which represents Class AAA perpetual preference shares
outstanding.
Source: RBC Capital Markets and Company reports
Heightened Focus Upon Liquidity Management And Financial Leverage; We Are Comfortable With Sources/Uses, Yet We
See No Reduction From ~50% Gearing – A point of repeated discussion on the recent Q2/12 quarterly conference call related to
BPO’s sources of liquidity and its financial leverage. The tone broadly related to the concern that both might become stretched in light
of capital commitments for pending acquisitions, planned developments and re-leasing/redevelopment requirements.
We believe capital requirements (including committed acquisitions and common dividends) in H2/12 through to the end of 2013 could
total ~$2.0 billion. We have listed these below in Exhibit 5.
Brookfield Office PropertiesAugust 6, 2012
6
Through a combination of existing liquidity, another 18 months of retained earnings, expected up-financings of near-term maturing
mortgages, expected net proceeds from property sales and other potential sources, we have identified $2.8 billion of total available
funds over this time frame, thus leaving BPO with $800 million of leeway. Therefore, our analysis suggests the Company has
adequate liquidity.
Exhibit 5: Estimated Sources And Uses Of Cash, H2/12 Through 2013 ($MM, unless noted)
Expected Uses: Potential Sources:
Hammerson Portfolio Acquisition (Gross Value) 870 Hammerson Portfolio - Assumed Debt 106
WFC Retail Redev't / Office Re-Leasing Capex1
300 Hammerson Portfolio - New Property Debt Arranged 300
Other "Recurring" TI's And Leasing Capex 225 Asset Sales (5 properties; net expected proceeds) 250
Mandatory Mortgage Principal Amortization 155 Mortgage Up-financing (net) 350
Common Dividends 423 Sale of BOX.un Units 150
FFO To Common Shareholders (after preferred divys) 858
Current Liquidity2
768
Total Projected Uses3
1,973 Potential Sources 2,782
Excess Sources Over Uses 809
Notes:
1
We estimate the total outlay to late-2014 could be ~$500MM (~$200MM for retail redevelopment and ~$300MM for office re-tenanting.
2
Proportionate liquidity (in the form of cash and undrawn credit) totaled $768 million as at Q2/12.
3
We assume that new development is a “discretionary” capital outlay and that the primary sources of funds will be dedicated construction facilities.
The ability to fund, at least initially, from such facilities may prove inaccurate as it relates to proceeding with the decking at Manhattan West (may
be funded from current cash/liquidity) and Bay-Adelaide East (pending further pre-leasing from 43%)
Source: RBC Capital Markets and Company reports
On the subject of financial leverage, we currently estimated BPO’s gearing is ~50%, based upon $12.2 billion of proportionately
consolidated debt and $24.7 billion of investment and development properties, at fair value. Participant commentary on Friday’s
quarterly conference call hinted to a concern that leverage might move still upwards. Some also seemed to suggest they would prefer
BPO had lower financial leverage. Our experience suggests that BPO has historically run high-than-average gearing. Our sources and
uses of funds “roll-forward” to Q4/13 also reveals that leverage will continue to hold constant at ~50% out to Q4/13. Hence, gearing
will remain above peer average. Overall, we are comfortable with the debt levels, yet we are cognizant of the higher sensitivity to
equity values in an inherently geared capital structure.
Estimates Adjusted; Likely Lacking FFO/Share Momentum Until Late 2014 – We have tweaked our 2012 FFO/share by +0.01,
to $1.12. We’ve also now assumed that ~3 million sf at WFC becomes vacant, effective Q4/13. Hence our 2013 FFO/unit estimate has
been cut from $1.19 to $1.14.
In is increasingly clear that BPO will have to carry a major chunk of the BofAML space at WFC as vacancy in late 2013 and H1/14.
The degree of FFO/AFFO “hit” during this time frame will, in part, be the product of the accounting policies employed. These policies
are yet to be determined, or at least, yet to be disclosed. Regardless, it would appear to us that the picture is one of declining
FFO/share into H1/14, and at this juncture, it is just a question of magnitude. Hence, BPO’s intermediate-term (to mid-2014)
FFO/share and AFFO/share momentum does not look great. During the transitory period, the shares are likely to trade with greater
emphasis on underlying NAV. Hence, we expect the 2013-2014 FFO and AFFO multiples will appear notably elevated.
The “Value” Name Within The Large-Cap Office REITs – Exhibit 6 on page 7 provides a summarized comparative valuation table
for key larger-cap, U.S office-focused REITs and BPO.
BPO’s AFFO multiple is elevated, and indeed above the peer average in 2013, as we expect Q4/13 and H1/14 to be hit by the lost NOI
associated with ~3 million sf of vacant space at WFC.
With the shares trading a 6.5% implied cap rate and a 19% discount to our $20.75 NAV, BPO would appear to be the “value” stock
within the large-cap office segment. We attribute this to lack of FFO/share and AFFO/share momentum headed into 2013-14 and
investor focus upon the “3L’s” (leasing; liquidity; leverage).
Reiterating $20 Price Target And Sector Perform Rating – Our $20 target price is supported by our NAVPS estimate of $20.75.
Our target price equates to a 28x multiple (formerly 25x) to our 2013 AFFO/share estimate. The increase in our target multiple reflects
the expected “hit” to AFFO in 2013 as the result of a large vacancy. Overall, our price target continues to be underpinned by our
NAVPS estimate. We believe the target multiple, which remains above the average which we apply to the Canadian commercial
property peers, reasonably reflects Brookfield's focus on premier properties in high-barrier-to-entry North American and Australian
cities, its financial leverage, overall franchise value and the expected transitory income “down time” associated with a potential large
vacancy in lower Manhattan. We rate Brookfield's shares Sector Perform, Average Risk.
Brookfield Office PropertiesAugust 6, 2012
7
Exhibit 6: Summarized Comparative Valuation Table – U.S. Office-Focused REITs
Ticker Company 2011 2012E 2013E 2011 2012E 2013E AFFO
BPO-US Brookfield Office Properties Inc. 16.82 20.75 82% 8,474 3.3% 14.7x 15.0x 14.8x 24.4x 24.8x 23.7x 83%
ARE-US Alexandria Real Estate Equities, Inc. 73.55 75.31 97% 4,578 2.8% 16.8x 17.0x 15.4x 19.3x 20.5x 18.4x 57%
BXP-US Boston Properties, Inc. 113.00 100.41 111% 19,012 1.9% 23.3x 23.3x 21.4x 32.3x 34.1x 29.0x 66%
OFC-US Corporate Office Properties Trust 22.58 26.93 82% 1,724 4.9% 29.7x 11.0x 11.1x 15.8x 14.1x 14.5x 69%
DEI-US Douglas Emmett, Inc. 23.86 22.15 107% 4,141 2.5% 17.3x 17.4x 16.8x 24.6x 23.6x 22.1x 59%
CLI-US Mack-Cali Realty Corporation 27.14 30.82 87% 2,714 6.6% 9.7x 10.4x 10.6x 12.7x 14.1x 15.5x 94%
PKY-US Parkway Properties, Inc. 11.12 15.29 72% 328 2.7% 5.1x 9.4x 9.2x 18.5x 25.3x 18.5x 68%
SLG-US SL Green Realty Corp. 81.75 82.33 98% 7,637 1.2% 17.0x 16.6x 16.5x 34.9x 30.1x 27.5x 37%
VNO-US Vornado Realty Trust 85.65 84.56 99% 16,887 3.2% 13.3x 17.2x 17.0x 21.4x 25.5x 24.2x 82%
BPO And Selected U.S. Office REITs 93% 3.2% 16.3x 15.3x 14.7x 22.7x 23.6x 21.5x 68%
Peer Average 94% 3.2% 16.5x 15.3x 14.7x 22.4x 23.4x 21.2x 67%
NAV
'12E PayoutPrice
(US$)
Cap
($MM)
Div.
Yield
Price/
NAV
P/ FFO Multiple P/ AFFO Multiple
Source: RBC Capital Markets estimates for Brookfield Office Properties; U.S. Office REIT estimates sourced from SNL
Brookfield Office PropertiesAugust 6, 2012
8
Valuation
Our $20 one-year price target is determined via the application of a 28x multiple to our 2013 AFFO/unit estimate. We believe our
target multiple reasonably reflects Brookfield's focus on premier properties in high-barrier-to-entry North American and Australian
cities, its financial leverage, and overall franchise value. We rate Brookfield's shares Sector Perform, Average Risk.
Price Target Impediment
Impediments to the achievement of our price target include but are not limited to: the risks associated with the ownership of real
property; and the company's high exposure to the New York City office market, the financial services industry, and certain major
tenants.
Company Description
BPO owns, develops, and manages premier quality office properties in high-growth and high-barrier markets. The commercial
property portfolio includes >100 commercial properties encompassing 80 million sf concentrated in central business districts across
North America and Australia. The portfolio includes such landmark assets as the World Financial Center and Brookfield Place.
Brookfield also holds interests in ~15 million sf of development properties in its major markets.
Brookfield Office PropertiesAugust 6, 2012
9
Required Disclosures
Non-U.S. Analyst Disclosure
Michael Markidis, Kevin Cheng and Wayne Che (i) are not registered/qualified as research analysts with the NYSE and/or FINRA and
(ii) may not be associated persons of the RBC Capital Markets, LLC and therefore may not be subject to FINRA Rule 2711 and NYSE
Rule 472 restrictions on communications with a subject company, public appearances and trading securities held by a research analyst
account.
Conflicts Disclosures
The analyst(s) responsible for preparing this research report received compensation that is based upon various factors, including total
revenues of the member companies of RBC Capital Markets and its affiliates, a portion of which are or have been generated by
investment banking activities of the member companies of RBC Capital Markets and its affiliates.
A member company of RBC Capital Markets or one of its affiliates managed or co-managed a public offering of securities for
Brookfield Office Properties in the past 12 months.
A member company of RBC Capital Markets or one of its affiliates received compensation for investment banking services from
Brookfield Office Properties in the past 12 months.
RBC Capital Markets, LLC makes a market in the securities of Brookfield Office Properties and may act as principal with regard to
sales or purchases of this security.
Royal Bank of Canada, together with its affiliates, beneficially owns 1 percent or more of a class of common equity securities of
Brookfield Office Properties.
A member company of RBC Capital Markets or one of its affiliates received compensation for products or services other than
investment banking services from Brookfield Office Properties during the past 12 months. During this time, a member company of
RBC Capital Markets or one of its affiliates provided non-investment banking securities-related services to Brookfield Office
Properties.
A member company of RBC Capital Markets or one of its affiliates received compensation for products or services other than
investment banking services from Brookfield Office Properties during the past 12 months. During this time, a member company of
RBC Capital Markets or one of its affiliates provided non-securities services to Brookfield Office Properties.
RBC Capital Markets has provided Brookfield Office Properties with investment banking services in the past 12 months.
RBC Capital Markets has provided Brookfield Office Properties with non-investment banking securities-related services in the past 12
months.
RBC Capital Markets has provided Brookfield Office Properties with non-securities services in the past 12 months.
The author is employed by RBC Dominion Securities Inc., a securities broker-dealer with principal offices located in Toronto, Canada.
Explanation of RBC Capital Markets Equity Rating System
An analyst's 'sector' is the universe of companies for which the analyst provides research coverage. Accordingly, the rating assigned to
a particular stock represents solely the analyst's view of how that stock will perform over the next 12 months relative to the analyst's
sector average.
Ratings
Top Pick (TP): Represents analyst's best idea in the sector; expected to provide significant absolute total return over 12 months with a
favorable risk-reward ratio.
Outperform (O): Expected to materially outperform sector average over 12 months.
Sector Perform (SP): Returns expected to be in line with sector average over 12 months.
Underperform (U): Returns expected to be materially below sector average over 12 months.
Risk Qualifiers (any of the following criteria may be present):
Average Risk (Avg): Volatility and risk expected to be comparable to sector; average revenue and earnings predictability; no
significant cash flow/financing concerns over coming 12-24 months; fairly liquid.
Above Average Risk (AA): Volatility and risk expected to be above sector; below average revenue and earnings predictability; may
not be suitable for a significant class of individual equity investors; may have negative cash flow; low market cap or float.
Speculative (Spec): Risk consistent with venture capital; low public float; potential balance sheet concerns; risk of being delisted.
Distribution of Ratings
Brookfield Office PropertiesAugust 6, 2012
10
For the purpose of ratings distributions, regulatory rules require member firms to assign ratings to one of three rating categories - Buy,
Hold/Neutral, or Sell - regardless of a firm's own rating categories. Although RBC Capital Markets' ratings of Top Pick/Outperform,
Sector Perform and Underperform most closely correspond to Buy, Hold/Neutral and Sell, respectively, the meanings are not the same
because our ratings are determined on a relative basis (as described above).
Distribution of Ratings
RBC Capital Markets, Equity Research
Investment Banking
Serv./Past 12 Mos.
Rating Count Percent Count Percent
BUY[TP/O] 772 51.92 224 29.02
HOLD[SP] 648 43.58 152 23.46
SELL[U] 67 4.51 2 2.99
Q2 Q3 Q1 Q2 Q3 Q1 Q2 Q3 Q1 Q2 Q3
6
9
12
15
18
21
2010 2011 2012
10/29/09
OP:12.75
01/11/10
OP:14
02/05/10
OP:15
04/06/10
OP:17.5
09/03/10
OP:18.25
11/01/10
OP:18.75
05/06/11
SP:21
11/07/11
SP:19
07/18/12
SP:20
Rating and Price Target History for: Brookfield Office Properties as of 08-03-2012 (in USD)
Legend:
TP: Top Pick; O: Outperform; SP: Sector Perform; U: Underperform; I: Initiation of Research Coverage; D: Discontinuation of Research Coverage; NR: Not Rated; NA: Not Available;
RL: Recommended List - RL: On: Refers to date a security was placed on a recommended list, while RL Off: Refers to date a security was removed from a recommended list.
Created by BlueMatrix
References to a Recommended List in the recommendation history chart may include one or more recommended lists or model
portfolios maintained by a business unit of the Wealth Management Division of RBC Capital Markets, LLC. These Recommended
Lists include a former list called the Prime Opportunity List (RL 3), the Guided Portfolio: Prime Income (RL 6), the Guided Portfolio:
Large Cap (RL 7), Guided Portfolio: Dividend Growth (RL 8), the Guided Portfolio: Midcap 111 (RL9), and the Guided Portfolio:
ADR (RL 10). The abbreviation 'RL On' means the date a security was placed on a Recommended List. The abbreviation 'RL Off'
means the date a security was removed from a Recommended List.
Conflicts Policy
RBC Capital Markets Policy for Managing Conflicts of Interest in Relation to Investment Research is available from us on request. To
access our current policy, clients should refer to
https://www.rbccm.com/global/file-414164.pdf
or send a request to RBC CM Research Publishing, P.O. Box 50, 200 Bay Street, Royal Bank Plaza, 29th Floor, South Tower,
Toronto, Ontario M5J 2W7. We reserve the right to amend or supplement this policy at any time.
Dissemination of Research and Short-Term Trade Ideas
RBC Capital Markets endeavors to make all reasonable efforts to provide research simultaneously to all eligible clients, having regard
to local time zones in overseas jurisdictions. RBC Capital Markets' research is posted to our proprietary websites to ensure eligible
clients receive coverage initiations and changes in ratings, targets and opinions in a timely manner. Additional distribution may be
done by the sales personnel via email, fax or regular mail. Clients may also receive our research via third-party vendors. Please contact
your investment advisor or institutional salesperson for more information regarding RBC Capital Markets' research. RBC Capital
Markets also provides eligible clients with access to SPARC on its proprietary INSIGHT website. SPARC contains market color and
commentary, and may also contain Short-Term Trade Ideas regarding the securities of subject companies discussed in this or other
Brookfield Office PropertiesAugust 6, 2012
11
research reports. SPARC may be accessed via the following hyperlink: https://www.rbcinsight.com. A Short-Term Trade Idea reflects
the research analyst's directional view regarding the price of the security of a subject company in the coming days or weeks, based on
market and trading events. A Short-Term Trade Idea may differ from the price targets and/or recommendations in our published
research reports reflecting the research analyst's views of the longer-term (one year) prospects of the subject company, as a result of
the differing time horizons, methodologies and/or other factors. Thus, it is possible that the security of a subject company that is
considered a long-term 'Sector Perform' or even an 'Underperform' might be a short-term buying opportunity as a result of temporary
selling pressure in the market; conversely, the security of a subject company that is rated a long-term 'Outperform' could be considered
susceptible to a short-term downward price correction. Short-Term Trade Ideas are not ratings, nor are they part of any ratings system,
and RBC Capital Markets generally does not intend, nor undertakes any obligation, to maintain or update Short-Term Trade Ideas.
Short-Term Trade Ideas discussed in SPARC may not be suitable for all investors and have not been tailored to individual investor
circumstances and objectives, and investors should make their own independent decisions regarding any Short-Term Trade Ideas
discussed therein.
Analyst Certification
All of the views expressed in this report accurately reflect the personal views of the responsible analyst(s) about any and all of the
subject securities or issuers. No part of the compensation of the responsible analyst(s) named herein is, or will be, directly or
indirectly, related to the specific recommendations or views expressed by the responsible analyst(s) in this report.
The Global Industry Classification Standard (“GICS”) was developed by and is the exclusive property and a service mark of MSCI Inc. (“MSCI”) and Standard & Poor’s Financial Services
LLC (“S&P”) and is licensed for use by RBC. Neither MSCI, S&P, nor any other party involved in making or compiling the GICS or any GICS classifications makes any express or implied
warranties or representations with respect to such standard or classification (or the results to be obtained by the use thereof), and all such parties hereby expressly disclaim all warranties of
originality, accuracy, completeness, merchantability and fitness for a particular purpose with respect to any of such standard or classification. Without limiting any of the foregoing, in no event
shall MSCI, S&P, any of their affiliates or any third party involved in making or compiling the GICS or any GICS classifications have any liability for any direct, indirect, special, punitive,
consequential or any other damages (including lost profits) even if notified of the possibility of such damages.
Disclaimer
RBC Capital Markets is the business name used by certain branches and subsidiaries of the Royal Bank of Canada, including RBC Dominion Securities Inc., RBC
Capital Markets, LLC, RBC Europe Limited, RBC Capital Markets (Hong Kong) Limited, Royal Bank of Canada, Hong Kong Branch and Royal Bank of Canada,
Sydney Branch. The information contained in this report has been compiled by RBC Capital Markets from sources believed to be reliable, but no representation or
warranty, express or implied, is made by Royal Bank of Canada, RBC Capital Markets, its affiliates or any other person as to its accuracy, completeness or correctness.
All opinions and estimates contained in this report constitute RBC Capital Markets' judgement as of the date of this report, are subject to change without notice and are
provided in good faith but without legal responsibility. Nothing in this report constitutes legal, accounting or tax advice or individually tailored investment advice. This
material is prepared for general circulation to clients and has been prepared without regard to the individual financial circumstances and objectives of persons who
receive it. The investments or services contained in this report may not be suitable for you and it is recommended that you consult an independent investment advisor if
you are in doubt about the suitability of such investments or services. This report is not an offer to sell or a solicitation of an offer to buy any securities. Past
performance is not a guide to future performance, future returns are not guaranteed, and a loss of original capital may occur. RBC Capital Markets research analyst
compensation is based in part on the overall profitability of RBC Capital Markets, which includes profits attributable to investment banking revenues. Every province in
Canada, state in the U.S., and most countries throughout the world have their own laws regulating the types of securities and other investment products which may be
offered to their residents, as well as the process for doing so. As a result, the securities discussed in this report may not be eligible for sale in some jurisdictions. RBC
Capital Markets may be restricted from publishing research reports, from time to time, due to regulatory restrictions and/or internal compliance policies. If this is the
case, the latest published research reports available to clients may not reflect recent material changes in the applicable industry and/or applicable subject companies.
RBC Capital Markets research reports are current only as of the date set forth on the research reports. This report is not, and under no circumstances should be construed
as, a solicitation to act as securities broker or dealer in any jurisdiction by any person or company that is not legally permitted to carry on the business of a securities
broker or dealer in that jurisdiction. To the full extent permitted by law neither RBC Capital Markets nor any of its affiliates, nor any other person, accepts any liability
whatsoever for any direct or consequential loss arising from any use of this report or the information contained herein. No matter contained in this document may be
reproduced or copied by any means without the prior consent of RBC Capital Markets.
Additional information is available on request.
To U.S. Residents:
This publication has been approved by RBC Capital Markets, LLC (member FINRA, NYSE, SIPC), which is a U.S. registered broker-dealer and which accepts
responsibility for this report and its dissemination in the United States. Any U.S. recipient of this report that is not a registered broker-dealer or a bank acting in a broker
or dealer capacity and that wishes further information regarding, or to effect any transaction in, any of the securities discussed in this report, should contact and place
orders with RBC Capital Markets, LLC.
To Canadian Residents:
This publication has been approved by RBC Dominion Securities Inc.(member IIROC). Any Canadian recipient of this report that is not a Designated Institution in
Ontario, an Accredited Investor in British Columbia or Alberta or a Sophisticated Purchaser in Quebec (or similar permitted purchaser in any other province) and that
wishes further information regarding, or to effect any transaction in, any of the securities discussed in this report should contact and place orders with RBC Dominion
Securities Inc., which, without in any way limiting the foregoing, accepts responsibility for this report and its dissemination in Canada.
To U.K. Residents:
This publication has been approved by RBC Europe Limited ('RBCEL') which is authorized and regulated by Financial Services Authority ('FSA'), in connection with
its distribution in the United Kingdom. This material is not for general distribution in the United Kingdom to retail clients, as defined under the rules of the FSA.
However, targeted distribution may be made to selected retail clients of RBC and its affiliates. RBCEL accepts responsibility for this report and its dissemination in the
United Kingdom.
To Persons Receiving This Advice in Australia:
This material has been distributed in Australia by Royal Bank of Canada - Sydney Branch (ABN 86 076 940 880, AFSL No. 246521). This material has been prepared
for general circulation and does not take into account the objectives, financial situation or needs of any recipient. Accordingly, any recipient should, before acting on
this material, consider the appropriateness of this material having regard to their objectives, financial situation and needs. If this material relates to the acquisition or
possible acquisition of a particular financial product, a recipient in Australia should obtain any relevant disclosure document prepared in respect of that product and
consider that document before making any decision about whether to acquire the product.
To Hong Kong Residents:
Brookfield Office PropertiesAugust 6, 2012
12
This publication is distributed in Hong Kong by RBC Investment Services (Asia) Limited, RBC Investment Management (Asia) Limited and RBC Capital Markets
(Hong Kong) Limited, licensed corporations under the Securities and Futures Ordinance or, by the Royal Bank of Canada, Hong Kong Branch, a registered institution
under the Securities and Futures Ordinance. This material has been prepared for general circulation and does not take into account the objectives, financial situation, or
needs of any recipient. Hong Kong persons wishing to obtain further information on any of the securities mentioned in this publication should contact RBC Investment
Services (Asia) Limited, RBC Investment Management (Asia) Limited, RBC Capital Markets (Hong Kong) Limited or Royal Bank of Canada, Hong Kong Branch at
17/Floor, Cheung Kong Center, 2 Queen's Road Central, Hong Kong (telephone number is 2848-1388).
To Singapore Residents:
This publication is distributed in Singapore by the Royal Bank of Canada, Singapore Branch and Royal Bank of Canada (Asia) Limited, registered entities granted
offshore bank and merchant bank status by the Monetary Authority of Singapore, respectively. This material has been prepared for general circulation and does not take
into account the objectives, financial situation, or needs of any recipient. You are advised to seek independent advice from a financial adviser before purchasing any
product. If you do not obtain independent advice, you should consider whether the product is suitable for you. Past performance is not indicative of future performance.
If you have any questions related to this publication, please contact the Royal Bank of Canada, Singapore Branch or Royal Bank of Canada (Asia) Limited.
To Japanese Residents:
Unless otherwise exempted by Japanese law, this publication is distributed in Japan by or through RBC Capital Markets (Japan) Ltd., a registered type one financial
instruments firm and/or Royal Bank of Canada, Tokyo Branch, a licensed foreign bank.
.® Registered trademark of Royal Bank of Canada. RBC Capital Markets is a trademark of Royal Bank of Canada. Used under license.
Copyright © RBC Capital Markets, LLC 2012 - Member SIPC
Copyright © RBC Dominion Securities Inc. 2012 - Member CIPF
Copyright © RBC Europe Limited 2012
Copyright © Royal Bank of Canada 2012
All rights reserved
Brookfield Office PropertiesAugust 6, 2012

More Related Content

What's hot

fifth third bancorp Q1-05
fifth third bancorp  Q1-05fifth third bancorp  Q1-05
fifth third bancorp Q1-05finance28
 
ball A703681C-5942-4494-98E0-12B19BC5AE3F_4Q2008ConfCallTranscript_Ball
ball   A703681C-5942-4494-98E0-12B19BC5AE3F_4Q2008ConfCallTranscript_Ballball   A703681C-5942-4494-98E0-12B19BC5AE3F_4Q2008ConfCallTranscript_Ball
ball A703681C-5942-4494-98E0-12B19BC5AE3F_4Q2008ConfCallTranscript_Ballfinance31
 
Chapter15 International Finance Management
Chapter15 International Finance ManagementChapter15 International Finance Management
Chapter15 International Finance ManagementPiyush Gaur
 
2004 Q4 TRW Auto Earnings Presentation
2004 Q4 TRW Auto Earnings Presentation 2004 Q4 TRW Auto Earnings Presentation
2004 Q4 TRW Auto Earnings Presentation finance18
 
Avant Garde wealth Mgmt - Quarterly letter - 1303
Avant Garde wealth Mgmt - Quarterly letter - 1303Avant Garde wealth Mgmt - Quarterly letter - 1303
Avant Garde wealth Mgmt - Quarterly letter - 1303Gaurav Jalan
 
2007 Q4 TRW Auto Earnings Presentation
2007 Q4 TRW Auto Earnings Presentation 2007 Q4 TRW Auto Earnings Presentation
2007 Q4 TRW Auto Earnings Presentation finance18
 
fifth third bancorp Q3-06
fifth third bancorp  Q3-06fifth third bancorp  Q3-06
fifth third bancorp Q3-06finance28
 
ConAgra Q2Dec04
ConAgra Q2Dec04ConAgra Q2Dec04
ConAgra Q2Dec04finance21
 
Chapter10 International Finance Management
Chapter10 International Finance ManagementChapter10 International Finance Management
Chapter10 International Finance ManagementPiyush Gaur
 
Aegon: simplification and growth
Aegon: simplification and growthAegon: simplification and growth
Aegon: simplification and growthAegon
 
morgan stanley Earnings Archive 2008 3rd
morgan stanley Earnings Archive 2008 3rd morgan stanley Earnings Archive 2008 3rd
morgan stanley Earnings Archive 2008 3rd finance2
 
fifth third bancorp Q2-03
fifth third bancorp  Q2-03fifth third bancorp  Q2-03
fifth third bancorp Q2-03finance28
 

What's hot (13)

fifth third bancorp Q1-05
fifth third bancorp  Q1-05fifth third bancorp  Q1-05
fifth third bancorp Q1-05
 
ball A703681C-5942-4494-98E0-12B19BC5AE3F_4Q2008ConfCallTranscript_Ball
ball   A703681C-5942-4494-98E0-12B19BC5AE3F_4Q2008ConfCallTranscript_Ballball   A703681C-5942-4494-98E0-12B19BC5AE3F_4Q2008ConfCallTranscript_Ball
ball A703681C-5942-4494-98E0-12B19BC5AE3F_4Q2008ConfCallTranscript_Ball
 
Chapter15 International Finance Management
Chapter15 International Finance ManagementChapter15 International Finance Management
Chapter15 International Finance Management
 
2004 Q4 TRW Auto Earnings Presentation
2004 Q4 TRW Auto Earnings Presentation 2004 Q4 TRW Auto Earnings Presentation
2004 Q4 TRW Auto Earnings Presentation
 
Avant Garde wealth Mgmt - Quarterly letter - 1303
Avant Garde wealth Mgmt - Quarterly letter - 1303Avant Garde wealth Mgmt - Quarterly letter - 1303
Avant Garde wealth Mgmt - Quarterly letter - 1303
 
2007 Q4 TRW Auto Earnings Presentation
2007 Q4 TRW Auto Earnings Presentation 2007 Q4 TRW Auto Earnings Presentation
2007 Q4 TRW Auto Earnings Presentation
 
fifth third bancorp Q3-06
fifth third bancorp  Q3-06fifth third bancorp  Q3-06
fifth third bancorp Q3-06
 
ConAgra Q2Dec04
ConAgra Q2Dec04ConAgra Q2Dec04
ConAgra Q2Dec04
 
Chapter10 International Finance Management
Chapter10 International Finance ManagementChapter10 International Finance Management
Chapter10 International Finance Management
 
Aegon: simplification and growth
Aegon: simplification and growthAegon: simplification and growth
Aegon: simplification and growth
 
Q3 2009 Earning Report of Goldman Sachs
Q3 2009 Earning Report of Goldman SachsQ3 2009 Earning Report of Goldman Sachs
Q3 2009 Earning Report of Goldman Sachs
 
morgan stanley Earnings Archive 2008 3rd
morgan stanley Earnings Archive 2008 3rd morgan stanley Earnings Archive 2008 3rd
morgan stanley Earnings Archive 2008 3rd
 
fifth third bancorp Q2-03
fifth third bancorp  Q2-03fifth third bancorp  Q2-03
fifth third bancorp Q2-03
 

Similar to Brookfield Office Properties - BPO - Quarterly Earnings

First Capital Realty - FCR
First Capital Realty - FCRFirst Capital Realty - FCR
First Capital Realty - FCRKevin Cheng, CFA
 
Earnings 4Q15 Presentation
Earnings 4Q15 PresentationEarnings 4Q15 Presentation
Earnings 4Q15 Presentationir_digitalrealty
 
Colliers DC YE Report 2014 V11
Colliers DC YE Report 2014 V11Colliers DC YE Report 2014 V11
Colliers DC YE Report 2014 V11William E. Kaye
 
Tricumen / Capital Markets: Results Review 4Q13/FY13_OPEN
Tricumen / Capital Markets: Results Review 4Q13/FY13_OPENTricumen / Capital Markets: Results Review 4Q13/FY13_OPEN
Tricumen / Capital Markets: Results Review 4Q13/FY13_OPENTricumen Ltd
 
Mergers & Acquisitions and Capital Market Update
Mergers & Acquisitions and Capital Market UpdateMergers & Acquisitions and Capital Market Update
Mergers & Acquisitions and Capital Market UpdateSSDlaw
 
Market Strategy - October 2010
Market Strategy - October 2010Market Strategy - October 2010
Market Strategy - October 2010Angel Broking
 
The Deloitte M&A Index 2016
The Deloitte M&A Index 2016The Deloitte M&A Index 2016
The Deloitte M&A Index 2016Deloitte UK
 
The Deloitte M&A Index 2016
The Deloitte M&A Index 2016The Deloitte M&A Index 2016
The Deloitte M&A Index 2016Deloitte UK
 
Trc q1 2016 earnings slides final
Trc q1 2016 earnings slides finalTrc q1 2016 earnings slides final
Trc q1 2016 earnings slides finaltrcsolutions
 
Tricumen / Capital Markets: Results Review 1Q14
Tricumen / Capital Markets: Results Review 1Q14Tricumen / Capital Markets: Results Review 1Q14
Tricumen / Capital Markets: Results Review 1Q14Tricumen Ltd
 
Finance Management for senior engineers of GENCO
Finance Management for senior engineers of GENCOFinance Management for senior engineers of GENCO
Finance Management for senior engineers of GENCOManohar Tatwawadi
 
Melbourne IT H1 2011 Investor Presentation
Melbourne IT H1 2011 Investor PresentationMelbourne IT H1 2011 Investor Presentation
Melbourne IT H1 2011 Investor PresentationMelbourne IT
 
Credit Corp (CCP) - leading indicators in consumer debt recovery sector
Credit Corp (CCP) - leading indicators in consumer debt recovery sector Credit Corp (CCP) - leading indicators in consumer debt recovery sector
Credit Corp (CCP) - leading indicators in consumer debt recovery sector George Gabriel
 
Exxon Mobil Fourth Quarter Financial Results Earnings Call Q4 2016 - Presenta...
Exxon Mobil Fourth Quarter Financial Results Earnings Call Q4 2016 - Presenta...Exxon Mobil Fourth Quarter Financial Results Earnings Call Q4 2016 - Presenta...
Exxon Mobil Fourth Quarter Financial Results Earnings Call Q4 2016 - Presenta...OILWIRE
 
Hilltop decorrelated fund september 2013 factsheet
Hilltop decorrelated fund september 2013 factsheetHilltop decorrelated fund september 2013 factsheet
Hilltop decorrelated fund september 2013 factsheetJohn Robertson
 
LGIP 3rd Quarter
LGIP 3rd QuarterLGIP 3rd Quarter
LGIP 3rd Quarterdougducey
 
Hcc ru2 qfy2011-291010
Hcc ru2 qfy2011-291010Hcc ru2 qfy2011-291010
Hcc ru2 qfy2011-291010Angel Broking
 
Final LEG project copy
Final LEG project copyFinal LEG project copy
Final LEG project copyEric Nielsen
 
Trc q2 2015 earnings slides final
Trc q2 2015 earnings slides finalTrc q2 2015 earnings slides final
Trc q2 2015 earnings slides finaltrcsolutions
 

Similar to Brookfield Office Properties - BPO - Quarterly Earnings (20)

First Capital Realty - FCR
First Capital Realty - FCRFirst Capital Realty - FCR
First Capital Realty - FCR
 
Fls Week 2 Additional Research
Fls Week 2   Additional ResearchFls Week 2   Additional Research
Fls Week 2 Additional Research
 
Earnings 4Q15 Presentation
Earnings 4Q15 PresentationEarnings 4Q15 Presentation
Earnings 4Q15 Presentation
 
Colliers DC YE Report 2014 V11
Colliers DC YE Report 2014 V11Colliers DC YE Report 2014 V11
Colliers DC YE Report 2014 V11
 
Tricumen / Capital Markets: Results Review 4Q13/FY13_OPEN
Tricumen / Capital Markets: Results Review 4Q13/FY13_OPENTricumen / Capital Markets: Results Review 4Q13/FY13_OPEN
Tricumen / Capital Markets: Results Review 4Q13/FY13_OPEN
 
Mergers & Acquisitions and Capital Market Update
Mergers & Acquisitions and Capital Market UpdateMergers & Acquisitions and Capital Market Update
Mergers & Acquisitions and Capital Market Update
 
Market Strategy - October 2010
Market Strategy - October 2010Market Strategy - October 2010
Market Strategy - October 2010
 
The Deloitte M&A Index 2016
The Deloitte M&A Index 2016The Deloitte M&A Index 2016
The Deloitte M&A Index 2016
 
The Deloitte M&A Index 2016
The Deloitte M&A Index 2016The Deloitte M&A Index 2016
The Deloitte M&A Index 2016
 
Trc q1 2016 earnings slides final
Trc q1 2016 earnings slides finalTrc q1 2016 earnings slides final
Trc q1 2016 earnings slides final
 
Tricumen / Capital Markets: Results Review 1Q14
Tricumen / Capital Markets: Results Review 1Q14Tricumen / Capital Markets: Results Review 1Q14
Tricumen / Capital Markets: Results Review 1Q14
 
Finance Management for senior engineers of GENCO
Finance Management for senior engineers of GENCOFinance Management for senior engineers of GENCO
Finance Management for senior engineers of GENCO
 
Melbourne IT H1 2011 Investor Presentation
Melbourne IT H1 2011 Investor PresentationMelbourne IT H1 2011 Investor Presentation
Melbourne IT H1 2011 Investor Presentation
 
Credit Corp (CCP) - leading indicators in consumer debt recovery sector
Credit Corp (CCP) - leading indicators in consumer debt recovery sector Credit Corp (CCP) - leading indicators in consumer debt recovery sector
Credit Corp (CCP) - leading indicators in consumer debt recovery sector
 
Exxon Mobil Fourth Quarter Financial Results Earnings Call Q4 2016 - Presenta...
Exxon Mobil Fourth Quarter Financial Results Earnings Call Q4 2016 - Presenta...Exxon Mobil Fourth Quarter Financial Results Earnings Call Q4 2016 - Presenta...
Exxon Mobil Fourth Quarter Financial Results Earnings Call Q4 2016 - Presenta...
 
Hilltop decorrelated fund september 2013 factsheet
Hilltop decorrelated fund september 2013 factsheetHilltop decorrelated fund september 2013 factsheet
Hilltop decorrelated fund september 2013 factsheet
 
LGIP 3rd Quarter
LGIP 3rd QuarterLGIP 3rd Quarter
LGIP 3rd Quarter
 
Hcc ru2 qfy2011-291010
Hcc ru2 qfy2011-291010Hcc ru2 qfy2011-291010
Hcc ru2 qfy2011-291010
 
Final LEG project copy
Final LEG project copyFinal LEG project copy
Final LEG project copy
 
Trc q2 2015 earnings slides final
Trc q2 2015 earnings slides finalTrc q2 2015 earnings slides final
Trc q2 2015 earnings slides final
 

More from Kevin Cheng, CFA

Equity Strategy - Consumer Staples
Equity Strategy - Consumer StaplesEquity Strategy - Consumer Staples
Equity Strategy - Consumer StaplesKevin Cheng, CFA
 
CXP initiation - Office REIT
CXP initiation - Office REITCXP initiation - Office REIT
CXP initiation - Office REITKevin Cheng, CFA
 
Canadian Asset Managers - Initiation Report
Canadian Asset Managers - Initiation ReportCanadian Asset Managers - Initiation Report
Canadian Asset Managers - Initiation ReportKevin Cheng, CFA
 
Equity Strategy - Staying Defensive
Equity Strategy - Staying DefensiveEquity Strategy - Staying Defensive
Equity Strategy - Staying DefensiveKevin Cheng, CFA
 
Asset Managers - Recession risks, Trust Banks & Asset Mgrs
Asset Managers - Recession risks, Trust Banks & Asset MgrsAsset Managers - Recession risks, Trust Banks & Asset Mgrs
Asset Managers - Recession risks, Trust Banks & Asset MgrsKevin Cheng, CFA
 
Asset Managers - Defensive But Not Immune
Asset Managers - Defensive But Not ImmuneAsset Managers - Defensive But Not Immune
Asset Managers - Defensive But Not ImmuneKevin Cheng, CFA
 

More from Kevin Cheng, CFA (13)

Equity Strategy - Consumer Staples
Equity Strategy - Consumer StaplesEquity Strategy - Consumer Staples
Equity Strategy - Consumer Staples
 
Equity Strategy - TSX
Equity Strategy - TSXEquity Strategy - TSX
Equity Strategy - TSX
 
Focus - Economic Research
Focus - Economic ResearchFocus - Economic Research
Focus - Economic Research
 
DEA Initiation Report
DEA Initiation ReportDEA Initiation Report
DEA Initiation Report
 
CXP initiation - Office REIT
CXP initiation - Office REITCXP initiation - Office REIT
CXP initiation - Office REIT
 
Canadian Asset Managers - Initiation Report
Canadian Asset Managers - Initiation ReportCanadian Asset Managers - Initiation Report
Canadian Asset Managers - Initiation Report
 
Agf market outlook
Agf market outlookAgf market outlook
Agf market outlook
 
Equity Strategy - Staying Defensive
Equity Strategy - Staying DefensiveEquity Strategy - Staying Defensive
Equity Strategy - Staying Defensive
 
Asset Managers - Recession risks, Trust Banks & Asset Mgrs
Asset Managers - Recession risks, Trust Banks & Asset MgrsAsset Managers - Recession risks, Trust Banks & Asset Mgrs
Asset Managers - Recession risks, Trust Banks & Asset Mgrs
 
Asset Managers - Defensive But Not Immune
Asset Managers - Defensive But Not ImmuneAsset Managers - Defensive But Not Immune
Asset Managers - Defensive But Not Immune
 
The deleveraging cycle
The deleveraging cycleThe deleveraging cycle
The deleveraging cycle
 
Market Strategy
Market StrategyMarket Strategy
Market Strategy
 
U.S. Real Rates
U.S. Real RatesU.S. Real Rates
U.S. Real Rates
 

Recently uploaded

Independent Call Girl Number in Kurla Mumbai📲 Pooja Nehwal 9892124323 💞 Full ...
Independent Call Girl Number in Kurla Mumbai📲 Pooja Nehwal 9892124323 💞 Full ...Independent Call Girl Number in Kurla Mumbai📲 Pooja Nehwal 9892124323 💞 Full ...
Independent Call Girl Number in Kurla Mumbai📲 Pooja Nehwal 9892124323 💞 Full ...Pooja Nehwal
 
Solution Manual for Principles of Corporate Finance 14th Edition by Richard B...
Solution Manual for Principles of Corporate Finance 14th Edition by Richard B...Solution Manual for Principles of Corporate Finance 14th Edition by Richard B...
Solution Manual for Principles of Corporate Finance 14th Edition by Richard B...ssifa0344
 
The Economic History of the U.S. Lecture 17.pdf
The Economic History of the U.S. Lecture 17.pdfThe Economic History of the U.S. Lecture 17.pdf
The Economic History of the U.S. Lecture 17.pdfGale Pooley
 
The Economic History of the U.S. Lecture 23.pdf
The Economic History of the U.S. Lecture 23.pdfThe Economic History of the U.S. Lecture 23.pdf
The Economic History of the U.S. Lecture 23.pdfGale Pooley
 
06_Joeri Van Speybroek_Dell_MeetupDora&Cybersecurity.pdf
06_Joeri Van Speybroek_Dell_MeetupDora&Cybersecurity.pdf06_Joeri Van Speybroek_Dell_MeetupDora&Cybersecurity.pdf
06_Joeri Van Speybroek_Dell_MeetupDora&Cybersecurity.pdfFinTech Belgium
 
High Class Call Girls Nashik Maya 7001305949 Independent Escort Service Nashik
High Class Call Girls Nashik Maya 7001305949 Independent Escort Service NashikHigh Class Call Girls Nashik Maya 7001305949 Independent Escort Service Nashik
High Class Call Girls Nashik Maya 7001305949 Independent Escort Service NashikCall Girls in Nagpur High Profile
 
Dividend Policy and Dividend Decision Theories.pptx
Dividend Policy and Dividend Decision Theories.pptxDividend Policy and Dividend Decision Theories.pptx
Dividend Policy and Dividend Decision Theories.pptxanshikagoel52
 
Pooja 9892124323 : Call Girl in Juhu Escorts Service Free Home Delivery
Pooja 9892124323 : Call Girl in Juhu Escorts Service Free Home DeliveryPooja 9892124323 : Call Girl in Juhu Escorts Service Free Home Delivery
Pooja 9892124323 : Call Girl in Juhu Escorts Service Free Home DeliveryPooja Nehwal
 
05_Annelore Lenoir_Docbyte_MeetupDora&Cybersecurity.pptx
05_Annelore Lenoir_Docbyte_MeetupDora&Cybersecurity.pptx05_Annelore Lenoir_Docbyte_MeetupDora&Cybersecurity.pptx
05_Annelore Lenoir_Docbyte_MeetupDora&Cybersecurity.pptxFinTech Belgium
 
Log your LOA pain with Pension Lab's brilliant campaign
Log your LOA pain with Pension Lab's brilliant campaignLog your LOA pain with Pension Lab's brilliant campaign
Log your LOA pain with Pension Lab's brilliant campaignHenry Tapper
 
The Economic History of the U.S. Lecture 19.pdf
The Economic History of the U.S. Lecture 19.pdfThe Economic History of the U.S. Lecture 19.pdf
The Economic History of the U.S. Lecture 19.pdfGale Pooley
 
The Economic History of the U.S. Lecture 20.pdf
The Economic History of the U.S. Lecture 20.pdfThe Economic History of the U.S. Lecture 20.pdf
The Economic History of the U.S. Lecture 20.pdfGale Pooley
 
The Economic History of the U.S. Lecture 25.pdf
The Economic History of the U.S. Lecture 25.pdfThe Economic History of the U.S. Lecture 25.pdf
The Economic History of the U.S. Lecture 25.pdfGale Pooley
 
(ANIKA) Budhwar Peth Call Girls Just Call 7001035870 [ Cash on Delivery ] Pun...
(ANIKA) Budhwar Peth Call Girls Just Call 7001035870 [ Cash on Delivery ] Pun...(ANIKA) Budhwar Peth Call Girls Just Call 7001035870 [ Cash on Delivery ] Pun...
(ANIKA) Budhwar Peth Call Girls Just Call 7001035870 [ Cash on Delivery ] Pun...ranjana rawat
 
The Economic History of the U.S. Lecture 18.pdf
The Economic History of the U.S. Lecture 18.pdfThe Economic History of the U.S. Lecture 18.pdf
The Economic History of the U.S. Lecture 18.pdfGale Pooley
 
The Economic History of the U.S. Lecture 21.pdf
The Economic History of the U.S. Lecture 21.pdfThe Economic History of the U.S. Lecture 21.pdf
The Economic History of the U.S. Lecture 21.pdfGale Pooley
 
(DIYA) Bhumkar Chowk Call Girls Just Call 7001035870 [ Cash on Delivery ] Pun...
(DIYA) Bhumkar Chowk Call Girls Just Call 7001035870 [ Cash on Delivery ] Pun...(DIYA) Bhumkar Chowk Call Girls Just Call 7001035870 [ Cash on Delivery ] Pun...
(DIYA) Bhumkar Chowk Call Girls Just Call 7001035870 [ Cash on Delivery ] Pun...ranjana rawat
 
02_Fabio Colombo_Accenture_MeetupDora&Cybersecurity.pptx
02_Fabio Colombo_Accenture_MeetupDora&Cybersecurity.pptx02_Fabio Colombo_Accenture_MeetupDora&Cybersecurity.pptx
02_Fabio Colombo_Accenture_MeetupDora&Cybersecurity.pptxFinTech Belgium
 

Recently uploaded (20)

Independent Call Girl Number in Kurla Mumbai📲 Pooja Nehwal 9892124323 💞 Full ...
Independent Call Girl Number in Kurla Mumbai📲 Pooja Nehwal 9892124323 💞 Full ...Independent Call Girl Number in Kurla Mumbai📲 Pooja Nehwal 9892124323 💞 Full ...
Independent Call Girl Number in Kurla Mumbai📲 Pooja Nehwal 9892124323 💞 Full ...
 
Solution Manual for Principles of Corporate Finance 14th Edition by Richard B...
Solution Manual for Principles of Corporate Finance 14th Edition by Richard B...Solution Manual for Principles of Corporate Finance 14th Edition by Richard B...
Solution Manual for Principles of Corporate Finance 14th Edition by Richard B...
 
The Economic History of the U.S. Lecture 17.pdf
The Economic History of the U.S. Lecture 17.pdfThe Economic History of the U.S. Lecture 17.pdf
The Economic History of the U.S. Lecture 17.pdf
 
The Economic History of the U.S. Lecture 23.pdf
The Economic History of the U.S. Lecture 23.pdfThe Economic History of the U.S. Lecture 23.pdf
The Economic History of the U.S. Lecture 23.pdf
 
06_Joeri Van Speybroek_Dell_MeetupDora&Cybersecurity.pdf
06_Joeri Van Speybroek_Dell_MeetupDora&Cybersecurity.pdf06_Joeri Van Speybroek_Dell_MeetupDora&Cybersecurity.pdf
06_Joeri Van Speybroek_Dell_MeetupDora&Cybersecurity.pdf
 
High Class Call Girls Nashik Maya 7001305949 Independent Escort Service Nashik
High Class Call Girls Nashik Maya 7001305949 Independent Escort Service NashikHigh Class Call Girls Nashik Maya 7001305949 Independent Escort Service Nashik
High Class Call Girls Nashik Maya 7001305949 Independent Escort Service Nashik
 
Commercial Bank Economic Capsule - April 2024
Commercial Bank Economic Capsule - April 2024Commercial Bank Economic Capsule - April 2024
Commercial Bank Economic Capsule - April 2024
 
Dividend Policy and Dividend Decision Theories.pptx
Dividend Policy and Dividend Decision Theories.pptxDividend Policy and Dividend Decision Theories.pptx
Dividend Policy and Dividend Decision Theories.pptx
 
Pooja 9892124323 : Call Girl in Juhu Escorts Service Free Home Delivery
Pooja 9892124323 : Call Girl in Juhu Escorts Service Free Home DeliveryPooja 9892124323 : Call Girl in Juhu Escorts Service Free Home Delivery
Pooja 9892124323 : Call Girl in Juhu Escorts Service Free Home Delivery
 
05_Annelore Lenoir_Docbyte_MeetupDora&Cybersecurity.pptx
05_Annelore Lenoir_Docbyte_MeetupDora&Cybersecurity.pptx05_Annelore Lenoir_Docbyte_MeetupDora&Cybersecurity.pptx
05_Annelore Lenoir_Docbyte_MeetupDora&Cybersecurity.pptx
 
Log your LOA pain with Pension Lab's brilliant campaign
Log your LOA pain with Pension Lab's brilliant campaignLog your LOA pain with Pension Lab's brilliant campaign
Log your LOA pain with Pension Lab's brilliant campaign
 
(Vedika) Low Rate Call Girls in Pune Call Now 8250077686 Pune Escorts 24x7
(Vedika) Low Rate Call Girls in Pune Call Now 8250077686 Pune Escorts 24x7(Vedika) Low Rate Call Girls in Pune Call Now 8250077686 Pune Escorts 24x7
(Vedika) Low Rate Call Girls in Pune Call Now 8250077686 Pune Escorts 24x7
 
The Economic History of the U.S. Lecture 19.pdf
The Economic History of the U.S. Lecture 19.pdfThe Economic History of the U.S. Lecture 19.pdf
The Economic History of the U.S. Lecture 19.pdf
 
The Economic History of the U.S. Lecture 20.pdf
The Economic History of the U.S. Lecture 20.pdfThe Economic History of the U.S. Lecture 20.pdf
The Economic History of the U.S. Lecture 20.pdf
 
The Economic History of the U.S. Lecture 25.pdf
The Economic History of the U.S. Lecture 25.pdfThe Economic History of the U.S. Lecture 25.pdf
The Economic History of the U.S. Lecture 25.pdf
 
(ANIKA) Budhwar Peth Call Girls Just Call 7001035870 [ Cash on Delivery ] Pun...
(ANIKA) Budhwar Peth Call Girls Just Call 7001035870 [ Cash on Delivery ] Pun...(ANIKA) Budhwar Peth Call Girls Just Call 7001035870 [ Cash on Delivery ] Pun...
(ANIKA) Budhwar Peth Call Girls Just Call 7001035870 [ Cash on Delivery ] Pun...
 
The Economic History of the U.S. Lecture 18.pdf
The Economic History of the U.S. Lecture 18.pdfThe Economic History of the U.S. Lecture 18.pdf
The Economic History of the U.S. Lecture 18.pdf
 
The Economic History of the U.S. Lecture 21.pdf
The Economic History of the U.S. Lecture 21.pdfThe Economic History of the U.S. Lecture 21.pdf
The Economic History of the U.S. Lecture 21.pdf
 
(DIYA) Bhumkar Chowk Call Girls Just Call 7001035870 [ Cash on Delivery ] Pun...
(DIYA) Bhumkar Chowk Call Girls Just Call 7001035870 [ Cash on Delivery ] Pun...(DIYA) Bhumkar Chowk Call Girls Just Call 7001035870 [ Cash on Delivery ] Pun...
(DIYA) Bhumkar Chowk Call Girls Just Call 7001035870 [ Cash on Delivery ] Pun...
 
02_Fabio Colombo_Accenture_MeetupDora&Cybersecurity.pptx
02_Fabio Colombo_Accenture_MeetupDora&Cybersecurity.pptx02_Fabio Colombo_Accenture_MeetupDora&Cybersecurity.pptx
02_Fabio Colombo_Accenture_MeetupDora&Cybersecurity.pptx
 

Brookfield Office Properties - BPO - Quarterly Earnings

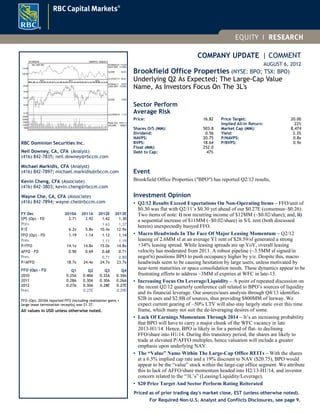
  • 1. COMPANY UPDATE | COMMENT AUGUST 6, 2012 Brookfield Office Properties (NYSE: BPO; TSX: BPO) Underlying Q2 As Expected; The Large-Cap Value Name, As Investors Focus On The 3L's Sector Perform Average Risk Price: 16.82 Shares O/S (MM): 503.8 Dividend: 0.56 NAVPS: 20.75 BVPS: 18.64 Float (MM): 252.0 Debt to Cap: 47% Price Target: 20.00 Implied All-In Return: 22% Market Cap (MM): 8,474 Yield: 3.3% P/NAVPS: 0.8x P/BVPS: 0.9x Event Brookfield Office Properties ("BPO") has reported Q2/12 results, Investment Opinion • Q2/12 Results Exceed Expectations On Non-Operating Items – FFO/unit of $0.30 was flat with Q2/11’s $0.30 yet ahead of our $0.27E (consensus~$0.26). Two items of note: i) non recurring income of $12MM (~$0.02/share); and, ii) a sequential increase of $11MM (~$0.02/share) in S/L rent (both discussed herein) unexpectedly buoyed FFO. • Macro Headwinds In The Face Of Major Leasing Momentum – Q2/12 leasing of 2.6MM sf at an average Y1 rent of $28.59/sf generated a strong +34% leasing spread. While leasing spreads are up YoY, overall leasing velocity has moderated from 2011. A robust pipeline (~3.5MM sf signed/in negot'n) positions BPO to push occupancy higher by y/e. Despite this, macro headwinds seem to be causing hesitation by large users, unless motivated by near-term maturities or space consolidation needs. These dynamics appear to be frustrating efforts to address ~3MM sf expiries at WFC in late-13. • Increasing Focus On Leverage/Liquidity – A point of repeated discussion on the recent Q2/12 quarterly conference call related to BPO’s sources of liquidity and its financial leverage. Our sources/uses analysis through Q4/13 identifies $2B in uses and $2.8B of sources, thus providing $800MM of leeway. We expect current gearing of ~50% LTV will also stay largely static over this time frame, which many not suit the de-leveraging desires of some. • Lack Of Earnings Momentum Through 2014 – It’s an increasing probability that BPO will have to carry a major chunk of the WFC vacancy in late 2013-H1/14. Hence, BPO is likely in for a period of flat- to declining FFO/share into H1/14. During this transitory period, the shares are likely to trade at elevated P/AFFO multiples, hence valuation will include a greater emphasis upon underlying NAV. • The “Value” Name Within The Large-Cap Office REITs – With the shares at a 6.5% implied cap rate and a 19% discount to NAV ($20.75), BPO would appear to be the “value” stock within the large-cap office segment. We attribute this to lack of AFFO/share momentum headed into H2/13-H1/14, and investor concern related to the “3L’s” (Leasing/Liquidity/Leverage). • $20 Price Target And Sector Perform Rating Reiterated Priced as of prior trading day's market close, EST (unless otherwise noted). 125 WEEKS 19MAR10 - 03AUG12 12.00 14.00 16.00 18.00 20.00 M A M J J A S O N 2010 D J F M A M J J A S O N 2011 D J F M A M J J A 2012 HI-08JUL11 20.07 LO/HI DIFF 73.46% CLOSE 16.82 LO-07MAY10 11.57 5000 10000 15000 20000 25000 PEAK VOL. 27917.2 VOLUME 9506.5 100.00 110.00 Rel. S&P 500 HI-05NOV10 115.29 HI/LO DIFF -21.50% CLOSE 92.51 LO-07OCT11 90.51 RBC Dominion Securities Inc. Neil Downey, CA, CFA (Analyst) (416) 842-7835; neil.downey@rbccm.com Michael Markidis, CFA (Analyst) (416) 842-7897; michael.markidis@rbccm.com Kevin Cheng, CFA (Associate) (416) 842-3803; kevin.cheng@rbccm.com Wayne Che, CA, CFA (Associate) (416) 842-7894; wayne.che@rbccm.com FY Dec 2010A 2011A 2012E 2013E EPS (Op) - FD 2.71 2.92 1.62 1.30 Prev. 1.63 1.37 P/E 6.2x 5.8x 10.4x 12.9x FFO (Op) - FD 1.19 1.14 1.12 1.14 Prev. 1.11 1.19 P/FFO 14.1x 14.8x 15.0x 14.8x AFFO - FD 0.90 0.69 0.68 0.71 Prev. 0.71 0.80 P/AFFO 18.7x 24.4x 24.7x 23.7x FFO (Op) - FD Q1 Q2 Q3 Q4 2010 0.25A 0.40A 0.32A 0.34A 2011 0.28A 0.30A 0.30A 0.26A 2012 0.27A 0.30A 0.28E 0.27E Prev. 0.27E 0.29E FFO (Op): 2010A reported FFO (including realization gains + large lease termination recepits) was $1.37. All values in USD unless otherwise noted. For Required Non-U.S. Analyst and Conflicts Disclosures, see page 9.
  • 2. 2 Highlights & Overview Q2/12 Results Exceed Expectations on Non-Recurring and Accounting Items – FFO/unit of $0.30 was flat with Q2/11’s $0.30 yet ahead of our $0.27 estimate and consensus ($0.26-$0.27). Two items of note: i) non recurring income of $12 million (~$0.02/share) included lease termination receipts (mostly Wachovia) of $11 million and a $1 million tax refund (Ottawa); and ii) a sequential increase of $11 million (~$0.02/share) in straight-line rent related to Brookfield Place (Perth), a Morgan Stanley lease renewal/expansion (1 New York Plaza) and other accounting adjustments (straight-line rent re-set due to change of control of the U.S. office fund and 4WFC) were not in our forecast and likely not within “Street” estimates. Overall, we see core operating trends and underlying financial results as being in accordance with expectations. Macro Headwinds In The Face Of Leasing Momentum; BofAML Space At WFC Is Still The Overhang – In Q2/12, BPO leased 2.6 million sf at an average year-one net rent of $28.59/sf, representing a substantial +34% spread over the average expiring rent of $21.34/sf. While leasing spreads are higher than year-ago levels, overall leasing activity has moderated from 2011. Management continues to suggest a robust pipeline (~3.5 million sf that has either been signed or is in the documentation or advanced negotiation stages) positions the company well to push occupancy higher by year-end. Despite this momentum, commentary suggests that macro- headwinds are causing larger users to hesitate in their leasing decisions, unless they are motivated by H2/12-2013 lease maturities or the need to consolidate space requirements. This appears to be a frustration in addressing the ~3 million sf BofAML expiry at WFC. Increasing Focus On Leverage And Liquidity; We Are Comfortable With Sources/Uses, Yet We See No Reduction From ~50% Gearing – A point of repeated discussion on the recent Q2/12 quarterly conference call related to BPO’s sources of liquidity and its financial leverage. Our analysis of source/uses of funds identifies $2.0 billion of expected uses through Q4/13 versus potential sources of $2.8 billon, thus providing for ~$800 million of leeway. Thus, we believe BPO has adequate liquidity. This same analysis also suggests overall LTV will hold constant at ~50% over the time period. Others are clearly of the view that reduced leverage would be desirable. We note the company has historically employed higher-than-average gearing. Based on this history and management commentary about the future, we believe this is not likely to change. Lack Of Earnings Momentum Through 2014 – It is increasingly likely that BPO will have to carry a major chunk of the BofAML space at WFC as vacancy in late 2013 and H1/14. The degree of FFO/AFFO “hit” during this time frame will, in part, be the product of the accounting policies employed. It appears to us that BPO is in for a period of flat- to declining FFO/share into H1/14. Hence, intermediate-term FFO/share and AFFO/share momentum does not look great. During this transitory period, the shares are likely to trade at elevated P/AFFO multiples and valuation analysis will likely require a greater emphasis upon underlying NAV. The “Value” Name Within The Large-Cap Office REITs – With the shares trading a 6.5% implied cap rate and a 19% discount to our $20.75 NAV, BPO would appear to be the “value” stock within the large-cap office segment. We attribute this to the lack of FFO/share and AFFO/share momentum headed into 2013-14, and investor focus upon the “3L’s” (Leasing; Liquidity; Leverage). Q2/12 Results And Re-Cap Occupancy And Same Property NOI Growth Edge Higher – Q2/12 total portfolio occupancy was 93.4%, 50bps above Q1/12’s 92.9% and 10bps higher than Q2/11. Sequential results were strong across the board, lifting the Q2/12 occupancy rate to its highest level since Q1/11. Regional occupancy metrics include:  United States – Q2/12 occupancy was 91.3% (up 70bps sequentially and unchanged Y/Y). Notable sequential increases were seen in Boston (+230bps to 66.2%), Los Angeles (+100bps to 85.0%) and Downtown New York (+140bps to 95.1%). In general, the U.S. portfolio experienced broad-based occupancy increases on a Q/Q basis (with the exception of Minneapolis).  Australia – Q2/12 occupancy was 98.1% (+30bps sequentially but down 120bps from Q2/11) as all Australian properties experienced an uptick in occupancy rates. Perth (+140bps to 97.4%) had the largest sequential improvement compared to Sydney (+50bps to 98.4%) and Melbourne (+10bps to 97.4%).  Canada – Q2/12 occupancy was 97.0% (+20bps sequentially and up 80bps Y/Y). Occupancy rates were mixed with notable strength experienced in the Toronto. Toronto’s occupancy increased by 40bps sequentially, to 94.7%, while Ottawa (unchanged Q/Q at 99.7%) and Calgary (-20bps Q/Q to 99.6%) experienced slightly weaker results. Q2/12’s same-property NOI growth was +3.6% on a constant currency basis (+1.5%, including the effect of currency fluctuations). The Q2 result was a 280bps improvement over Q1/12’s 0.8%, yet was also on the back of an easy “comp” as Q2/11 organic growth had been -2.5%. The improved Q2/12 result lifted the trailing twelve month organic growth rate to 1.4%, which marked the fastest growth rate since Q4/10, as shown in Exhibit 1. Brookfield Office PropertiesAugust 6, 2012
  • 3. 3 Exhibit 1: Historical Portfolio Occupancy1 And Same-Property NOI2 Statistics (Q1/08 to Q2/12) 88% 90% 92% 94% 96% 98% 100% Q1/08 Q1/09 Q1/10 Q1/11 Q1/12 Canada U.S. Australia Total -4% -2% 0% 2% 4% 6% 8% Q1/08 Q1/09 Q1/10 Q1/11 Q1/12 Same-Property NOI Growth 4Q Moving Average Source: RBC Capital Markets and Company reports Notes: 1 Portfolio occupancy statistics include unconsolidated JVs. 2 Historical same-property NOI excludes the impact of FX. Beginning with Q1/10, same-property NOI is presented on a proportionate basis. Source: RBC Capital Markets and Company reports Market Rents Edge Higher– BPO’s overall average market rent estimate of $34.86/sf (net) was marginally higher versus Q1/12 ’s $34.59/sf. On a regional basis, market rent estimates were mixed, as there were sequential gains in Australia (+3%) and Canada (+1%) with a modest drop in the U.S. (-1%). As shown in Exhibit 2b, the gap between in-place and market rents was $6.01 (21% in percentage terms) in Q2/12, slightly lower than $6.16 in Q1/12. While it will take many years for BPO to capture a large component of this mark-to-market potential, it nonetheless represents a substantial long-term NOI and FFO growth opportunity. Exhibit 2a: Lease Maturity Profile (in MM sf) 0 2 4 6 2012 2013 2014 2015 U.S. Canada Australia Exhibit 2b: Average In-Place And Estimated Market Rent (Net) $20 $25 $30 $35 $40 Q1/08 Q1/09 Q1/10 Q1/11 Q1/12 Average In-Place Rent Average Market Rent Source: RBC Capital Markets and Company reports Leasing Velocity Totals 2.6MM In Q2; H2/12 Pipeline Still Looking Strong – In Q2/12, BPO leased 2.6 million sf at an average year-one net rent of $28.59/sf, representing a substantial +34% spread over the average expiring rent of $21.34/sf. While leasing spreads are higher than year-ago levels, overall leasing activity has moderated from 2011. In H1/12, BPO leased 3.7 million sf, down ~16% compared to H1/11’s 4.4 million sf. Management continues to suggest a robust pipeline (~3.5 million sf that has either been signed or is in the documentation or advanced negotiation stages) positions the company well to push occupancy higher by year-end. Q2/12 leasing highlights include:  New York (1,300,000 sf) – including a 17-year lease renewal and expansion with Morgan Stanley for 1.2 million sf at One New York Plaza. The expansion space was part of the early take-back (and related lease termination receipt) from Wachovia.  Houston (404,000 sf) – including a 5-year, 164,000 sf lease renewal with Chevron at 1600 Smith Street and an 11-year 110,000 sf new lease with Rosetta Resources at Heritage Plaza. Brookfield Office PropertiesAugust 6, 2012
  • 4. 4  Los Angeles (275,000 sf) – including a 3-year, 94,000 sf lease renewal with the U.S. Secret Service and a 10-year, 54,000 sf renewal and expansion with Jackson Lewis LLP. Both tenants are located in the Ernst & Young Plaza. Subsequent to the quarter, Management announced that it signed a 91,000 sf lease with Georgetown University at 650 Massachusetts Avenue, NW, in Washington D.C. The “650 Mass” property is performing ahead of Management’s expectations and is now 97% leased, up from 72% in December 2010 when Brookfield acquired the building. Macro Backdrop Takes The Edge Off Of Larger Out-Year Leasing Decisions – Broadly speaking, the ~3 million sf of vacancy related to the BofAML space at 2 and 4 World Financial Center (“WFC”) continues to be a front and centre concern for investors. Early this year, Management had outlined a goal of leasing ~50% of the ~3 million sf (set to expire in October of 2013) by the end of the year. Commentary from Management suggested it’s not given up on this goal, yet the probability of meeting the target is declining. Citing macro-factors such as: i) lingering macro economic uncertainty; ii) the European debt crisis; and iii) the upcoming U.S. Presidential election, Management has suggested the attitude of larger tenants (say ~1 million sf or more) has become more subdued, and that decisions are only being made with respect to near-term (i.e., late 2012 and 2013) lease expiries, or where there is a desire on behalf of the tenant to consolidate space requirements. The hurdle is that BPO will likely not be in a position to deliver (for physical occupancy) the WFC space until mid-2014. Therefore it must target larger users with a late-2014/early-2015 lease expiries. And, in the current environment, many of these prospects are seemingly satisfied to continue to defer on their decisions. $1.3B Of Properties Acquired Or Under Contract In H1/12; $237MM Of Property Sales – As summarized in Exhibit 3, BPO has either acquired or agreed to acquire $1.3 billion of properties and development sites in H1/12. Year-to-date, two properties with a total value of $237 million have been sold. Management has suggested that it could sell another 5 properties having a total value of ~$500 million by year end. RBC Plaza and 33 South Six Street, Minneapolis (aggregate value of $335 million and related debt of $170 million) have been classified as “held for sale” for some time now. 2012 acquisitions have typically included a value-add angle, while sales would be characterized by smaller properties, those in non-core markets, or those where BPO believes that cash flow and values have been maximized. Exhibit 3: 2012 Acquisition and Disposition Activity ($MM, unless noted) GLA in MM sf Total BPO Date Property City (ex-parking) Price Debt2 Equity Price/sf Interest Total Equity 2012 Acquisitions Q1 Bow Parkade Calgary n.a. 90 55 35 n.a. 100% 90 35 Q2 Metropolitan Park East & West Seattle 0.7 210 126 84 $300 100% 210 84 Q2 799 9th Street Washington 0.2 106 72 35 $525 100% 106 35 Q3 London Portfolio - IPP1,2 London 0.7 714 106 608 $992 100% 714 608 Q3 London Portfolio - dev't sites1,2,3 London n.a. 157 0 157 n.a. 100% 157 157 Totals/Averages 1.6 1,277 359 919 $635 1,277 919 2012 Dispositions Q1 Altius Center Calgary 0.3 180 20 160 $593 100% 180 160 Q1 Defence Plaza Melbourne 0.2 78 47 31 $386 73% 57 23 Totals/Averages 0.5 258 67 191 $510 237 182 BPO Share of: Notes: 1 The London acquisitions total $871MM and consist of "the Hammerson" portfolio ($829MM) and 50% stake in London Wall Place development site ($42MM) 2 The Hammerson portfolio acquisition will have a staged closing and BPO will assume $106 million of debt in this deal. Phase One will close on Sept 30, 2012 and will include 99 Bishopsgate, Principal Place and other smaller assets (with an estimated cost of $450-500 million) BPO will place new debt (estimated 50-55% LTV against these properties). Phase 2 will close in June 2013 and will include 125 Old Broad Street and Leaden hall Court. 3 The development sites include 1.4MM sf gross or 1.1MM sf at BPO's share Source: RBC Capital Markets The Q2/2012 acquisition highlights include: Metropolitan Park East & West (Seattle, WA) – On June 5, 2012 Brookfield acquired Metropolitan Park East and West Office Towers for $210 million (~$300/sf). The purchase of the 699,000 sf Class A property was financed through an acquisition facility totaling $126 million with the remainder in cash. The region has a large concentration of leading tech and life science companies and fits into Brookfield’s strategy of owning premier assets situated in high barrier to entry urban markets. Moreover, the acquisition fits BPO’s goal of further diversify its tenant base towards the high tech, IT and social media sectors. Brookfield Office PropertiesAugust 6, 2012
  • 5. 5 London, UK Investments – On June 19, 2012 Brookfield agreed to acquire a portfolio of premier office buildings and a development site in London’s financial district from Hammerson plc for £518 million ($829 million). Subsequent to the quarter, BPO took assignment of an option agreement for an additional development site (London Wall Place) in a 50/50 JV with Oxford. In addition to Principal Place, both development sites can now accommodate approximately 1.4 million sf of density. The 50% stake in London Wall Place has increased the total London investment to $871 million. The Hammerson portfolio includes four operating assets totaling 884,000 sf (720,000 sf at Brookfield’s ownership). The operating assets (50% of 125 Old Broad Street, 99 Bishopsgate, Leadenhall Court, and 1 Puddle Dock) are 85% leased. Also included in the deal are several smaller assets on Shoreditch High Street adjoining Principal Place. For additional details, we refer readers to our June 19th note entitled “London Calling: To Acquire £518MM Office And Dev't Portfolio From Hammerson plc”. While BPO is taking some leasing risk (related to a large 2014 lease expiry), we believe the transaction risk-reward profile appears favourable. Within the Insurance District (Leadenhall/Bishopsgate), there are a limited number of good quality alternatives, which leaves BPO encouraged on the leasing front. Offering a going-in yield of 6.0% on the operating assets, BPO believes it can improve the yield to 7.0% within 3-years (perhaps sooner) with some re-leasing wins. If so, we believe the deal offers good value creation based upon our view of 5.0% to 5.5% “fair-value” cap rates. 799 9th Street (Washington, DC) – On June 25, 2012, Brookfield acquired 799 9th Street, NW in Washington, D.C. for $106 million (~$525/sf). The building is a 10-story LEED Gold-certified, Class A office building, with 202,000 sf, which is currently 96% occupied. The property is located in the DC east-end submarket, near two other BPO properties (650 Massachusetts Avenue, NW and the Victor Building). All leases at 799 9th Street expire in December 2012 and January 2013. Hence, the acquisition represents another BPO value-add acquisition. The deal was funded through new property-level financing of $71.5 million, with the remainder from available cash. BPO has noted to us that its pro-forma includes a 3-year lease-up assumption, subject to a repositioning program which could increase the total cost/sf to ~$700-$725. Assuming the building can be leased at a net rent of ~$45/sf, we see to potential for a stabilized NOI yield approaching 7% and a levered IRR in the low- to mid-teens. $768 Million Of Corporate Liquidity – On a proportionate basis, Q2/12 liquidity was $768 million, consisting of $301 million of cash and $467 million of availability under two corporate credit facilities. On this basis, corporate liquidity increased marginally during Q2, from $705 million at March 31. Exhibit 4 below summarizes and graphically depicts BPO’s liquidity, leverage, and debt maturity profile. Exhibit 4: Liquidity and Debt Maturity Profile, Proportionate Basis ($MM, unless noted, continuing operations) Cash 301 Undrawn Lines 467 Liquidity 768 Lines 348 Res.l & Land Dev. Debt 0 Commercial Property Debt 11,985 Total Debt 12,333 Liquidity as a % of Total Debt 6% % Unsecured 5% % Secured 95% 0 1,000 2,000 3,000 4,000 5,000 6,000 Liquidity Lines 2012 2013 2014 2015 2016+ Commercial Property Debt Note: Brookfield’s consolidated balance sheet contains $847 million of Capital Securities which represents Class AAA perpetual preference shares outstanding. Source: RBC Capital Markets and Company reports Heightened Focus Upon Liquidity Management And Financial Leverage; We Are Comfortable With Sources/Uses, Yet We See No Reduction From ~50% Gearing – A point of repeated discussion on the recent Q2/12 quarterly conference call related to BPO’s sources of liquidity and its financial leverage. The tone broadly related to the concern that both might become stretched in light of capital commitments for pending acquisitions, planned developments and re-leasing/redevelopment requirements. We believe capital requirements (including committed acquisitions and common dividends) in H2/12 through to the end of 2013 could total ~$2.0 billion. We have listed these below in Exhibit 5. Brookfield Office PropertiesAugust 6, 2012
  • 6. 6 Through a combination of existing liquidity, another 18 months of retained earnings, expected up-financings of near-term maturing mortgages, expected net proceeds from property sales and other potential sources, we have identified $2.8 billion of total available funds over this time frame, thus leaving BPO with $800 million of leeway. Therefore, our analysis suggests the Company has adequate liquidity. Exhibit 5: Estimated Sources And Uses Of Cash, H2/12 Through 2013 ($MM, unless noted) Expected Uses: Potential Sources: Hammerson Portfolio Acquisition (Gross Value) 870 Hammerson Portfolio - Assumed Debt 106 WFC Retail Redev't / Office Re-Leasing Capex1 300 Hammerson Portfolio - New Property Debt Arranged 300 Other "Recurring" TI's And Leasing Capex 225 Asset Sales (5 properties; net expected proceeds) 250 Mandatory Mortgage Principal Amortization 155 Mortgage Up-financing (net) 350 Common Dividends 423 Sale of BOX.un Units 150 FFO To Common Shareholders (after preferred divys) 858 Current Liquidity2 768 Total Projected Uses3 1,973 Potential Sources 2,782 Excess Sources Over Uses 809 Notes: 1 We estimate the total outlay to late-2014 could be ~$500MM (~$200MM for retail redevelopment and ~$300MM for office re-tenanting. 2 Proportionate liquidity (in the form of cash and undrawn credit) totaled $768 million as at Q2/12. 3 We assume that new development is a “discretionary” capital outlay and that the primary sources of funds will be dedicated construction facilities. The ability to fund, at least initially, from such facilities may prove inaccurate as it relates to proceeding with the decking at Manhattan West (may be funded from current cash/liquidity) and Bay-Adelaide East (pending further pre-leasing from 43%) Source: RBC Capital Markets and Company reports On the subject of financial leverage, we currently estimated BPO’s gearing is ~50%, based upon $12.2 billion of proportionately consolidated debt and $24.7 billion of investment and development properties, at fair value. Participant commentary on Friday’s quarterly conference call hinted to a concern that leverage might move still upwards. Some also seemed to suggest they would prefer BPO had lower financial leverage. Our experience suggests that BPO has historically run high-than-average gearing. Our sources and uses of funds “roll-forward” to Q4/13 also reveals that leverage will continue to hold constant at ~50% out to Q4/13. Hence, gearing will remain above peer average. Overall, we are comfortable with the debt levels, yet we are cognizant of the higher sensitivity to equity values in an inherently geared capital structure. Estimates Adjusted; Likely Lacking FFO/Share Momentum Until Late 2014 – We have tweaked our 2012 FFO/share by +0.01, to $1.12. We’ve also now assumed that ~3 million sf at WFC becomes vacant, effective Q4/13. Hence our 2013 FFO/unit estimate has been cut from $1.19 to $1.14. In is increasingly clear that BPO will have to carry a major chunk of the BofAML space at WFC as vacancy in late 2013 and H1/14. The degree of FFO/AFFO “hit” during this time frame will, in part, be the product of the accounting policies employed. These policies are yet to be determined, or at least, yet to be disclosed. Regardless, it would appear to us that the picture is one of declining FFO/share into H1/14, and at this juncture, it is just a question of magnitude. Hence, BPO’s intermediate-term (to mid-2014) FFO/share and AFFO/share momentum does not look great. During the transitory period, the shares are likely to trade with greater emphasis on underlying NAV. Hence, we expect the 2013-2014 FFO and AFFO multiples will appear notably elevated. The “Value” Name Within The Large-Cap Office REITs – Exhibit 6 on page 7 provides a summarized comparative valuation table for key larger-cap, U.S office-focused REITs and BPO. BPO’s AFFO multiple is elevated, and indeed above the peer average in 2013, as we expect Q4/13 and H1/14 to be hit by the lost NOI associated with ~3 million sf of vacant space at WFC. With the shares trading a 6.5% implied cap rate and a 19% discount to our $20.75 NAV, BPO would appear to be the “value” stock within the large-cap office segment. We attribute this to lack of FFO/share and AFFO/share momentum headed into 2013-14 and investor focus upon the “3L’s” (leasing; liquidity; leverage). Reiterating $20 Price Target And Sector Perform Rating – Our $20 target price is supported by our NAVPS estimate of $20.75. Our target price equates to a 28x multiple (formerly 25x) to our 2013 AFFO/share estimate. The increase in our target multiple reflects the expected “hit” to AFFO in 2013 as the result of a large vacancy. Overall, our price target continues to be underpinned by our NAVPS estimate. We believe the target multiple, which remains above the average which we apply to the Canadian commercial property peers, reasonably reflects Brookfield's focus on premier properties in high-barrier-to-entry North American and Australian cities, its financial leverage, overall franchise value and the expected transitory income “down time” associated with a potential large vacancy in lower Manhattan. We rate Brookfield's shares Sector Perform, Average Risk. Brookfield Office PropertiesAugust 6, 2012
  • 7. 7 Exhibit 6: Summarized Comparative Valuation Table – U.S. Office-Focused REITs Ticker Company 2011 2012E 2013E 2011 2012E 2013E AFFO BPO-US Brookfield Office Properties Inc. 16.82 20.75 82% 8,474 3.3% 14.7x 15.0x 14.8x 24.4x 24.8x 23.7x 83% ARE-US Alexandria Real Estate Equities, Inc. 73.55 75.31 97% 4,578 2.8% 16.8x 17.0x 15.4x 19.3x 20.5x 18.4x 57% BXP-US Boston Properties, Inc. 113.00 100.41 111% 19,012 1.9% 23.3x 23.3x 21.4x 32.3x 34.1x 29.0x 66% OFC-US Corporate Office Properties Trust 22.58 26.93 82% 1,724 4.9% 29.7x 11.0x 11.1x 15.8x 14.1x 14.5x 69% DEI-US Douglas Emmett, Inc. 23.86 22.15 107% 4,141 2.5% 17.3x 17.4x 16.8x 24.6x 23.6x 22.1x 59% CLI-US Mack-Cali Realty Corporation 27.14 30.82 87% 2,714 6.6% 9.7x 10.4x 10.6x 12.7x 14.1x 15.5x 94% PKY-US Parkway Properties, Inc. 11.12 15.29 72% 328 2.7% 5.1x 9.4x 9.2x 18.5x 25.3x 18.5x 68% SLG-US SL Green Realty Corp. 81.75 82.33 98% 7,637 1.2% 17.0x 16.6x 16.5x 34.9x 30.1x 27.5x 37% VNO-US Vornado Realty Trust 85.65 84.56 99% 16,887 3.2% 13.3x 17.2x 17.0x 21.4x 25.5x 24.2x 82% BPO And Selected U.S. Office REITs 93% 3.2% 16.3x 15.3x 14.7x 22.7x 23.6x 21.5x 68% Peer Average 94% 3.2% 16.5x 15.3x 14.7x 22.4x 23.4x 21.2x 67% NAV '12E PayoutPrice (US$) Cap ($MM) Div. Yield Price/ NAV P/ FFO Multiple P/ AFFO Multiple Source: RBC Capital Markets estimates for Brookfield Office Properties; U.S. Office REIT estimates sourced from SNL Brookfield Office PropertiesAugust 6, 2012
  • 8. 8 Valuation Our $20 one-year price target is determined via the application of a 28x multiple to our 2013 AFFO/unit estimate. We believe our target multiple reasonably reflects Brookfield's focus on premier properties in high-barrier-to-entry North American and Australian cities, its financial leverage, and overall franchise value. We rate Brookfield's shares Sector Perform, Average Risk. Price Target Impediment Impediments to the achievement of our price target include but are not limited to: the risks associated with the ownership of real property; and the company's high exposure to the New York City office market, the financial services industry, and certain major tenants. Company Description BPO owns, develops, and manages premier quality office properties in high-growth and high-barrier markets. The commercial property portfolio includes >100 commercial properties encompassing 80 million sf concentrated in central business districts across North America and Australia. The portfolio includes such landmark assets as the World Financial Center and Brookfield Place. Brookfield also holds interests in ~15 million sf of development properties in its major markets. Brookfield Office PropertiesAugust 6, 2012
  • 9. 9 Required Disclosures Non-U.S. Analyst Disclosure Michael Markidis, Kevin Cheng and Wayne Che (i) are not registered/qualified as research analysts with the NYSE and/or FINRA and (ii) may not be associated persons of the RBC Capital Markets, LLC and therefore may not be subject to FINRA Rule 2711 and NYSE Rule 472 restrictions on communications with a subject company, public appearances and trading securities held by a research analyst account. Conflicts Disclosures The analyst(s) responsible for preparing this research report received compensation that is based upon various factors, including total revenues of the member companies of RBC Capital Markets and its affiliates, a portion of which are or have been generated by investment banking activities of the member companies of RBC Capital Markets and its affiliates. A member company of RBC Capital Markets or one of its affiliates managed or co-managed a public offering of securities for Brookfield Office Properties in the past 12 months. A member company of RBC Capital Markets or one of its affiliates received compensation for investment banking services from Brookfield Office Properties in the past 12 months. RBC Capital Markets, LLC makes a market in the securities of Brookfield Office Properties and may act as principal with regard to sales or purchases of this security. Royal Bank of Canada, together with its affiliates, beneficially owns 1 percent or more of a class of common equity securities of Brookfield Office Properties. A member company of RBC Capital Markets or one of its affiliates received compensation for products or services other than investment banking services from Brookfield Office Properties during the past 12 months. During this time, a member company of RBC Capital Markets or one of its affiliates provided non-investment banking securities-related services to Brookfield Office Properties. A member company of RBC Capital Markets or one of its affiliates received compensation for products or services other than investment banking services from Brookfield Office Properties during the past 12 months. During this time, a member company of RBC Capital Markets or one of its affiliates provided non-securities services to Brookfield Office Properties. RBC Capital Markets has provided Brookfield Office Properties with investment banking services in the past 12 months. RBC Capital Markets has provided Brookfield Office Properties with non-investment banking securities-related services in the past 12 months. RBC Capital Markets has provided Brookfield Office Properties with non-securities services in the past 12 months. The author is employed by RBC Dominion Securities Inc., a securities broker-dealer with principal offices located in Toronto, Canada. Explanation of RBC Capital Markets Equity Rating System An analyst's 'sector' is the universe of companies for which the analyst provides research coverage. Accordingly, the rating assigned to a particular stock represents solely the analyst's view of how that stock will perform over the next 12 months relative to the analyst's sector average. Ratings Top Pick (TP): Represents analyst's best idea in the sector; expected to provide significant absolute total return over 12 months with a favorable risk-reward ratio. Outperform (O): Expected to materially outperform sector average over 12 months. Sector Perform (SP): Returns expected to be in line with sector average over 12 months. Underperform (U): Returns expected to be materially below sector average over 12 months. Risk Qualifiers (any of the following criteria may be present): Average Risk (Avg): Volatility and risk expected to be comparable to sector; average revenue and earnings predictability; no significant cash flow/financing concerns over coming 12-24 months; fairly liquid. Above Average Risk (AA): Volatility and risk expected to be above sector; below average revenue and earnings predictability; may not be suitable for a significant class of individual equity investors; may have negative cash flow; low market cap or float. Speculative (Spec): Risk consistent with venture capital; low public float; potential balance sheet concerns; risk of being delisted. Distribution of Ratings Brookfield Office PropertiesAugust 6, 2012
  • 10. 10 For the purpose of ratings distributions, regulatory rules require member firms to assign ratings to one of three rating categories - Buy, Hold/Neutral, or Sell - regardless of a firm's own rating categories. Although RBC Capital Markets' ratings of Top Pick/Outperform, Sector Perform and Underperform most closely correspond to Buy, Hold/Neutral and Sell, respectively, the meanings are not the same because our ratings are determined on a relative basis (as described above). Distribution of Ratings RBC Capital Markets, Equity Research Investment Banking Serv./Past 12 Mos. Rating Count Percent Count Percent BUY[TP/O] 772 51.92 224 29.02 HOLD[SP] 648 43.58 152 23.46 SELL[U] 67 4.51 2 2.99 Q2 Q3 Q1 Q2 Q3 Q1 Q2 Q3 Q1 Q2 Q3 6 9 12 15 18 21 2010 2011 2012 10/29/09 OP:12.75 01/11/10 OP:14 02/05/10 OP:15 04/06/10 OP:17.5 09/03/10 OP:18.25 11/01/10 OP:18.75 05/06/11 SP:21 11/07/11 SP:19 07/18/12 SP:20 Rating and Price Target History for: Brookfield Office Properties as of 08-03-2012 (in USD) Legend: TP: Top Pick; O: Outperform; SP: Sector Perform; U: Underperform; I: Initiation of Research Coverage; D: Discontinuation of Research Coverage; NR: Not Rated; NA: Not Available; RL: Recommended List - RL: On: Refers to date a security was placed on a recommended list, while RL Off: Refers to date a security was removed from a recommended list. Created by BlueMatrix References to a Recommended List in the recommendation history chart may include one or more recommended lists or model portfolios maintained by a business unit of the Wealth Management Division of RBC Capital Markets, LLC. These Recommended Lists include a former list called the Prime Opportunity List (RL 3), the Guided Portfolio: Prime Income (RL 6), the Guided Portfolio: Large Cap (RL 7), Guided Portfolio: Dividend Growth (RL 8), the Guided Portfolio: Midcap 111 (RL9), and the Guided Portfolio: ADR (RL 10). The abbreviation 'RL On' means the date a security was placed on a Recommended List. The abbreviation 'RL Off' means the date a security was removed from a Recommended List. Conflicts Policy RBC Capital Markets Policy for Managing Conflicts of Interest in Relation to Investment Research is available from us on request. To access our current policy, clients should refer to https://www.rbccm.com/global/file-414164.pdf or send a request to RBC CM Research Publishing, P.O. Box 50, 200 Bay Street, Royal Bank Plaza, 29th Floor, South Tower, Toronto, Ontario M5J 2W7. We reserve the right to amend or supplement this policy at any time. Dissemination of Research and Short-Term Trade Ideas RBC Capital Markets endeavors to make all reasonable efforts to provide research simultaneously to all eligible clients, having regard to local time zones in overseas jurisdictions. RBC Capital Markets' research is posted to our proprietary websites to ensure eligible clients receive coverage initiations and changes in ratings, targets and opinions in a timely manner. Additional distribution may be done by the sales personnel via email, fax or regular mail. Clients may also receive our research via third-party vendors. Please contact your investment advisor or institutional salesperson for more information regarding RBC Capital Markets' research. RBC Capital Markets also provides eligible clients with access to SPARC on its proprietary INSIGHT website. SPARC contains market color and commentary, and may also contain Short-Term Trade Ideas regarding the securities of subject companies discussed in this or other Brookfield Office PropertiesAugust 6, 2012
  • 11. 11 research reports. SPARC may be accessed via the following hyperlink: https://www.rbcinsight.com. A Short-Term Trade Idea reflects the research analyst's directional view regarding the price of the security of a subject company in the coming days or weeks, based on market and trading events. A Short-Term Trade Idea may differ from the price targets and/or recommendations in our published research reports reflecting the research analyst's views of the longer-term (one year) prospects of the subject company, as a result of the differing time horizons, methodologies and/or other factors. Thus, it is possible that the security of a subject company that is considered a long-term 'Sector Perform' or even an 'Underperform' might be a short-term buying opportunity as a result of temporary selling pressure in the market; conversely, the security of a subject company that is rated a long-term 'Outperform' could be considered susceptible to a short-term downward price correction. Short-Term Trade Ideas are not ratings, nor are they part of any ratings system, and RBC Capital Markets generally does not intend, nor undertakes any obligation, to maintain or update Short-Term Trade Ideas. Short-Term Trade Ideas discussed in SPARC may not be suitable for all investors and have not been tailored to individual investor circumstances and objectives, and investors should make their own independent decisions regarding any Short-Term Trade Ideas discussed therein. Analyst Certification All of the views expressed in this report accurately reflect the personal views of the responsible analyst(s) about any and all of the subject securities or issuers. No part of the compensation of the responsible analyst(s) named herein is, or will be, directly or indirectly, related to the specific recommendations or views expressed by the responsible analyst(s) in this report. The Global Industry Classification Standard (“GICS”) was developed by and is the exclusive property and a service mark of MSCI Inc. (“MSCI”) and Standard & Poor’s Financial Services LLC (“S&P”) and is licensed for use by RBC. Neither MSCI, S&P, nor any other party involved in making or compiling the GICS or any GICS classifications makes any express or implied warranties or representations with respect to such standard or classification (or the results to be obtained by the use thereof), and all such parties hereby expressly disclaim all warranties of originality, accuracy, completeness, merchantability and fitness for a particular purpose with respect to any of such standard or classification. Without limiting any of the foregoing, in no event shall MSCI, S&P, any of their affiliates or any third party involved in making or compiling the GICS or any GICS classifications have any liability for any direct, indirect, special, punitive, consequential or any other damages (including lost profits) even if notified of the possibility of such damages. Disclaimer RBC Capital Markets is the business name used by certain branches and subsidiaries of the Royal Bank of Canada, including RBC Dominion Securities Inc., RBC Capital Markets, LLC, RBC Europe Limited, RBC Capital Markets (Hong Kong) Limited, Royal Bank of Canada, Hong Kong Branch and Royal Bank of Canada, Sydney Branch. The information contained in this report has been compiled by RBC Capital Markets from sources believed to be reliable, but no representation or warranty, express or implied, is made by Royal Bank of Canada, RBC Capital Markets, its affiliates or any other person as to its accuracy, completeness or correctness. All opinions and estimates contained in this report constitute RBC Capital Markets' judgement as of the date of this report, are subject to change without notice and are provided in good faith but without legal responsibility. Nothing in this report constitutes legal, accounting or tax advice or individually tailored investment advice. This material is prepared for general circulation to clients and has been prepared without regard to the individual financial circumstances and objectives of persons who receive it. The investments or services contained in this report may not be suitable for you and it is recommended that you consult an independent investment advisor if you are in doubt about the suitability of such investments or services. This report is not an offer to sell or a solicitation of an offer to buy any securities. Past performance is not a guide to future performance, future returns are not guaranteed, and a loss of original capital may occur. RBC Capital Markets research analyst compensation is based in part on the overall profitability of RBC Capital Markets, which includes profits attributable to investment banking revenues. Every province in Canada, state in the U.S., and most countries throughout the world have their own laws regulating the types of securities and other investment products which may be offered to their residents, as well as the process for doing so. As a result, the securities discussed in this report may not be eligible for sale in some jurisdictions. RBC Capital Markets may be restricted from publishing research reports, from time to time, due to regulatory restrictions and/or internal compliance policies. If this is the case, the latest published research reports available to clients may not reflect recent material changes in the applicable industry and/or applicable subject companies. RBC Capital Markets research reports are current only as of the date set forth on the research reports. This report is not, and under no circumstances should be construed as, a solicitation to act as securities broker or dealer in any jurisdiction by any person or company that is not legally permitted to carry on the business of a securities broker or dealer in that jurisdiction. To the full extent permitted by law neither RBC Capital Markets nor any of its affiliates, nor any other person, accepts any liability whatsoever for any direct or consequential loss arising from any use of this report or the information contained herein. No matter contained in this document may be reproduced or copied by any means without the prior consent of RBC Capital Markets. Additional information is available on request. To U.S. Residents: This publication has been approved by RBC Capital Markets, LLC (member FINRA, NYSE, SIPC), which is a U.S. registered broker-dealer and which accepts responsibility for this report and its dissemination in the United States. Any U.S. recipient of this report that is not a registered broker-dealer or a bank acting in a broker or dealer capacity and that wishes further information regarding, or to effect any transaction in, any of the securities discussed in this report, should contact and place orders with RBC Capital Markets, LLC. To Canadian Residents: This publication has been approved by RBC Dominion Securities Inc.(member IIROC). Any Canadian recipient of this report that is not a Designated Institution in Ontario, an Accredited Investor in British Columbia or Alberta or a Sophisticated Purchaser in Quebec (or similar permitted purchaser in any other province) and that wishes further information regarding, or to effect any transaction in, any of the securities discussed in this report should contact and place orders with RBC Dominion Securities Inc., which, without in any way limiting the foregoing, accepts responsibility for this report and its dissemination in Canada. To U.K. Residents: This publication has been approved by RBC Europe Limited ('RBCEL') which is authorized and regulated by Financial Services Authority ('FSA'), in connection with its distribution in the United Kingdom. This material is not for general distribution in the United Kingdom to retail clients, as defined under the rules of the FSA. However, targeted distribution may be made to selected retail clients of RBC and its affiliates. RBCEL accepts responsibility for this report and its dissemination in the United Kingdom. To Persons Receiving This Advice in Australia: This material has been distributed in Australia by Royal Bank of Canada - Sydney Branch (ABN 86 076 940 880, AFSL No. 246521). This material has been prepared for general circulation and does not take into account the objectives, financial situation or needs of any recipient. Accordingly, any recipient should, before acting on this material, consider the appropriateness of this material having regard to their objectives, financial situation and needs. If this material relates to the acquisition or possible acquisition of a particular financial product, a recipient in Australia should obtain any relevant disclosure document prepared in respect of that product and consider that document before making any decision about whether to acquire the product. To Hong Kong Residents: Brookfield Office PropertiesAugust 6, 2012
  • 12. 12 This publication is distributed in Hong Kong by RBC Investment Services (Asia) Limited, RBC Investment Management (Asia) Limited and RBC Capital Markets (Hong Kong) Limited, licensed corporations under the Securities and Futures Ordinance or, by the Royal Bank of Canada, Hong Kong Branch, a registered institution under the Securities and Futures Ordinance. This material has been prepared for general circulation and does not take into account the objectives, financial situation, or needs of any recipient. Hong Kong persons wishing to obtain further information on any of the securities mentioned in this publication should contact RBC Investment Services (Asia) Limited, RBC Investment Management (Asia) Limited, RBC Capital Markets (Hong Kong) Limited or Royal Bank of Canada, Hong Kong Branch at 17/Floor, Cheung Kong Center, 2 Queen's Road Central, Hong Kong (telephone number is 2848-1388). To Singapore Residents: This publication is distributed in Singapore by the Royal Bank of Canada, Singapore Branch and Royal Bank of Canada (Asia) Limited, registered entities granted offshore bank and merchant bank status by the Monetary Authority of Singapore, respectively. This material has been prepared for general circulation and does not take into account the objectives, financial situation, or needs of any recipient. You are advised to seek independent advice from a financial adviser before purchasing any product. If you do not obtain independent advice, you should consider whether the product is suitable for you. Past performance is not indicative of future performance. If you have any questions related to this publication, please contact the Royal Bank of Canada, Singapore Branch or Royal Bank of Canada (Asia) Limited. To Japanese Residents: Unless otherwise exempted by Japanese law, this publication is distributed in Japan by or through RBC Capital Markets (Japan) Ltd., a registered type one financial instruments firm and/or Royal Bank of Canada, Tokyo Branch, a licensed foreign bank. .® Registered trademark of Royal Bank of Canada. RBC Capital Markets is a trademark of Royal Bank of Canada. Used under license. Copyright © RBC Capital Markets, LLC 2012 - Member SIPC Copyright © RBC Dominion Securities Inc. 2012 - Member CIPF Copyright © RBC Europe Limited 2012 Copyright © Royal Bank of Canada 2012 All rights reserved Brookfield Office PropertiesAugust 6, 2012