SlideShare a Scribd company logo
1 of 5
Download to read offline
Kevin Cheng, CFA
Kevincheng21@hotmail.com
647.996.8896
Market Outlook – April 2010
Over the past two
decades, a flatter
yield curve has
implied positive
market returns,
with average
returns of 12.5%
The Macro View:
Improving Economic Fundamentals Suggest Cyclical Positioning
Over the past few quarters, market dynamics have been characterized by low interest
rates, surging government spending and increased intervention in the financial system.
However, these dynamics are starting to change as the global economy begins to recover
from a deep recession and financial crisis. Global central banks are beginning to tighten
policy (or have become more hawkish), quantitative easing is drawing to a close, and
government stimulus is running dry.
Some of the notable government stimulus packages implemented during the financial crisis
include: TALF ($900BN), TARP ($700BN), Fannie Mae/Freddie Mac ($400BN), AIG ($53BN),
Bear Stearns ($29BN), etc. Governments have gone to such extraordinary lengths to
support economic growth and save the financial system that the primary concern for
markets right now remains whether that growth can be sustained without these simulative
measures and within a higher interest rate environment.
Firstly, the prospects of higher short term rates (in both Canada and the U.S.) are not likely
to have any immediate impact to economic growth, as monetary policy normally operates
with a lagged effect. As highlighted in Exhibit 1, a flatter yield curve has typically suggested
more tepid equity market gains. This correlation has been well established over the past
two decades, and is particularly noticeable during periods where the yield curve is
flattening (but has not yet inverted). Over that time, the S&P 500 averaged annual gains of
12.5%, which suggests additional upside for equity markets from this juncture.
Exhibit 1: Flatter Curve Suggests More Tepid Equity Market Gains
-3
-2
-1
0
1
2
3
4
Jan-90 Jan-92 Jan-94 Jan-96 Jan-98 Jan-00 Jan-02 Jan-04 Jan-06 Jan-08 Jan-10
-60%
-40%
-20%
0%
20%
40%
60%
UST 10-year minus 2-year (adv 12-mths, L) S&P 500 (y/y % chg, R)
Source: Bloomberg;
Furthermore, despite some pockets of still soft U.S. economic data, (most notably
unemployment), a number of economic indicators have started to improve recently. A key
example has been the Conference Board’s Leading Economic Indicators (LEI) Index, which
has improved significantly over the past year. As Exhibit 2 illustrates, the LEI Index has
been tightly positively correlated (approximately 60%) with North American equity market
returns over the past few economic cycles and I expect this cycle to be no different.
Moreover, by advancing the LEI index modestly, the index can be used as an important
market timing indicator for evaluating future returns. For example, when the LEI Index has
been positive on a y/y basis, North American equity markets have averaged returns of
11.5%.
Various leading
indicators suggest
a constructive
backdrop for
equities ahead
Exhibit 2-LEI Outlook: Constructive For North American Equities
-75%
-50%
-25%
0%
25%
50%
75%
Jan-98 Jan-00 Jan-02 Jan-04 Jan-06 Jan-08 Jan-10
-12
-9
-6
-3
0
3
6
9
12
Average (SPX and TSX y/y % chg) Leading Economic Indicators (y/y % chg, adv 6-mths)
Source: Bloomberg
Another important market indicator for future equity returns is the ISM Services Index.
Given that both Canada and U.S. are heavily weighted towards the service sector, the ISM
Index provides a good indication of the health and performance of this key component of
the North American economy. As Exhibit 3 demonstrates, the ISM Services Index has
proven to be an excellent indicator for predicting turns in the market.
Exhibit 3-ISM Services Signals Further Equity Market Gains
-75%
-50%
-25%
0%
25%
50%
75%
Jan-98 Jan-00 Jan-02 Jan-04 Jan-06 Jan-08 Jan-10
30
35
40
45
50
55
60
65
70
Average (SPX and TSX y/y % chg) ISM Services (advanced 6-mths)
Source: Bloomberg
Asset Allocation
Equities over Bonds
Despite the impressive year over year gains achieved so far on the S&P 500 and the TSX,
key leading indicators continue to suggest that the current stock market rally is not over
just yet. Given that the AGF’s Canadian Balanced Fund is currently benchmarked against
the total return index of the S&P TSX (60%) and the DEX Universe Bond Total Return Index
(40%), I would suggest a slightly more aggressive tilt to the current asset allocation mix
with a 35-30% weighting in bonds and 65% to 70% weighting in equities.
From my perspective, the North American economies look to be in the early innings of a
slow yet sustainable long-term recovery, similar to the situation in the mid-1990s. During
that time frame, annual equity returns averaged approximately 16%, further justifying an
overweight in equities. Taking into consideration that the Canadian Balanced fund has a
low-to-medium risk profile, the following Exhibit shows my recommended asset allocation
weights.
Stay the investment
course: Cyclicals
have worked well
over the past few
quarters and are
likely to outperform
in the near-term”
Exhibit 4-Asset Allocation Recommendations
Top 10 Sector Allocation
Recomm.
Asset Class Weight (%) Weight (%) Difference
Governments 31.4 27.8 -3.6
Materials 18.4 19.9 1.5
Energy 15.4 16.4 1.0
Financials 9.5 11.0 1.5
Telecom Services 5.0 5.5 0.5
Consumer Staples 4.5 3.5 -1.0
Provincials 3.6 2.5 -1.1
Utilities 1.7 1.7 0.0
Industrials 1.1 1.4 0.3
Info. Technology 1.1 2.0 0.9
Total 91.7 91.7 0.0
Regional Mix
Weight
Weight Recomm. Difference
Canada 74.0% 78.0% 4.0%
United States 12.7% 14.2% 1.5%
Latin America 0.6% 0.6% 0.0%
Pacific Rim 0.3% 0.8% 0.5%
Cash 12.4% 6.4% -6.0%
Source: AGF Website
Equity Outlook
Equities: Cyclicals over Defensives
Following one of the deepest recessions since the Great Depression, the thematic trade of
long cyclicals (relative to defensives) has performed very well over the past few quarters.
As shown in Exhibit 5, six of the top 10 sectors on a year over year basis are cyclically
sensitive. Going forward, I expect these sectors to continue to outperform their defensive
counterparts, as global economic prospects continue to improve.
Exhibit 5-Cyclicals Outperform Defensives
12-mth % chg
Sector Type S&P TSX S&P 500 Average
Financials Cyclical 60.4% 80.4% 70.4%
Industrials Cyclical 46.7% 68.6% 57.6%
Technology Cyclical 40.6% 56.4% 48.5%
Consumer Discretionary Cyclical 28.1% 67.1% 47.6%
Materials Cyclical 24.2% 53.0% 38.6%
Health Care Defensive 38.2% 31.7% 34.9%
Energy Cyclical 32.9% 26.7% 29.8%
Utilities Defensive 32.2% 15.6% 23.9%
Consumer Staples Defensive 13.3% 31.7% 22.5%
Telecom Services Defensive 15.2% 5.8% 10.5%
Index 38.0% 46.6% 42.3%
This thematic trade has worked well on both the S&P TSX and the S&P 500. As
demonstrated in Exhibit 6, the sector performance of S&P 500 Industrials relative to
Consumer Staples has typically outperformed during upswings in the S&P 500 and
underperformed during downswings. Meanwhile, the TSX Energy sector has also
outperformed TSX Utilities throughout the various TSX cycles.
On balance, the current phase of the equity market rally offers a higher risk and lower
reward profile relative to the market profile 6 months ago. However, investors can still
expect to see high single-digit to low double digit returns over the next few years as the
economy continues to recover. At this stage of the cycle, benchmark outperformance will
likely result from asset allocation and sector selection as opposed to security selection.
Historic lows in the
Fed Funds rate,
combined with
underlying demand
for 10-year
Treasuries suggest
a Bear Flattener
strategy
Exhibit 6- Thematic Trade Works In Both North American Markets
40
60
80
100
120
140
160
180
Dec-97 Dec-99 Dec-01 Dec-03 Dec-05 Dec-07 Dec-09
80
100
120
140
160
180
200
220
240
260
280
Industrials / Cons. Staples (R) S&P 500 (1995=100, L)
50
75
100
125
150
175
200
225
Dec-97 Dec-99 Dec-01 Dec-03 Dec-05 Dec-07
50
75
100
125
150
175
200
225
Energy / Utilities (R) S&P TSX (1997 = 100, L)
Source: Bloomberg
Fixed Income Outlook
Bear Flatteners; Corporates over Treasuries
Given the current rate environment, short-term interest rates are likely to increase at a
faster rate than long-term interest rates and fixed income investors should employ a bear
flattener strategy to outperform relative benchmarks. There are two primary drivers behind
the bear flattener strategy a) record low fed funds target rate and b) strong underlying
demand for long term US$-denominated debt.
Firstly, the Fed funds target rate is already at an all-time low with no where to go but up.
Since 1971, the Fed Funds rate has averaged 622bps average, and barring another
financial crisis, interest rates are likely to rise from their current 25bps level towards their
long term-average over the next few years. That should continue to lift rates significantly
at the short-end of the curve, suggesting that the portfolio should be underweight short-
term bonds in the near term.
Exhibit 7: Interest Rates Set To Rise From Historic Lows
0
5
10
15
20
25
Jan-71 Jan-76 Jan-81 Jan-86 Jan-91 Jan-96 Jan-01 Jan-06
Fed Funds Target Rate Long-term Average
Source: Bloomberg
The second driver in the bear flattener strategy is that foreign demand for US$
denominated debt still remains very strong as demonstrated by last week’s U.S. Treasury
10-year auction. Results in that auction came in at an all time high of 3.72x bid-to-cover,
as shown in Exhibit 8. Moreover, indirects were also strong at 43.1% (outpacing Primary
Dealers for the first time since September), which suggests that China may have resumed
its purchases of U.S. Treasuries. In addition, the ongoing problems within Europe, (most
notably Portugal, Ireland, Greece, Spain or the PIGS economies), remain a lingering
headwind to European debt markets, thus leaving fixed income investors with few
alternatives outside of U.S. Treasuries. Net-net, investors should remain overweight long-
term bonds relative to short-term bonds, to outperform the benchmark in the near term.
Equities over
Bonds, Cyclicals
over Defensives,
Corporates over
Treasuries
Exhibit 8: Foreigners Still Willing To Fund U.S. Debt
1.0
1.5
2.0
2.5
3.0
3.5
4.0
Nov-93 Nov-95 Nov-97 Nov-99 Nov-01 Nov-03 Nov-05 Nov-07 Nov-09
UST 10-year auction: bid-to-cover
Record High
Source: Bloomberg
Meanwhile, a healthy corporate sector, strong balance sheets, declining default rates and
attractive yields continue to merit an overweight allocation for Corporate bonds within the
fixed income portfolio. As shown in Exhibit 7, corporate yield spreads continue to come off
their highs (a 630 bps spread), reached during the height of the bear market in Q4 2008,
and has further room for improvement. On balance, improving economic fundamentals are
likely to help corporate spreads to narrow towards their longer term average of 215bps.
Exhibit 9: Corporate Backdrop Supportive Of Narrower Spreads
0
1
2
3
4
5
6
7
Jan-71 Jan-76 Jan-81 Jan-86 Jan-91 Jan-96 Jan-01 Jan-06
Corporate Spreads (BAA - 10yr UST, %) Long-term Average
Source: Bloomberg
Investment Summary
Investors should be properly positioned for a modest economic recovery, which means that
despite a rising rate environment stocks should still do well. Within equity markets,
investment managers should favor stocks over bonds with a focus on cyclical sectors (ie.
Industrials, Info technology, Consumer Discretionary), higher beta names (ie. small cap
over large caps) and currencies with a cyclical-tilt (ie. Long CAD, AUD versus USD). On the
fixed income side, investors should favour spread product (ie. Corporates, High-Yield), while
remaining overweight long term bonds relative to short term bonds, in light of higher
interest rates on the horizon. Overall, central banks are likely to err on the side of caution
when it comes to raising interest rates, as growth risks continue to outweigh inflation risks,
at this point in the cycle.

More Related Content

What's hot

Putnam Perspectives: Fixed-Income Outlook Q3 2014
Putnam Perspectives: Fixed-Income Outlook Q3 2014Putnam Perspectives: Fixed-Income Outlook Q3 2014
Putnam Perspectives: Fixed-Income Outlook Q3 2014Putnam Investments
 
Accenture Spend Trends Report Q1 2015
Accenture Spend Trends Report Q1 2015Accenture Spend Trends Report Q1 2015
Accenture Spend Trends Report Q1 2015Accenture Operations
 
Canada M&A Insights - March 2017
Canada M&A Insights - March 2017Canada M&A Insights - March 2017
Canada M&A Insights - March 2017Duff & Phelps
 
2017 Market Outlook - International Equity
2017 Market Outlook - International Equity 2017 Market Outlook - International Equity
2017 Market Outlook - International Equity T. Rowe Price
 
Mercer Capital's Bank Watch | December 2019 | 2020 Outlook: Good Fundamentals...
Mercer Capital's Bank Watch | December 2019 | 2020 Outlook: Good Fundamentals...Mercer Capital's Bank Watch | December 2019 | 2020 Outlook: Good Fundamentals...
Mercer Capital's Bank Watch | December 2019 | 2020 Outlook: Good Fundamentals...Mercer Capital
 
JUNE MARKET: INVESTORS UPBEAT, BUT CAUTIOUS AMIDST BUDGET SIGNING, ECONOMIC D...
JUNE MARKET: INVESTORS UPBEAT, BUT CAUTIOUS AMIDST BUDGET SIGNING, ECONOMIC D...JUNE MARKET: INVESTORS UPBEAT, BUT CAUTIOUS AMIDST BUDGET SIGNING, ECONOMIC D...
JUNE MARKET: INVESTORS UPBEAT, BUT CAUTIOUS AMIDST BUDGET SIGNING, ECONOMIC D...Akan Udofia
 
Capital Markets Review Q1 2009
Capital Markets Review Q1 2009Capital Markets Review Q1 2009
Capital Markets Review Q1 2009dkeogh
 
The Key 2013 — Deutsche Bank Presenation — Larry Adam
The Key 2013 — Deutsche Bank Presenation — Larry AdamThe Key 2013 — Deutsche Bank Presenation — Larry Adam
The Key 2013 — Deutsche Bank Presenation — Larry AdamConcierge Auctions
 
Finlight Research - Market Perspectives - Mar 2015
Finlight Research - Market Perspectives - Mar 2015Finlight Research - Market Perspectives - Mar 2015
Finlight Research - Market Perspectives - Mar 2015Zouheir Ben Tamarout
 
Putnam Perspectives: Fixed Income Outlook Q1 2014
Putnam Perspectives: Fixed Income Outlook Q1 2014Putnam Perspectives: Fixed Income Outlook Q1 2014
Putnam Perspectives: Fixed Income Outlook Q1 2014Putnam Investments
 
US Real Estate Indicators Report
US Real Estate Indicators ReportUS Real Estate Indicators Report
US Real Estate Indicators Reportcutmytaxes
 
Capital Market 1st Quarter 2010
Capital Market 1st Quarter 2010Capital Market 1st Quarter 2010
Capital Market 1st Quarter 2010pospime
 
4th Quarter 2017 Market Update
4th Quarter 2017 Market Update4th Quarter 2017 Market Update
4th Quarter 2017 Market UpdateSarah Cuddy
 
1158474868049 mi gtm-4_q18_webapp
1158474868049 mi gtm-4_q18_webapp1158474868049 mi gtm-4_q18_webapp
1158474868049 mi gtm-4_q18_webappA C
 
2020 Investment Outlook: Risks and Opportunities for Investors in Global Markets
2020 Investment Outlook: Risks and Opportunities for Investors in Global Markets2020 Investment Outlook: Risks and Opportunities for Investors in Global Markets
2020 Investment Outlook: Risks and Opportunities for Investors in Global MarketsMaxine Elliott
 

What's hot (19)

Putnam Perspectives: Fixed-Income Outlook Q3 2014
Putnam Perspectives: Fixed-Income Outlook Q3 2014Putnam Perspectives: Fixed-Income Outlook Q3 2014
Putnam Perspectives: Fixed-Income Outlook Q3 2014
 
Accenture Spend Trends Report Q1 2015
Accenture Spend Trends Report Q1 2015Accenture Spend Trends Report Q1 2015
Accenture Spend Trends Report Q1 2015
 
Canada M&A Insights - March 2017
Canada M&A Insights - March 2017Canada M&A Insights - March 2017
Canada M&A Insights - March 2017
 
2017 Market Outlook - International Equity
2017 Market Outlook - International Equity 2017 Market Outlook - International Equity
2017 Market Outlook - International Equity
 
Mercer Capital's Bank Watch | December 2019 | 2020 Outlook: Good Fundamentals...
Mercer Capital's Bank Watch | December 2019 | 2020 Outlook: Good Fundamentals...Mercer Capital's Bank Watch | December 2019 | 2020 Outlook: Good Fundamentals...
Mercer Capital's Bank Watch | December 2019 | 2020 Outlook: Good Fundamentals...
 
JUNE MARKET: INVESTORS UPBEAT, BUT CAUTIOUS AMIDST BUDGET SIGNING, ECONOMIC D...
JUNE MARKET: INVESTORS UPBEAT, BUT CAUTIOUS AMIDST BUDGET SIGNING, ECONOMIC D...JUNE MARKET: INVESTORS UPBEAT, BUT CAUTIOUS AMIDST BUDGET SIGNING, ECONOMIC D...
JUNE MARKET: INVESTORS UPBEAT, BUT CAUTIOUS AMIDST BUDGET SIGNING, ECONOMIC D...
 
Capital Markets Review Q1 2009
Capital Markets Review Q1 2009Capital Markets Review Q1 2009
Capital Markets Review Q1 2009
 
The Key 2013 — Deutsche Bank Presenation — Larry Adam
The Key 2013 — Deutsche Bank Presenation — Larry AdamThe Key 2013 — Deutsche Bank Presenation — Larry Adam
The Key 2013 — Deutsche Bank Presenation — Larry Adam
 
Putnam Outlook Q3 2013
Putnam Outlook Q3 2013Putnam Outlook Q3 2013
Putnam Outlook Q3 2013
 
Support System
Support SystemSupport System
Support System
 
Finlight Research - Market Perspectives - Mar 2015
Finlight Research - Market Perspectives - Mar 2015Finlight Research - Market Perspectives - Mar 2015
Finlight Research - Market Perspectives - Mar 2015
 
Putnam Perspectives: Fixed Income Outlook Q1 2014
Putnam Perspectives: Fixed Income Outlook Q1 2014Putnam Perspectives: Fixed Income Outlook Q1 2014
Putnam Perspectives: Fixed Income Outlook Q1 2014
 
US Outlook 2H18/1H19
US Outlook 2H18/1H19US Outlook 2H18/1H19
US Outlook 2H18/1H19
 
US Real Estate Indicators Report
US Real Estate Indicators ReportUS Real Estate Indicators Report
US Real Estate Indicators Report
 
Capital Market 1st Quarter 2010
Capital Market 1st Quarter 2010Capital Market 1st Quarter 2010
Capital Market 1st Quarter 2010
 
Major league investments montoya newsletter
Major league investments montoya newsletterMajor league investments montoya newsletter
Major league investments montoya newsletter
 
4th Quarter 2017 Market Update
4th Quarter 2017 Market Update4th Quarter 2017 Market Update
4th Quarter 2017 Market Update
 
1158474868049 mi gtm-4_q18_webapp
1158474868049 mi gtm-4_q18_webapp1158474868049 mi gtm-4_q18_webapp
1158474868049 mi gtm-4_q18_webapp
 
2020 Investment Outlook: Risks and Opportunities for Investors in Global Markets
2020 Investment Outlook: Risks and Opportunities for Investors in Global Markets2020 Investment Outlook: Risks and Opportunities for Investors in Global Markets
2020 Investment Outlook: Risks and Opportunities for Investors in Global Markets
 

Similar to Agf market outlook

Equity Strategy - Staying Defensive
Equity Strategy - Staying DefensiveEquity Strategy - Staying Defensive
Equity Strategy - Staying DefensiveKevin Cheng, CFA
 
BoyarMiller Breakfast Forum: The Current State of the Capital Markets 2010
BoyarMiller Breakfast Forum: The Current State of the Capital Markets 2010BoyarMiller Breakfast Forum: The Current State of the Capital Markets 2010
BoyarMiller Breakfast Forum: The Current State of the Capital Markets 2010BoyarMiller
 
Fall 2015 AREIT Board Meeting Presentation FINAL
Fall 2015 AREIT Board Meeting Presentation FINALFall 2015 AREIT Board Meeting Presentation FINAL
Fall 2015 AREIT Board Meeting Presentation FINALZi Chong
 
Market outlook equity march 2021
Market outlook equity march 2021Market outlook equity march 2021
Market outlook equity march 2021Rahulpathak154
 
Global Economic Update & Strategic Investment Outlook Q2 2014
Global Economic Update & Strategic Investment Outlook Q2 2014Global Economic Update & Strategic Investment Outlook Q2 2014
Global Economic Update & Strategic Investment Outlook Q2 2014Cohen and Company
 
LBS Asset Allocation August Update - July 28, 2017
LBS Asset Allocation August Update - July 28, 2017LBS Asset Allocation August Update - July 28, 2017
LBS Asset Allocation August Update - July 28, 2017Mark MacIsaac
 
2017 Market Outlook - U.S. Equity
2017 Market Outlook - U.S. Equity2017 Market Outlook - U.S. Equity
2017 Market Outlook - U.S. EquityT. Rowe Price
 
Juris wealth the corona virus, market declines and volatility
Juris wealth   the corona virus, market declines and volatilityJuris wealth   the corona virus, market declines and volatility
Juris wealth the corona virus, market declines and volatilityTimothy Corriero
 
Baird municipal market update may 2015
Baird municipal market update may 2015Baird municipal market update may 2015
Baird municipal market update may 2015sande833
 
Value with Income Portfolio Review - Q1 2013 FINAL
Value with Income Portfolio Review - Q1 2013 FINALValue with Income Portfolio Review - Q1 2013 FINAL
Value with Income Portfolio Review - Q1 2013 FINALRobert N. Tankson, III
 
Pennsylvania Trust Economic Insights - 4th Quarter 2016
Pennsylvania Trust Economic Insights - 4th Quarter 2016Pennsylvania Trust Economic Insights - 4th Quarter 2016
Pennsylvania Trust Economic Insights - 4th Quarter 2016Jonathan Heckscher
 
Final Paper Submission
Final Paper SubmissionFinal Paper Submission
Final Paper SubmissionMike Farkas
 
LGIP 3rd Quarter
LGIP 3rd QuarterLGIP 3rd Quarter
LGIP 3rd Quarterdougducey
 
BMO-TCH-Mid-Q3-Update_FINAL
BMO-TCH-Mid-Q3-Update_FINALBMO-TCH-Mid-Q3-Update_FINAL
BMO-TCH-Mid-Q3-Update_FINALAdam Phillips
 

Similar to Agf market outlook (20)

Equity Strategy - Staying Defensive
Equity Strategy - Staying DefensiveEquity Strategy - Staying Defensive
Equity Strategy - Staying Defensive
 
BoyarMiller Breakfast Forum: The Current State of the Capital Markets 2010
BoyarMiller Breakfast Forum: The Current State of the Capital Markets 2010BoyarMiller Breakfast Forum: The Current State of the Capital Markets 2010
BoyarMiller Breakfast Forum: The Current State of the Capital Markets 2010
 
Fall 2015 AREIT Board Meeting Presentation FINAL
Fall 2015 AREIT Board Meeting Presentation FINALFall 2015 AREIT Board Meeting Presentation FINAL
Fall 2015 AREIT Board Meeting Presentation FINAL
 
Market outlook equity march 2021
Market outlook equity march 2021Market outlook equity march 2021
Market outlook equity march 2021
 
Global Economic Update & Strategic Investment Outlook Q2 2014
Global Economic Update & Strategic Investment Outlook Q2 2014Global Economic Update & Strategic Investment Outlook Q2 2014
Global Economic Update & Strategic Investment Outlook Q2 2014
 
LBS Asset Allocation August Update - July 28, 2017
LBS Asset Allocation August Update - July 28, 2017LBS Asset Allocation August Update - July 28, 2017
LBS Asset Allocation August Update - July 28, 2017
 
2017 Market Outlook - U.S. Equity
2017 Market Outlook - U.S. Equity2017 Market Outlook - U.S. Equity
2017 Market Outlook - U.S. Equity
 
Weekly Market Review - October 18, 2013
Weekly Market Review - October 18, 2013Weekly Market Review - October 18, 2013
Weekly Market Review - October 18, 2013
 
2014 Economic Outlook Briefing
2014 Economic Outlook Briefing2014 Economic Outlook Briefing
2014 Economic Outlook Briefing
 
Juris wealth the corona virus, market declines and volatility
Juris wealth   the corona virus, market declines and volatilityJuris wealth   the corona virus, market declines and volatility
Juris wealth the corona virus, market declines and volatility
 
Baird municipal market update may 2015
Baird municipal market update may 2015Baird municipal market update may 2015
Baird municipal market update may 2015
 
Global Economics Report - September 2014
Global Economics Report - September 2014Global Economics Report - September 2014
Global Economics Report - September 2014
 
Value with Income Portfolio Review - Q1 2013 FINAL
Value with Income Portfolio Review - Q1 2013 FINALValue with Income Portfolio Review - Q1 2013 FINAL
Value with Income Portfolio Review - Q1 2013 FINAL
 
Pennsylvania Trust Economic Insights - 4th Quarter 2016
Pennsylvania Trust Economic Insights - 4th Quarter 2016Pennsylvania Trust Economic Insights - 4th Quarter 2016
Pennsylvania Trust Economic Insights - 4th Quarter 2016
 
The Laird Report - January 11 2014
The Laird Report - January 11 2014The Laird Report - January 11 2014
The Laird Report - January 11 2014
 
Final Paper Submission
Final Paper SubmissionFinal Paper Submission
Final Paper Submission
 
Global Economics Update - May 2015
Global Economics Update - May 2015Global Economics Update - May 2015
Global Economics Update - May 2015
 
Global Economics Update - January 2015
Global Economics Update - January 2015Global Economics Update - January 2015
Global Economics Update - January 2015
 
LGIP 3rd Quarter
LGIP 3rd QuarterLGIP 3rd Quarter
LGIP 3rd Quarter
 
BMO-TCH-Mid-Q3-Update_FINAL
BMO-TCH-Mid-Q3-Update_FINALBMO-TCH-Mid-Q3-Update_FINAL
BMO-TCH-Mid-Q3-Update_FINAL
 

More from Kevin Cheng, CFA

Equity Strategy - Consumer Staples
Equity Strategy - Consumer StaplesEquity Strategy - Consumer Staples
Equity Strategy - Consumer StaplesKevin Cheng, CFA
 
Brookfield Office Properties - BPO - Quarterly Earnings
Brookfield Office Properties - BPO - Quarterly EarningsBrookfield Office Properties - BPO - Quarterly Earnings
Brookfield Office Properties - BPO - Quarterly EarningsKevin Cheng, CFA
 
First Capital Realty - FCR
First Capital Realty - FCRFirst Capital Realty - FCR
First Capital Realty - FCRKevin Cheng, CFA
 
CXP initiation - Office REIT
CXP initiation - Office REITCXP initiation - Office REIT
CXP initiation - Office REITKevin Cheng, CFA
 
Canadian Asset Managers - Initiation Report
Canadian Asset Managers - Initiation ReportCanadian Asset Managers - Initiation Report
Canadian Asset Managers - Initiation ReportKevin Cheng, CFA
 
Asset Managers - Recession risks, Trust Banks & Asset Mgrs
Asset Managers - Recession risks, Trust Banks & Asset MgrsAsset Managers - Recession risks, Trust Banks & Asset Mgrs
Asset Managers - Recession risks, Trust Banks & Asset MgrsKevin Cheng, CFA
 
Asset Managers - Defensive But Not Immune
Asset Managers - Defensive But Not ImmuneAsset Managers - Defensive But Not Immune
Asset Managers - Defensive But Not ImmuneKevin Cheng, CFA
 

More from Kevin Cheng, CFA (12)

Equity Strategy - Consumer Staples
Equity Strategy - Consumer StaplesEquity Strategy - Consumer Staples
Equity Strategy - Consumer Staples
 
Brookfield Office Properties - BPO - Quarterly Earnings
Brookfield Office Properties - BPO - Quarterly EarningsBrookfield Office Properties - BPO - Quarterly Earnings
Brookfield Office Properties - BPO - Quarterly Earnings
 
First Capital Realty - FCR
First Capital Realty - FCRFirst Capital Realty - FCR
First Capital Realty - FCR
 
Equity Strategy - TSX
Equity Strategy - TSXEquity Strategy - TSX
Equity Strategy - TSX
 
Focus - Economic Research
Focus - Economic ResearchFocus - Economic Research
Focus - Economic Research
 
DEA Initiation Report
DEA Initiation ReportDEA Initiation Report
DEA Initiation Report
 
CXP initiation - Office REIT
CXP initiation - Office REITCXP initiation - Office REIT
CXP initiation - Office REIT
 
Canadian Asset Managers - Initiation Report
Canadian Asset Managers - Initiation ReportCanadian Asset Managers - Initiation Report
Canadian Asset Managers - Initiation Report
 
Asset Managers - Recession risks, Trust Banks & Asset Mgrs
Asset Managers - Recession risks, Trust Banks & Asset MgrsAsset Managers - Recession risks, Trust Banks & Asset Mgrs
Asset Managers - Recession risks, Trust Banks & Asset Mgrs
 
Asset Managers - Defensive But Not Immune
Asset Managers - Defensive But Not ImmuneAsset Managers - Defensive But Not Immune
Asset Managers - Defensive But Not Immune
 
The deleveraging cycle
The deleveraging cycleThe deleveraging cycle
The deleveraging cycle
 
Market Strategy
Market StrategyMarket Strategy
Market Strategy
 

Recently uploaded

05_Annelore Lenoir_Docbyte_MeetupDora&Cybersecurity.pptx
05_Annelore Lenoir_Docbyte_MeetupDora&Cybersecurity.pptx05_Annelore Lenoir_Docbyte_MeetupDora&Cybersecurity.pptx
05_Annelore Lenoir_Docbyte_MeetupDora&Cybersecurity.pptxFinTech Belgium
 
The Economic History of the U.S. Lecture 26.pdf
The Economic History of the U.S. Lecture 26.pdfThe Economic History of the U.S. Lecture 26.pdf
The Economic History of the U.S. Lecture 26.pdfGale Pooley
 
20240429 Calibre April 2024 Investor Presentation.pdf
20240429 Calibre April 2024 Investor Presentation.pdf20240429 Calibre April 2024 Investor Presentation.pdf
20240429 Calibre April 2024 Investor Presentation.pdfAdnet Communications
 
Dividend Policy and Dividend Decision Theories.pptx
Dividend Policy and Dividend Decision Theories.pptxDividend Policy and Dividend Decision Theories.pptx
Dividend Policy and Dividend Decision Theories.pptxanshikagoel52
 
06_Joeri Van Speybroek_Dell_MeetupDora&Cybersecurity.pdf
06_Joeri Van Speybroek_Dell_MeetupDora&Cybersecurity.pdf06_Joeri Van Speybroek_Dell_MeetupDora&Cybersecurity.pdf
06_Joeri Van Speybroek_Dell_MeetupDora&Cybersecurity.pdfFinTech Belgium
 
High Class Call Girls Nagpur Grishma Call 7001035870 Meet With Nagpur Escorts
High Class Call Girls Nagpur Grishma Call 7001035870 Meet With Nagpur EscortsHigh Class Call Girls Nagpur Grishma Call 7001035870 Meet With Nagpur Escorts
High Class Call Girls Nagpur Grishma Call 7001035870 Meet With Nagpur Escortsranjana rawat
 
CALL ON ➥8923113531 🔝Call Girls Gomti Nagar Lucknow best sexual service
CALL ON ➥8923113531 🔝Call Girls Gomti Nagar Lucknow best sexual serviceCALL ON ➥8923113531 🔝Call Girls Gomti Nagar Lucknow best sexual service
CALL ON ➥8923113531 🔝Call Girls Gomti Nagar Lucknow best sexual serviceanilsa9823
 
High Class Call Girls Nashik Maya 7001305949 Independent Escort Service Nashik
High Class Call Girls Nashik Maya 7001305949 Independent Escort Service NashikHigh Class Call Girls Nashik Maya 7001305949 Independent Escort Service Nashik
High Class Call Girls Nashik Maya 7001305949 Independent Escort Service NashikCall Girls in Nagpur High Profile
 
WhatsApp 📞 Call : 9892124323 ✅Call Girls In Chembur ( Mumbai ) secure service
WhatsApp 📞 Call : 9892124323  ✅Call Girls In Chembur ( Mumbai ) secure serviceWhatsApp 📞 Call : 9892124323  ✅Call Girls In Chembur ( Mumbai ) secure service
WhatsApp 📞 Call : 9892124323 ✅Call Girls In Chembur ( Mumbai ) secure servicePooja Nehwal
 
00_Main ppt_MeetupDORA&CyberSecurity.pptx
00_Main ppt_MeetupDORA&CyberSecurity.pptx00_Main ppt_MeetupDORA&CyberSecurity.pptx
00_Main ppt_MeetupDORA&CyberSecurity.pptxFinTech Belgium
 
The Economic History of the U.S. Lecture 19.pdf
The Economic History of the U.S. Lecture 19.pdfThe Economic History of the U.S. Lecture 19.pdf
The Economic History of the U.S. Lecture 19.pdfGale Pooley
 
TEST BANK For Corporate Finance, 13th Edition By Stephen Ross, Randolph Weste...
TEST BANK For Corporate Finance, 13th Edition By Stephen Ross, Randolph Weste...TEST BANK For Corporate Finance, 13th Edition By Stephen Ross, Randolph Weste...
TEST BANK For Corporate Finance, 13th Edition By Stephen Ross, Randolph Weste...ssifa0344
 
Instant Issue Debit Cards - School Designs
Instant Issue Debit Cards - School DesignsInstant Issue Debit Cards - School Designs
Instant Issue Debit Cards - School Designsegoetzinger
 
03_Emmanuel Ndiaye_Degroof Petercam.pptx
03_Emmanuel Ndiaye_Degroof Petercam.pptx03_Emmanuel Ndiaye_Degroof Petercam.pptx
03_Emmanuel Ndiaye_Degroof Petercam.pptxFinTech Belgium
 
Call Girls Koregaon Park Call Me 7737669865 Budget Friendly No Advance Booking
Call Girls Koregaon Park Call Me 7737669865 Budget Friendly No Advance BookingCall Girls Koregaon Park Call Me 7737669865 Budget Friendly No Advance Booking
Call Girls Koregaon Park Call Me 7737669865 Budget Friendly No Advance Bookingroncy bisnoi
 
02_Fabio Colombo_Accenture_MeetupDora&Cybersecurity.pptx
02_Fabio Colombo_Accenture_MeetupDora&Cybersecurity.pptx02_Fabio Colombo_Accenture_MeetupDora&Cybersecurity.pptx
02_Fabio Colombo_Accenture_MeetupDora&Cybersecurity.pptxFinTech Belgium
 
The Economic History of the U.S. Lecture 23.pdf
The Economic History of the U.S. Lecture 23.pdfThe Economic History of the U.S. Lecture 23.pdf
The Economic History of the U.S. Lecture 23.pdfGale Pooley
 
Solution Manual for Financial Accounting, 11th Edition by Robert Libby, Patri...
Solution Manual for Financial Accounting, 11th Edition by Robert Libby, Patri...Solution Manual for Financial Accounting, 11th Edition by Robert Libby, Patri...
Solution Manual for Financial Accounting, 11th Edition by Robert Libby, Patri...ssifa0344
 

Recently uploaded (20)

05_Annelore Lenoir_Docbyte_MeetupDora&Cybersecurity.pptx
05_Annelore Lenoir_Docbyte_MeetupDora&Cybersecurity.pptx05_Annelore Lenoir_Docbyte_MeetupDora&Cybersecurity.pptx
05_Annelore Lenoir_Docbyte_MeetupDora&Cybersecurity.pptx
 
The Economic History of the U.S. Lecture 26.pdf
The Economic History of the U.S. Lecture 26.pdfThe Economic History of the U.S. Lecture 26.pdf
The Economic History of the U.S. Lecture 26.pdf
 
(INDIRA) Call Girl Mumbai Call Now 8250077686 Mumbai Escorts 24x7
(INDIRA) Call Girl Mumbai Call Now 8250077686 Mumbai Escorts 24x7(INDIRA) Call Girl Mumbai Call Now 8250077686 Mumbai Escorts 24x7
(INDIRA) Call Girl Mumbai Call Now 8250077686 Mumbai Escorts 24x7
 
20240429 Calibre April 2024 Investor Presentation.pdf
20240429 Calibre April 2024 Investor Presentation.pdf20240429 Calibre April 2024 Investor Presentation.pdf
20240429 Calibre April 2024 Investor Presentation.pdf
 
Dividend Policy and Dividend Decision Theories.pptx
Dividend Policy and Dividend Decision Theories.pptxDividend Policy and Dividend Decision Theories.pptx
Dividend Policy and Dividend Decision Theories.pptx
 
06_Joeri Van Speybroek_Dell_MeetupDora&Cybersecurity.pdf
06_Joeri Van Speybroek_Dell_MeetupDora&Cybersecurity.pdf06_Joeri Van Speybroek_Dell_MeetupDora&Cybersecurity.pdf
06_Joeri Van Speybroek_Dell_MeetupDora&Cybersecurity.pdf
 
High Class Call Girls Nagpur Grishma Call 7001035870 Meet With Nagpur Escorts
High Class Call Girls Nagpur Grishma Call 7001035870 Meet With Nagpur EscortsHigh Class Call Girls Nagpur Grishma Call 7001035870 Meet With Nagpur Escorts
High Class Call Girls Nagpur Grishma Call 7001035870 Meet With Nagpur Escorts
 
CALL ON ➥8923113531 🔝Call Girls Gomti Nagar Lucknow best sexual service
CALL ON ➥8923113531 🔝Call Girls Gomti Nagar Lucknow best sexual serviceCALL ON ➥8923113531 🔝Call Girls Gomti Nagar Lucknow best sexual service
CALL ON ➥8923113531 🔝Call Girls Gomti Nagar Lucknow best sexual service
 
High Class Call Girls Nashik Maya 7001305949 Independent Escort Service Nashik
High Class Call Girls Nashik Maya 7001305949 Independent Escort Service NashikHigh Class Call Girls Nashik Maya 7001305949 Independent Escort Service Nashik
High Class Call Girls Nashik Maya 7001305949 Independent Escort Service Nashik
 
WhatsApp 📞 Call : 9892124323 ✅Call Girls In Chembur ( Mumbai ) secure service
WhatsApp 📞 Call : 9892124323  ✅Call Girls In Chembur ( Mumbai ) secure serviceWhatsApp 📞 Call : 9892124323  ✅Call Girls In Chembur ( Mumbai ) secure service
WhatsApp 📞 Call : 9892124323 ✅Call Girls In Chembur ( Mumbai ) secure service
 
00_Main ppt_MeetupDORA&CyberSecurity.pptx
00_Main ppt_MeetupDORA&CyberSecurity.pptx00_Main ppt_MeetupDORA&CyberSecurity.pptx
00_Main ppt_MeetupDORA&CyberSecurity.pptx
 
The Economic History of the U.S. Lecture 19.pdf
The Economic History of the U.S. Lecture 19.pdfThe Economic History of the U.S. Lecture 19.pdf
The Economic History of the U.S. Lecture 19.pdf
 
TEST BANK For Corporate Finance, 13th Edition By Stephen Ross, Randolph Weste...
TEST BANK For Corporate Finance, 13th Edition By Stephen Ross, Randolph Weste...TEST BANK For Corporate Finance, 13th Edition By Stephen Ross, Randolph Weste...
TEST BANK For Corporate Finance, 13th Edition By Stephen Ross, Randolph Weste...
 
Instant Issue Debit Cards - School Designs
Instant Issue Debit Cards - School DesignsInstant Issue Debit Cards - School Designs
Instant Issue Debit Cards - School Designs
 
Commercial Bank Economic Capsule - April 2024
Commercial Bank Economic Capsule - April 2024Commercial Bank Economic Capsule - April 2024
Commercial Bank Economic Capsule - April 2024
 
03_Emmanuel Ndiaye_Degroof Petercam.pptx
03_Emmanuel Ndiaye_Degroof Petercam.pptx03_Emmanuel Ndiaye_Degroof Petercam.pptx
03_Emmanuel Ndiaye_Degroof Petercam.pptx
 
Call Girls Koregaon Park Call Me 7737669865 Budget Friendly No Advance Booking
Call Girls Koregaon Park Call Me 7737669865 Budget Friendly No Advance BookingCall Girls Koregaon Park Call Me 7737669865 Budget Friendly No Advance Booking
Call Girls Koregaon Park Call Me 7737669865 Budget Friendly No Advance Booking
 
02_Fabio Colombo_Accenture_MeetupDora&Cybersecurity.pptx
02_Fabio Colombo_Accenture_MeetupDora&Cybersecurity.pptx02_Fabio Colombo_Accenture_MeetupDora&Cybersecurity.pptx
02_Fabio Colombo_Accenture_MeetupDora&Cybersecurity.pptx
 
The Economic History of the U.S. Lecture 23.pdf
The Economic History of the U.S. Lecture 23.pdfThe Economic History of the U.S. Lecture 23.pdf
The Economic History of the U.S. Lecture 23.pdf
 
Solution Manual for Financial Accounting, 11th Edition by Robert Libby, Patri...
Solution Manual for Financial Accounting, 11th Edition by Robert Libby, Patri...Solution Manual for Financial Accounting, 11th Edition by Robert Libby, Patri...
Solution Manual for Financial Accounting, 11th Edition by Robert Libby, Patri...
 

Agf market outlook

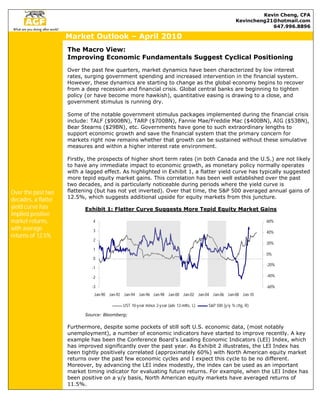
  • 1. Kevin Cheng, CFA Kevincheng21@hotmail.com 647.996.8896 Market Outlook – April 2010 Over the past two decades, a flatter yield curve has implied positive market returns, with average returns of 12.5% The Macro View: Improving Economic Fundamentals Suggest Cyclical Positioning Over the past few quarters, market dynamics have been characterized by low interest rates, surging government spending and increased intervention in the financial system. However, these dynamics are starting to change as the global economy begins to recover from a deep recession and financial crisis. Global central banks are beginning to tighten policy (or have become more hawkish), quantitative easing is drawing to a close, and government stimulus is running dry. Some of the notable government stimulus packages implemented during the financial crisis include: TALF ($900BN), TARP ($700BN), Fannie Mae/Freddie Mac ($400BN), AIG ($53BN), Bear Stearns ($29BN), etc. Governments have gone to such extraordinary lengths to support economic growth and save the financial system that the primary concern for markets right now remains whether that growth can be sustained without these simulative measures and within a higher interest rate environment. Firstly, the prospects of higher short term rates (in both Canada and the U.S.) are not likely to have any immediate impact to economic growth, as monetary policy normally operates with a lagged effect. As highlighted in Exhibit 1, a flatter yield curve has typically suggested more tepid equity market gains. This correlation has been well established over the past two decades, and is particularly noticeable during periods where the yield curve is flattening (but has not yet inverted). Over that time, the S&P 500 averaged annual gains of 12.5%, which suggests additional upside for equity markets from this juncture. Exhibit 1: Flatter Curve Suggests More Tepid Equity Market Gains -3 -2 -1 0 1 2 3 4 Jan-90 Jan-92 Jan-94 Jan-96 Jan-98 Jan-00 Jan-02 Jan-04 Jan-06 Jan-08 Jan-10 -60% -40% -20% 0% 20% 40% 60% UST 10-year minus 2-year (adv 12-mths, L) S&P 500 (y/y % chg, R) Source: Bloomberg; Furthermore, despite some pockets of still soft U.S. economic data, (most notably unemployment), a number of economic indicators have started to improve recently. A key example has been the Conference Board’s Leading Economic Indicators (LEI) Index, which has improved significantly over the past year. As Exhibit 2 illustrates, the LEI Index has been tightly positively correlated (approximately 60%) with North American equity market returns over the past few economic cycles and I expect this cycle to be no different. Moreover, by advancing the LEI index modestly, the index can be used as an important market timing indicator for evaluating future returns. For example, when the LEI Index has been positive on a y/y basis, North American equity markets have averaged returns of 11.5%.
  • 2. Various leading indicators suggest a constructive backdrop for equities ahead Exhibit 2-LEI Outlook: Constructive For North American Equities -75% -50% -25% 0% 25% 50% 75% Jan-98 Jan-00 Jan-02 Jan-04 Jan-06 Jan-08 Jan-10 -12 -9 -6 -3 0 3 6 9 12 Average (SPX and TSX y/y % chg) Leading Economic Indicators (y/y % chg, adv 6-mths) Source: Bloomberg Another important market indicator for future equity returns is the ISM Services Index. Given that both Canada and U.S. are heavily weighted towards the service sector, the ISM Index provides a good indication of the health and performance of this key component of the North American economy. As Exhibit 3 demonstrates, the ISM Services Index has proven to be an excellent indicator for predicting turns in the market. Exhibit 3-ISM Services Signals Further Equity Market Gains -75% -50% -25% 0% 25% 50% 75% Jan-98 Jan-00 Jan-02 Jan-04 Jan-06 Jan-08 Jan-10 30 35 40 45 50 55 60 65 70 Average (SPX and TSX y/y % chg) ISM Services (advanced 6-mths) Source: Bloomberg Asset Allocation Equities over Bonds Despite the impressive year over year gains achieved so far on the S&P 500 and the TSX, key leading indicators continue to suggest that the current stock market rally is not over just yet. Given that the AGF’s Canadian Balanced Fund is currently benchmarked against the total return index of the S&P TSX (60%) and the DEX Universe Bond Total Return Index (40%), I would suggest a slightly more aggressive tilt to the current asset allocation mix with a 35-30% weighting in bonds and 65% to 70% weighting in equities. From my perspective, the North American economies look to be in the early innings of a slow yet sustainable long-term recovery, similar to the situation in the mid-1990s. During that time frame, annual equity returns averaged approximately 16%, further justifying an overweight in equities. Taking into consideration that the Canadian Balanced fund has a low-to-medium risk profile, the following Exhibit shows my recommended asset allocation weights.
  • 3. Stay the investment course: Cyclicals have worked well over the past few quarters and are likely to outperform in the near-term” Exhibit 4-Asset Allocation Recommendations Top 10 Sector Allocation Recomm. Asset Class Weight (%) Weight (%) Difference Governments 31.4 27.8 -3.6 Materials 18.4 19.9 1.5 Energy 15.4 16.4 1.0 Financials 9.5 11.0 1.5 Telecom Services 5.0 5.5 0.5 Consumer Staples 4.5 3.5 -1.0 Provincials 3.6 2.5 -1.1 Utilities 1.7 1.7 0.0 Industrials 1.1 1.4 0.3 Info. Technology 1.1 2.0 0.9 Total 91.7 91.7 0.0 Regional Mix Weight Weight Recomm. Difference Canada 74.0% 78.0% 4.0% United States 12.7% 14.2% 1.5% Latin America 0.6% 0.6% 0.0% Pacific Rim 0.3% 0.8% 0.5% Cash 12.4% 6.4% -6.0% Source: AGF Website Equity Outlook Equities: Cyclicals over Defensives Following one of the deepest recessions since the Great Depression, the thematic trade of long cyclicals (relative to defensives) has performed very well over the past few quarters. As shown in Exhibit 5, six of the top 10 sectors on a year over year basis are cyclically sensitive. Going forward, I expect these sectors to continue to outperform their defensive counterparts, as global economic prospects continue to improve. Exhibit 5-Cyclicals Outperform Defensives 12-mth % chg Sector Type S&P TSX S&P 500 Average Financials Cyclical 60.4% 80.4% 70.4% Industrials Cyclical 46.7% 68.6% 57.6% Technology Cyclical 40.6% 56.4% 48.5% Consumer Discretionary Cyclical 28.1% 67.1% 47.6% Materials Cyclical 24.2% 53.0% 38.6% Health Care Defensive 38.2% 31.7% 34.9% Energy Cyclical 32.9% 26.7% 29.8% Utilities Defensive 32.2% 15.6% 23.9% Consumer Staples Defensive 13.3% 31.7% 22.5% Telecom Services Defensive 15.2% 5.8% 10.5% Index 38.0% 46.6% 42.3% This thematic trade has worked well on both the S&P TSX and the S&P 500. As demonstrated in Exhibit 6, the sector performance of S&P 500 Industrials relative to Consumer Staples has typically outperformed during upswings in the S&P 500 and underperformed during downswings. Meanwhile, the TSX Energy sector has also outperformed TSX Utilities throughout the various TSX cycles. On balance, the current phase of the equity market rally offers a higher risk and lower reward profile relative to the market profile 6 months ago. However, investors can still expect to see high single-digit to low double digit returns over the next few years as the economy continues to recover. At this stage of the cycle, benchmark outperformance will likely result from asset allocation and sector selection as opposed to security selection.
  • 4. Historic lows in the Fed Funds rate, combined with underlying demand for 10-year Treasuries suggest a Bear Flattener strategy Exhibit 6- Thematic Trade Works In Both North American Markets 40 60 80 100 120 140 160 180 Dec-97 Dec-99 Dec-01 Dec-03 Dec-05 Dec-07 Dec-09 80 100 120 140 160 180 200 220 240 260 280 Industrials / Cons. Staples (R) S&P 500 (1995=100, L) 50 75 100 125 150 175 200 225 Dec-97 Dec-99 Dec-01 Dec-03 Dec-05 Dec-07 50 75 100 125 150 175 200 225 Energy / Utilities (R) S&P TSX (1997 = 100, L) Source: Bloomberg Fixed Income Outlook Bear Flatteners; Corporates over Treasuries Given the current rate environment, short-term interest rates are likely to increase at a faster rate than long-term interest rates and fixed income investors should employ a bear flattener strategy to outperform relative benchmarks. There are two primary drivers behind the bear flattener strategy a) record low fed funds target rate and b) strong underlying demand for long term US$-denominated debt. Firstly, the Fed funds target rate is already at an all-time low with no where to go but up. Since 1971, the Fed Funds rate has averaged 622bps average, and barring another financial crisis, interest rates are likely to rise from their current 25bps level towards their long term-average over the next few years. That should continue to lift rates significantly at the short-end of the curve, suggesting that the portfolio should be underweight short- term bonds in the near term. Exhibit 7: Interest Rates Set To Rise From Historic Lows 0 5 10 15 20 25 Jan-71 Jan-76 Jan-81 Jan-86 Jan-91 Jan-96 Jan-01 Jan-06 Fed Funds Target Rate Long-term Average Source: Bloomberg The second driver in the bear flattener strategy is that foreign demand for US$ denominated debt still remains very strong as demonstrated by last week’s U.S. Treasury 10-year auction. Results in that auction came in at an all time high of 3.72x bid-to-cover, as shown in Exhibit 8. Moreover, indirects were also strong at 43.1% (outpacing Primary Dealers for the first time since September), which suggests that China may have resumed its purchases of U.S. Treasuries. In addition, the ongoing problems within Europe, (most notably Portugal, Ireland, Greece, Spain or the PIGS economies), remain a lingering headwind to European debt markets, thus leaving fixed income investors with few alternatives outside of U.S. Treasuries. Net-net, investors should remain overweight long- term bonds relative to short-term bonds, to outperform the benchmark in the near term.
  • 5. Equities over Bonds, Cyclicals over Defensives, Corporates over Treasuries Exhibit 8: Foreigners Still Willing To Fund U.S. Debt 1.0 1.5 2.0 2.5 3.0 3.5 4.0 Nov-93 Nov-95 Nov-97 Nov-99 Nov-01 Nov-03 Nov-05 Nov-07 Nov-09 UST 10-year auction: bid-to-cover Record High Source: Bloomberg Meanwhile, a healthy corporate sector, strong balance sheets, declining default rates and attractive yields continue to merit an overweight allocation for Corporate bonds within the fixed income portfolio. As shown in Exhibit 7, corporate yield spreads continue to come off their highs (a 630 bps spread), reached during the height of the bear market in Q4 2008, and has further room for improvement. On balance, improving economic fundamentals are likely to help corporate spreads to narrow towards their longer term average of 215bps. Exhibit 9: Corporate Backdrop Supportive Of Narrower Spreads 0 1 2 3 4 5 6 7 Jan-71 Jan-76 Jan-81 Jan-86 Jan-91 Jan-96 Jan-01 Jan-06 Corporate Spreads (BAA - 10yr UST, %) Long-term Average Source: Bloomberg Investment Summary Investors should be properly positioned for a modest economic recovery, which means that despite a rising rate environment stocks should still do well. Within equity markets, investment managers should favor stocks over bonds with a focus on cyclical sectors (ie. Industrials, Info technology, Consumer Discretionary), higher beta names (ie. small cap over large caps) and currencies with a cyclical-tilt (ie. Long CAD, AUD versus USD). On the fixed income side, investors should favour spread product (ie. Corporates, High-Yield), while remaining overweight long term bonds relative to short term bonds, in light of higher interest rates on the horizon. Overall, central banks are likely to err on the side of caution when it comes to raising interest rates, as growth risks continue to outweigh inflation risks, at this point in the cycle.