The latest quarterly strategic report that gives a summary of top market trends impacting major spend categories, and gives actionable insights to drive strategic value for your organization.
« Market Perspectives » est notre revue mensuelle des marchés. Elle présente de la façon la plus synthétique possible :
- notre analyse des principaux faits marquants et indicateurs macro susceptibles de dessiner les marchés sur le mois.
- notre vision sur les différentes classes d’actifs
Cette revue sera continument enrichie avec nos indicateurs quantitatifs.
La plupart de nos analyses sont disponibles sur www.finlightresearch.com
Our monthly publication “Market Perspectives” presents a synthetic view of all the asset classes we cover.
The report is composed of six sections covering Macro, Equities, FI & credit, FX, Commodities and Alternatives.
Each section is preceded by a summary of our views on the related asset class.
Most of our publications are available on our web site www.finlightresearch.com
As we expected, markets in 2014 have been less
influenced by politics and policymakers than in 2013
and more dependent upon growth. Growth is an
essential characteristic of all living things, and in
2014, growth is vital to our outlook for the economy
and markets. Our notes from the field contain
key observations and reaffirm our forecasts. Read the entire report.
The Credit Suisse Research Institute released its sixth annual Global Wealth Report, which focuses on how the middle class has developed since the turn of the century. It finds that the size and wealth of the middle class globally grew quickly before the financial crisis, but growth subsided after 2007 and rising inequality has squeezed its share of wealth in every region. In its analysis, Credit Suisse has taken a new approach to defining the middle class category, using a wealth-based definition – versus an income-based one – that allows for adjustments over time to reflect inflation, and also varies across countries depending on local purchasing power.
- Download the 2015 Global Wealth Report (PDF): http://bit.ly/1VPgIlc
- Order the print version of the 2015 Global Wealth Report: http://bit.ly/1K6hMVJ
Visit the Credit Suisse Research Institute website: http://bit.ly/18Cxa0p
Through all the market traumas of recent years, the crises in Greece, slowdown scares in China, US political gridlock, the collapse in oil prices, the wars and the migrant flows, investors prepared to weather short-term volatility have seen handsome returns on developed-economy equities since the depths of the financial crisis in 2008, with EUR and USD investors seeing only one modestly down year in 2011. There has also been good performance from high yield and investment grade corporate bonds, the laggards (since 2011) being investments connected to commodities and emerging markets.
Our analysis, set out in this Outlook, suggests that 2016 may deliver a fairly similar pattern. Temporary traumas could emanate from Federal Reserve tightening, reduced bond liquidity, renewed growth scares in China or geopolitics, but behind these is an underlying picture of ongoing expansion. The global economy is neither pushed up against capacity limits nor facing severe slack (except for commodities and energy), banking systems are healthy and debt levels seem more amber than red. Rapid growth seems unlikely, given aging populations (bar Africa and India) and sharing economy technologies that do not generate much Gross Domestic Product, but sensibly-priced assets do not need a booming economy to generate reasonable returns. At the time of writing (in late 2015), high yield and investment grade credits have spreads just above their quarter-century averages, giving them scope to weather gradual Fed tightening. Developed equities have valuations somewhat above historic norms on a price-earnings basis, but not on a price-book basis, and operational leverage (especially in the Eurozone) and consolidating oil prices should allow earnings growth to move from last year's negatives into the mid- to high-single digits. In short, we think developed equities and credits are well placed for another year of reasonable returns, with the dollar likely to be strong again as the Fed leads the monetary cycle. As for emerging markets, and the commodities on which many depend, a convincing general recovery looks some time away, but there is scope for some to move ahead of the pack, as discussed in a special article.
Of course there can always be risks that are not visible and Fed tightening has a habit of teasing these out, although usually not within its first year. But, equally, there could be upside surprises, if the USA finally moves toward solutions on taxing repatriated corporate cash and infrastructure spending or, more simply, the signals of rising confidence already visible in US and European consumer surveys translate into faster spending. We trust our readers will find the Investment Outlook 2016 to be of considerable interest for the coming year.
US dollar strengthening once more as focus remains on the data this weekHantec Markets
Are we set for another improvement in the dollar? There continue to be market reactions to the negative surprises, but there now seems to be a different mind-set to positive data surprises and this is showing in a turn around in sentiment on the greenback. Last week there was a sharp pick up in the Home Starts and Building permits which...
Whats Ahead In 2012 - An Investment Perspective (Spring Update)scottmeek
Bob Doll, Chief Equity Strategist for Fundamental Equities with BlackRock, updates his economic and market outlook, comments on his 10 predictions for the year and discusses investment opportunities for the current environment.
« Market Perspectives » est notre revue mensuelle des marchés. Elle présente de la façon la plus synthétique possible :
- notre analyse des principaux faits marquants et indicateurs macro susceptibles de dessiner les marchés sur le mois.
- notre vision sur les différentes classes d’actifs
Cette revue sera continument enrichie avec nos indicateurs quantitatifs.
La plupart de nos analyses sont disponibles sur www.finlightresearch.com
Our monthly publication “Market Perspectives” presents a synthetic view of all the asset classes we cover.
The report is composed of six sections covering Macro, Equities, FI & credit, FX, Commodities and Alternatives.
Each section is preceded by a summary of our views on the related asset class.
Most of our publications are available on our web site www.finlightresearch.com
As we expected, markets in 2014 have been less
influenced by politics and policymakers than in 2013
and more dependent upon growth. Growth is an
essential characteristic of all living things, and in
2014, growth is vital to our outlook for the economy
and markets. Our notes from the field contain
key observations and reaffirm our forecasts. Read the entire report.
The Credit Suisse Research Institute released its sixth annual Global Wealth Report, which focuses on how the middle class has developed since the turn of the century. It finds that the size and wealth of the middle class globally grew quickly before the financial crisis, but growth subsided after 2007 and rising inequality has squeezed its share of wealth in every region. In its analysis, Credit Suisse has taken a new approach to defining the middle class category, using a wealth-based definition – versus an income-based one – that allows for adjustments over time to reflect inflation, and also varies across countries depending on local purchasing power.
- Download the 2015 Global Wealth Report (PDF): http://bit.ly/1VPgIlc
- Order the print version of the 2015 Global Wealth Report: http://bit.ly/1K6hMVJ
Visit the Credit Suisse Research Institute website: http://bit.ly/18Cxa0p
Through all the market traumas of recent years, the crises in Greece, slowdown scares in China, US political gridlock, the collapse in oil prices, the wars and the migrant flows, investors prepared to weather short-term volatility have seen handsome returns on developed-economy equities since the depths of the financial crisis in 2008, with EUR and USD investors seeing only one modestly down year in 2011. There has also been good performance from high yield and investment grade corporate bonds, the laggards (since 2011) being investments connected to commodities and emerging markets.
Our analysis, set out in this Outlook, suggests that 2016 may deliver a fairly similar pattern. Temporary traumas could emanate from Federal Reserve tightening, reduced bond liquidity, renewed growth scares in China or geopolitics, but behind these is an underlying picture of ongoing expansion. The global economy is neither pushed up against capacity limits nor facing severe slack (except for commodities and energy), banking systems are healthy and debt levels seem more amber than red. Rapid growth seems unlikely, given aging populations (bar Africa and India) and sharing economy technologies that do not generate much Gross Domestic Product, but sensibly-priced assets do not need a booming economy to generate reasonable returns. At the time of writing (in late 2015), high yield and investment grade credits have spreads just above their quarter-century averages, giving them scope to weather gradual Fed tightening. Developed equities have valuations somewhat above historic norms on a price-earnings basis, but not on a price-book basis, and operational leverage (especially in the Eurozone) and consolidating oil prices should allow earnings growth to move from last year's negatives into the mid- to high-single digits. In short, we think developed equities and credits are well placed for another year of reasonable returns, with the dollar likely to be strong again as the Fed leads the monetary cycle. As for emerging markets, and the commodities on which many depend, a convincing general recovery looks some time away, but there is scope for some to move ahead of the pack, as discussed in a special article.
Of course there can always be risks that are not visible and Fed tightening has a habit of teasing these out, although usually not within its first year. But, equally, there could be upside surprises, if the USA finally moves toward solutions on taxing repatriated corporate cash and infrastructure spending or, more simply, the signals of rising confidence already visible in US and European consumer surveys translate into faster spending. We trust our readers will find the Investment Outlook 2016 to be of considerable interest for the coming year.
US dollar strengthening once more as focus remains on the data this weekHantec Markets
Are we set for another improvement in the dollar? There continue to be market reactions to the negative surprises, but there now seems to be a different mind-set to positive data surprises and this is showing in a turn around in sentiment on the greenback. Last week there was a sharp pick up in the Home Starts and Building permits which...
Whats Ahead In 2012 - An Investment Perspective (Spring Update)scottmeek
Bob Doll, Chief Equity Strategist for Fundamental Equities with BlackRock, updates his economic and market outlook, comments on his 10 predictions for the year and discusses investment opportunities for the current environment.
« Market Perspectives » est notre revue mensuelle des marchés. Elle présente de la façon la plus synthétique possible :
- notre analyse des principaux faits marquants et indicateurs macro susceptibles de dessiner les marchés sur le mois.
- notre vision sur les différentes classes d’actifs
Cette revue sera continument enrichie avec nos indicateurs quantitatifs.
La plupart de nos analyses sont disponibles sur www.finlightresearch.com
Our monthly publication “Market Perspectives” presents a synthetic view of all the asset classes we cover.
The report is composed of six sections covering Macro, Equities, FI & credit, FX, Commodities and Alternatives.
Each section is preceded by a summary of our views on the related asset class.
Most of our publications are available on our web site www.finlightresearch.com
Artificial intelligence (AI) is everywhere, promising self-driving cars, medical breakthroughs, and new ways of working. But how do you separate hype from reality? How can your company apply AI to solve real business problems?
Here’s what AI learnings your business should keep in mind for 2017.
Study: The Future of VR, AR and Self-Driving CarsLinkedIn
We asked LinkedIn members worldwide about their levels of interest in the latest wave of technology: whether they’re using wearables, and whether they intend to buy self-driving cars and VR headsets as they become available. We asked them too about their attitudes to technology and to the growing role of Artificial Intelligence (AI) in the devices that they use. The answers were fascinating – and in many cases, surprising.
This SlideShare explores the full results of this study, including detailed market-by-market breakdowns of intention levels for each technology – and how attitudes change with age, location and seniority level. If you’re marketing a tech brand – or planning to use VR and wearables to reach a professional audience – then these are insights you won’t want to miss.
Elevation Wealth Management's quarterly review of the investment, financial, and economic landscape as of September 30, 2013. Key take-aways and useful insights for average and sophisticated investors alike.
The latest quarterly strategic report that gives a summary of top market trends impacting major spend categories, and gives actionable insights to drive strategic value for your organization.
The Deloitte M&A Index is a forward-looking indicator that forecasts future global M&A deal volumes and identifies the factors influencing conditions for dealmaking.
The Deloitte M&A Index is a forward-looking indicator that forecasts future global M&A deal volumes and identifies the factors influencing conditions for dealmaking.
Triggers to watch out for:
1. Our Equity Outlook
2. Market Cap Valuations
3. Our SIP Recommendations
4. Our Fixed Income Outlook
5. Investment Philosophy
Have a detailed insight into a monthly equity and fixed income market outlook.
Read the full document to know more.
Capital Markets Industry Insights - Q1 2016Duff & Phelps
Prospective middle-market issuers are being greeted with robust demand from both traditional private credit investors and crossover public market participants. While monetary policy concerns weighed heavily on market participants for much of the first quarter, the Fed’s more dovish posture of recent weeks has triggered an increase in risk appetite across the credit markets.
Are the good times here to stay or are we hearing the Sirens’ call? Since 2008, investors have been on an odyssey. Gradually, stock markets have managed to recover from the disastrous carnage precipitated by the financial crisis of 2007 and 2008. It has been an uneven path back to current market levels as there have been many occasions when it appeared that the fragile recovery would be stymied by bickering politicians, slowing emerging economies, deflationary pressures, regulatory zeal, civil unrest in the Middle East, over spent consumers, etc
Capital Markets Insights: Credit Availability for the Middle Market Remains R...Duff & Phelps
Recent trimming in first lien debt appetite resulted in a higher proportion of second lien and junior debt in capital structures. The fuller covenant packages typical of the private market, combined with unabated growth in private investor capital formation, have served to differentiate middle market conditions from those of the broader liquid markets. While the weighted average cost of debt for middle market issuers has increased modestly, credit availability — both in terms of leverage multiples and cost — is robust.
THIRD QUARTER 2015 RETROSPECTIVE AND PROSPECTIVE We’ve Seen This Movie BeforeRobert Champion
Global markets remained in turmoil as concerns regarding the global economy persisted. While much of the international focus was centred around the slowing economy in China, there were few places that investors could hide as even cash, paying little to negative interest in some parts of the world, was a relative winner in the quarter.
U.S. equities continued their impressive advance, with
no significant declines during the quarter. In Europe, policy changes may function as an important tailwind for growth and market performance. Globally, M&A activity has been on the rise, giving a boost to equity prices across the market-cap spectrum. The current bull market has been significant — in terms of both length and magnitude.
Similar to The Key 2013 — Deutsche Bank Presenation — Larry Adam (20)
The Evolution of Non-Banking Financial Companies (NBFCs) in India: Challenges...beulahfernandes8
Role in Financial System
NBFCs are critical in bridging the financial inclusion gap.
They provide specialized financial services that cater to segments often neglected by traditional banks.
Economic Impact
NBFCs contribute significantly to India's GDP.
They support sectors like micro, small, and medium enterprises (MSMEs), housing finance, and personal loans.
where can I find a legit pi merchant onlineDOT TECH
Yes. This is very easy what you need is a recommendation from someone who has successfully traded pi coins before with a merchant.
Who is a pi merchant?
A pi merchant is someone who buys pi network coins and resell them to Investors looking forward to hold thousands of pi coins before the open mainnet.
I will leave the telegram contact of my personal pi merchant to trade with
@Pi_vendor_247
how to swap pi coins to foreign currency withdrawable.DOT TECH
As of my last update, Pi is still in the testing phase and is not tradable on any exchanges.
However, Pi Network has announced plans to launch its Testnet and Mainnet in the future, which may include listing Pi on exchanges.
The current method for selling pi coins involves exchanging them with a pi vendor who purchases pi coins for investment reasons.
If you want to sell your pi coins, reach out to a pi vendor and sell them to anyone looking to sell pi coins from any country around the globe.
Below is the contact information for my personal pi vendor.
Telegram: @Pi_vendor_247
USDA Loans in California: A Comprehensive Overview.pptxmarketing367770
USDA Loans in California: A Comprehensive Overview
If you're dreaming of owning a home in California's rural or suburban areas, a USDA loan might be the perfect solution. The U.S. Department of Agriculture (USDA) offers these loans to help low-to-moderate-income individuals and families achieve homeownership.
Key Features of USDA Loans:
Zero Down Payment: USDA loans require no down payment, making homeownership more accessible.
Competitive Interest Rates: These loans often come with lower interest rates compared to conventional loans.
Flexible Credit Requirements: USDA loans have more lenient credit score requirements, helping those with less-than-perfect credit.
Guaranteed Loan Program: The USDA guarantees a portion of the loan, reducing risk for lenders and expanding borrowing options.
Eligibility Criteria:
Location: The property must be located in a USDA-designated rural or suburban area. Many areas in California qualify.
Income Limits: Applicants must meet income guidelines, which vary by region and household size.
Primary Residence: The home must be used as the borrower's primary residence.
Application Process:
Find a USDA-Approved Lender: Not all lenders offer USDA loans, so it's essential to choose one approved by the USDA.
Pre-Qualification: Determine your eligibility and the amount you can borrow.
Property Search: Look for properties in eligible rural or suburban areas.
Loan Application: Submit your application, including financial and personal information.
Processing and Approval: The lender and USDA will review your application. If approved, you can proceed to closing.
USDA loans are an excellent option for those looking to buy a home in California's rural and suburban areas. With no down payment and flexible requirements, these loans make homeownership more attainable for many families. Explore your eligibility today and take the first step toward owning your dream home.
how can i use my minded pi coins I need some funds.DOT TECH
If you are interested in selling your pi coins, i have a verified pi merchant, who buys pi coins and resell them to exchanges looking forward to hold till mainnet launch.
Because the core team has announced that pi network will not be doing any pre-sale. The only way exchanges like huobi, bitmart and hotbit can get pi is by buying from miners.
Now a merchant stands in between these exchanges and the miners. As a link to make transactions smooth. Because right now in the enclosed mainnet you can't sell pi coins your self. You need the help of a merchant,
i will leave the telegram contact of my personal pi merchant below. 👇 I and my friends has traded more than 3000pi coins with him successfully.
@Pi_vendor_247
What website can I sell pi coins securely.DOT TECH
Currently there are no website or exchange that allow buying or selling of pi coins..
But you can still easily sell pi coins, by reselling it to exchanges/crypto whales interested in holding thousands of pi coins before the mainnet launch.
Who is a pi merchant?
A pi merchant is someone who buys pi coins from miners and resell to these crypto whales and holders of pi..
This is because pi network is not doing any pre-sale. The only way exchanges can get pi is by buying from miners and pi merchants stands in between the miners and the exchanges.
How can I sell my pi coins?
Selling pi coins is really easy, but first you need to migrate to mainnet wallet before you can do that. I will leave the telegram contact of my personal pi merchant to trade with.
Tele-gram.
@Pi_vendor_247
Poonawalla Fincorp and IndusInd Bank Introduce New Co-Branded Credit Cardnickysharmasucks
The unveiling of the IndusInd Bank Poonawalla Fincorp eLITE RuPay Platinum Credit Card marks a notable milestone in the Indian financial landscape, showcasing a successful partnership between two leading institutions, Poonawalla Fincorp and IndusInd Bank. This co-branded credit card not only offers users a plethora of benefits but also reflects a commitment to innovation and adaptation. With a focus on providing value-driven and customer-centric solutions, this launch represents more than just a new product—it signifies a step towards redefining the banking experience for millions. Promising convenience, rewards, and a touch of luxury in everyday financial transactions, this collaboration aims to cater to the evolving needs of customers and set new standards in the industry.
The European Unemployment Puzzle: implications from population agingGRAPE
We study the link between the evolving age structure of the working population and unemployment. We build a large new Keynesian OLG model with a realistic age structure, labor market frictions, sticky prices, and aggregate shocks. Once calibrated to the European economy, we quantify the extent to which demographic changes over the last three decades have contributed to the decline of the unemployment rate. Our findings yield important implications for the future evolution of unemployment given the anticipated further aging of the working population in Europe. We also quantify the implications for optimal monetary policy: lowering inflation volatility becomes less costly in terms of GDP and unemployment volatility, which hints that optimal monetary policy may be more hawkish in an aging society. Finally, our results also propose a partial reversal of the European-US unemployment puzzle due to the fact that the share of young workers is expected to remain robust in the US.
how to sell pi coins in all Africa Countries.DOT TECH
Yes. You can sell your pi network for other cryptocurrencies like Bitcoin, usdt , Ethereum and other currencies And this is done easily with the help from a pi merchant.
What is a pi merchant ?
Since pi is not launched yet in any exchange. The only way you can sell right now is through merchants.
A verified Pi merchant is someone who buys pi network coins from miners and resell them to investors looking forward to hold massive quantities of pi coins before mainnet launch in 2026.
I will leave the telegram contact of my personal pi merchant to trade with.
@Pi_vendor_247
Falcon stands out as a top-tier P2P Invoice Discounting platform in India, bridging esteemed blue-chip companies and eager investors. Our goal is to transform the investment landscape in India by establishing a comprehensive destination for borrowers and investors with diverse profiles and needs, all while minimizing risk. What sets Falcon apart is the elimination of intermediaries such as commercial banks and depository institutions, allowing investors to enjoy higher yields.
Introduction to Indian Financial System ()Avanish Goel
The financial system of a country is an important tool for economic development of the country, as it helps in creation of wealth by linking savings with investments.
It facilitates the flow of funds form the households (savers) to business firms (investors) to aid in wealth creation and development of both the parties
Financial Assets: Debit vs Equity Securities.pptxWrito-Finance
financial assets represent claim for future benefit or cash. Financial assets are formed by establishing contracts between participants. These financial assets are used for collection of huge amounts of money for business purposes.
Two major Types: Debt Securities and Equity Securities.
Debt Securities are Also known as fixed-income securities or instruments. The type of assets is formed by establishing contracts between investor and issuer of the asset.
• The first type of Debit securities is BONDS. Bonds are issued by corporations and government (both local and national government).
• The second important type of Debit security is NOTES. Apart from similarities associated with notes and bonds, notes have shorter term maturity.
• The 3rd important type of Debit security is TRESURY BILLS. These securities have short-term ranging from three months, six months, and one year. Issuer of such securities are governments.
• Above discussed debit securities are mostly issued by governments and corporations. CERTIFICATE OF DEPOSITS CDs are issued by Banks and Financial Institutions. Risk factor associated with CDs gets reduced when issued by reputable institutions or Banks.
Following are the risk attached with debt securities: Credit risk, interest rate risk and currency risk
There are no fixed maturity dates in such securities, and asset’s value is determined by company’s performance. There are two major types of equity securities: common stock and preferred stock.
Common Stock: These are simple equity securities and bear no complexities which the preferred stock bears. Holders of such securities or instrument have the voting rights when it comes to select the company’s board of director or the business decisions to be made.
Preferred Stock: Preferred stocks are sometime referred to as hybrid securities, because it contains elements of both debit security and equity security. Preferred stock confers ownership rights to security holder that is why it is equity instrument
<a href="https://www.writofinance.com/equity-securities-features-types-risk/" >Equity securities </a> as a whole is used for capital funding for companies. Companies have multiple expenses to cover. Potential growth of company is required in competitive market. So, these securities are used for capital generation, and then uses it for company’s growth.
Concluding remarks
Both are employed in business. Businesses are often established through debit securities, then what is the need for equity securities. Companies have to cover multiple expenses and expansion of business. They can also use equity instruments for repayment of debits. So, there are multiple uses for securities. As an investor, you need tools for analysis. Investment decisions are made by carefully analyzing the market. For better analysis of the stock market, investors often employ financial analysis of companies.
Currently pi network is not tradable on binance or any other exchange because we are still in the enclosed mainnet.
Right now the only way to sell pi coins is by trading with a verified merchant.
What is a pi merchant?
A pi merchant is someone verified by pi network team and allowed to barter pi coins for goods and services.
Since pi network is not doing any pre-sale The only way exchanges like binance/huobi or crypto whales can get pi is by buying from miners. And a merchant stands in between the exchanges and the miners.
I will leave the telegram contact of my personal pi merchant. I and my friends has traded more than 6000pi coins successfully
Tele-gram
@Pi_vendor_247
If you are looking for a pi coin investor. Then look no further because I have the right one he is a pi vendor (he buy and resell to whales in China). I met him on a crypto conference and ever since I and my friends have sold more than 10k pi coins to him And he bought all and still want more. I will drop his telegram handle below just send him a message.
@Pi_vendor_247
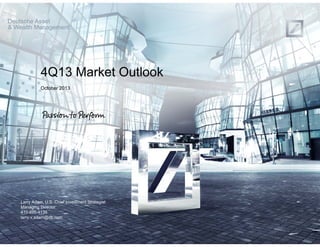
The Key 2013 — Deutsche Bank Presenation — Larry Adam
1. Deutsche Asset
& Wealth Management
4Q13 Market Outlook
k
October 2013
Larry Adam, U.S. Chief Investment Strategist
Managing Director
410-895-4135
larry.v.adam@db.com
2. 4Q13 Economic and Financial Market Outlook
Questions and Key Topics for Discussion
1
The Market Message of 2013, Thus Far
g
,
2
Living in a Fair Market Environment
3
Are the Stars Aligning for an Economic Rebound?
4
QE Means “Quite Easy” Monetary Policy
5
Normalization in Yields to Continue
6
Credit Fair Valued; Looking for Opportunities
7
And the Bull Rally Marches On
8
Selectivity Important in Fair Valued World
9
Will the Dollar Be King?
10
Commodities to Be Challenged
Deutsche Asset
& Wealth Management
Larry Adam, U.S. Chief Investment Strategist
4th Quarter Market Outlook
016437.10.02.13
1
3. The Market Message of 2013, Thus Far
1
What Have the Markets Told Us?
3Q13 Performance by Asset Class/Sector QTD
35%
25%
Commodities:
Broad gains; Agriculture
struggles
Year to Date Total
Return (colors vary)
Fixed income:
Modest gains, long term
Treasuries fall
3Q13 Total Return
(colors vary)
15%
5%
-5%
S&P 500 sectors:
Rotation into select
cyclicals; interest rate
sensitive, telecom, lags.
Growth outperforms value
-15%
-25%
Equities:
All regions except India
positive, Europe rebounds
FX: Dollar Falls;
Euro/GBP rally
EuroStoxx 50
Fr
rance CAC 40
Hang Seng
B
Brazil Bovespa
G
German DAX
Nikkei
S&P 500
FTSE 100
India Nifty 50
S&P/Citi
igroup Growth
S&P/C
Citigroup Value
Materials
Industrials
Cons. Discretionary
Healthcare
Info Tech
Energy
Financials
C
Cons. Staples
Utilities
Telecom
U
U.S. High Yield
Emerging Mark Local Govt
ket
Emerging Market
Europe Credit
Euro Sovereign
ope
U.S. Invst Grade Credit
t
10-Y
Year Treasury
GBP
EUR
JPY
CNY
BRL
Dollar Index
Copper
Gold
Oil
DJ UBS
Corn
-35%
35%
Footnotes: Sorted by 3Q13 returns. Data as of September 30, 2013
Data Source: FactSet, Bloomberg Finance LP.
Deutsche Asset
& Wealth Management
Larry Adam, U.S. Chief Investment Strategist
4th Quarter Market Outlook
016437.10.02.13
2
4. 2
Living in a Fair Market Envir
ronment
Equities and Commodities Approaching Fair Value
S&P 500 P/E Fair Valued
Oil in the Fair Value Zone
24x
$160
$140
$120
Fair Value
16x
12x
C
Crude Oil Price ($/bbl)
20x
$100
Fair Value
$80
$60
$40
$20
$0
65
8x
'04
'05
'06
'07
'08
S&P 500 Trailing P/E
(AVG) S&P 500 Trailing P/E
'09
'10
'11
'12
'13
Recession Periods - United States
— The trailing P/E of the S&P 500 (15.7x LTM) is trading relatively
close to its 10-year average (15.8x LTM).
70
75
80
85
90
95
Global Crude Oil Consumption (million barrels per day)
With 2014 demand expected to rise above 90 million barrels
per day, the fair value of oil appears to be between $ and
$90
$100/barrel.
—
Deutsche Asset
& Wealth Management
The price of oil is highly correlated with demand. As demand
increases, the price of oil increases.
—
Data Source: FactSet.
—
With oil consumption increasing, demand appears to be more
inelastic.
Footnotes: Time period reflects 1Q91 to 2Q13.
Data Source: U.S. Energy Information Agency, FactSet.
Larry Adam, U.S. Chief Investment Strategist
4th Quarter Market Outlook
016437.10.02.13
3
5. Living in a Fair Market Environm
ment
Fixed Income Testing Fair Value
Ten Year Treasury on Normalization Process
High Yield Spreads Below Historical Average
20%
2,500
15%
2,000
10%
1,500
Fair Value
5%
1,000
Fair Value
500
0%
0
-5%
'78 '80 '82 '84 '86 '88 '90 '92 '94 '96 '98 '00 '02 '04 '06 '08 '10 '12
(% 1 YR) Nomi nal GDP - Uni te d Sta te s
US Be nchm ark Bon d - 10 Yea r Yi el d
— The rise in yields since May has resulted in a normalization of
interest rates to a relatively fair value level in relation to GDP.
GDP
Deutsche Asset
& Wealth Management
'00
'01
'02
'03
'04
'05
'06
'07
'08
'09
'10
'11
'12
'13
Barcl ays Ca pital U.S. High Yi eld Spread (to 5 year T reasu ry Yi el d) i n bps
(AVG) Ba rcl ays Capi tal U.S. Hi gh Yiel d Spread (to 5 ye ar T re asury Yi eld ) in bp s
Recessi on Peri od s - Uni ted States
Recessio n Perio ds - Uni ted States
— Historically, the 10 year Treasury yield closely tracks the year
over year change in nominal GDP.
Data Source: FactSet.
'99
— After credit spreads reached record highs in the depths of the
“Great Recession,” spreads have normalized and remain below
their 15 year average.
Data Source: FactSet.
Larry Adam, U.S. Chief Investment Strategist
4th Quarter Market Outlook
016437.10.02.13
4
6. 3
Are the Stars Aligning for an Economic Rebound?
n
Economic Recovery Weak in Historical Context
U.S. Economic Recovery Still Weak in Historical Context
The Root of Economic Disappointment
150
145
140
135
1953-1954
1960-1961
1973-1975
1981-1982
2001
1957-1958
1969-1970
1980
1990-1991
2007-2009
Weaker New
Global Growth
Paradigm
130
125
Fiscal Drag
Disappointing
Corporate
Spending
Challenged
Confidence
120
115
110
105
Current recovery
100
-10
-9
-8
-7
-6
-5
-4
-3
-2
-1
0
1
2
3
4
5
6
7
8
9
10
11
12
13
14
15
16
17
95
Quarters
Q arters Leading Up to and After Recessions
— Even 17 quarters after the end of the “Great Recession,” the U.S.
economic recovery has still been the weakest in a historical
context of all the recessions since the 1950s.
Footnotes: Time period reflects 1950-2013. Zero marks the end of each recession
Data Source: FactSet.
Deutsche Asset
& Wealth Management
Larry Adam, U.S. Chief Investment Strategist
4th Quarter Market Outlook
016437.10.02.13
5
7. Are the Stars Aligning for an Ec
conomic Rebound?
The Formula – From Grinding for Growth to Procuring Economic Pr
rosperity
Global
Growth
Acceleration
+
Business
Spending
=
Deutsche Asset
& Wealth Management
+
Consu
umer:
Positiv Net
ve
Wealth Effect
h
+
Improving
Labor Market
+
Ease of
Fiscal Drag
+2.5-3
3.5%
U.S. GDP Growth
P
Larry Adam, U.S. Chief Investment Strategist
4th Quarter Market Outlook
016437.10.02.13
6
8. Are the Stars Aligning for an Ec
conomic Rebound?
Signs that Global Economic Rebound is Ahead
U.S. Economic Growth Expected to Accelerate
3.5%
Fiscal Drag on U.S. Growth Expected to Ease in 2014
Estimates
3.0%
2.5%
2.0%
1.5%
1.0%
0.5%
%
0.0%
1Q13
2Q13
3Q13
4Q13
1Q14
2Q14
3Q14
4Q14
U.S. GDP Estimate
— Economic growth should accelerate in 2H13 and 2014, based
on an increase in business spending, exports and productivity.
In addition, the waning impact from the fiscal drag should
p
further complement the resilient consumer demand.
Footnotes: Estimates as of October 18, 2013.
Data Source: DEAWM, Bloomberg Finance LP.
Deutsche Asset
& Wealth Management
— In terms of the fiscal drag on growth, DB Global Markets
estimates that after peaking this year, the impact on GDP from
austerity measures will fall by 1.6% in 2014 (from 2.3% to 0.7%)
and decline further in 2015.
Data Source: Deutsche Bank Global Markets
Larry Adam, U.S. Chief Investment Strategist
4th Quarter Market Outlook
016437.10.02.13
7
9. Are the Stars Aligning for an Ec
conomic Rebound?
Acceleration in Global Growth Leads to Pickup in Exports
European Growth to Pick up in 2H13 and 2014
Exports Turning Slightly Positive
2.0%
50%
estimate
1.5%
40%
1.0%
30%
0.5%
20%
0.0%
10%
0%
-0.5%
-10%
-1.0%
-20%
-1.5%
1.5%
-30%
-2.0%
-40%
Jan-07
-2.5%
Dec-07
Nov-08
Oct-09
Sep-10
Aug-11
Jul-12
Jun-13
1Q12 2Q12 3Q12 4Q12 1Q13 2Q13 3Q13 4Q13 1Q14 2Q14 3Q14 4Q14
Euroland GDP (QoQ Ann%)
— Europe has emerged from the longest economic recession on
record.
— While growth may modestly slow from 2Q13 in the coming
q
quarters, we expect g
,
p
growth to accelerate in 2014.
U.S. Exports to EM
U.S. Exports to EU
U.S. Exports to Japan
— In fact, we have started to see signs of a recovery in export
activity to some of our largest trading partners within the
developed economies and the emerging markets.
— This should help to boost U.S. economic growth through
increased export activity.
Footnotes: Estimates as of September 2013.
Data Source: Deutsche Bank Global Markets
Deutsche Asset
& Wealth Management
Footnotes: EM sums Brazil, Mexico, China, Russia, India, Korea, Taiwan.
Data Source: Bloomberg Finance LP. As of July 2013.
Larry Adam, U.S. Chief Investment Strategist
4th Quarter Market Outlook
016437.10.02.13
8
10. Are the Stars Aligning for an Ec
conomic Rebound?
Acceleration of Capex Spending
Business Outlook for Capex Improving
S&P 500 Spending on Capital Expenditures
80
40
30
70
20
60
+71%
+55%
10
50
+84%
0
40
-10
30
20
-20
-30
Aug-00
Oct-02
Dec-04
Feb-07
Apr-09
Jun-11
Aug-13
20
Dec-90
Capex Spending Outlook Richmond Fed & Philadelphia Fed (Avg)
— Capex spending has been slow to materialize in the economic
recovery but is a foundation of our economic outlook.
— There has been signs of optimism as the capex spending
g
y
g
g
outlook in some of the regional surveys is reaching its highest
level since 2000.
Oct-93
Aug-96
Jun-99
Apr-02
Feb-05
Dec-07
Oct-10
Aug-13
S&P 500 Capital Expenditures
— If you use history as a guide, companies in the S&P 500 tend to
increase capex spending by 78%, on average, in a business
recovery.
— However, companies in the current cycle have only increased
,
p
y
y
capex spending by 55%.
— This illustrates how underinvested companies remain after the
“Great Recession.”
Data Source: Bloomberg Finance LP
Deutsche Asset
& Wealth Management
Footnotes: Data is an Index and uses the trailing 12 months capex spending.
Data Source: Bloomberg Finance LP
Larry Adam, U.S. Chief Investment Strategist
4th Quarter Market Outlook
016437.10.02.13
9
11. Are the Stars Aligning for an Ec
conomic Rebound?
Near Term Risk More About Confidence Than Structural Decelera
ation
Limited Damage from Federal Government Furloughs
Ultimate Impact Dependent Upon Confidence Turnaround
90
Largest decline in over two years
85
80
75
70
65
60
55
50
2008
2009
2010
2011
2012
2013
U. of Mich. Consumer Sentiment - 3-Month Moving Average
— Despite ~800K government workers furloughed at the start of
the shutdown (~25% of federal employees), 350K were
reclassified as “essential” employees so that they could return
to work and the deal made by Congress is set to pay
furloughed workers retroactively.
Data Source: Deutsche Bank Global Markets.
Deutsche Asset
& Wealth Management
— Consumer confidence was hampered by the government
impasse with the three month moving average of consumer
sentiment falling at the fastest pace in more than two years in
October.
— New deadlines from the deal will be in focus but hopefully
confidence will be restored. In the absence of a fiscal policy
“shock” we expect the combination of lower gas prices, falling
mortgage rates, rising equity prices and the end of the
shutdown should bolster sentiment.
.
Data Source: FactSet.
Larry Adam, U.S. Chief Investment Strategist
4th Quarter Market Outlook
016437.10.02.13
10
12. 4
QE Means “Quite Easy” Mon
netary Policy
“Easy” Policy Globally
Global Balance Sheets
Rates to Remain Accommodative
$4,500
60%
Only 50% chance of rate hike by Jan 2015
$4,000
50%
$3,500
in billion
ns
$3,000
40%
$2,500
30%
$2,000
$1,500
20%
$1,000
10%
$500
$0
Aug-00
Oct-02
Dec-04
Fed Balance Sheet
Feb-07
Apr-09
Jun-11
Aug-13
0%
Oct-13 Dec-13 Jan-14 Mar-14 Apr-14 Jun-14 Jul-14 Sep-14 Oct-14 Dec-14 Jan-15
Bank of Japan Balance Sheet (in USD)
Probability of Rate Hike (as of August 20, 2013)
ECB Balance Sheet (in USD)
Probability of Rate Hike (as of Sept 27, 2013)
— Despite the talk of “taper,” the Fed is still expected to increase its
balance sheet over the next 6-12 months, just at a slower pace.
— Within the U.S., even if the Fed begins the gradual removal of
QE, interest rates should remain low until 2015, at the earliest.
— In fact, the probability of a rate hike in January 2015 has fallen
from 51% to 46% in a month
month.
Data Source: Bloomberg Finance LP.
Deutsche Asset
& Wealth Management
Data Source: Bloomberg Finance LP.
Larry Adam, U.S. Chief Investment Strategist
4th Quarter Market Outlook
016437.10.02.13
11
13. QE Means “Quite Easy” Monetary Policy
QE Tapering Postponement
“Mixed” Employment Perspectives
Mixed
10.0%
Potential Timing for Tapering
Weak payroll gains remain a
concern for the Fed
9.5%
250
225
FOMC
Oct 29-30
200
9.0%
Taper?
Comment
Fed not more comfortable now than in Sep
175
150
8.5%
Dec 17-18
?
Jan 28-29
?
125
8.0%
100
75
7.5%
7% remains one threshold we believe needs
to be reached before the Fed “tapers” QE
p
7.0%
6.5%
Sep-2010
Mar-2011
Sep-2011
Mar-2012
Sep-2012
Mar-2013
50
25
0
Sep-2013
Mar 18-19
Unemployment Rate (% LHS)
Nonfarm Payroll Change 6-Month Moving Average (thousands, RHS)
Possible, but “burden of proof” for data
high, e.g.,
high e g payrolls above +200k
Chances of real long-term fiscal resolution
by December have risen
Possible; data will be stronger, political
uncertainty likely reduced
Last meeting under Bernanke
Fed publishes new forecasts, Chair holds
press conference – making it easy to
Market
explain / justify taper
pricing*
—
Labor market improvements remain in focus for the Fed as they
assess future policy. While the unemployment rate fell (to 7.2%)
to its lowest level since November 2008 in September, underlying
trends continue to reflect a tepid environment.
—
Janet Yellen will likely take a similar “dovish” stance as Bernanke
did with the focus on the labor market as a gauge for future QE.
Labor participation remains at the lowest level since 1978 and the
total number of people employed is still below pre-crisis levels.
—
In addition to the six-month moving average of payroll gains
six month
declining in recent months, uncertainty surrounding the actual
impacts from the government shutdown will be closely watched.
—
In terms of taper timing, the odds of a December announcement
p
g,
are falling given the Fed’s data dependent approach. If monthly
payroll gains can move back above 200K and a long-term fiscal
resolution is achieved by lawmakers, December remains in play.
—
With the March meeting including new Fed forecasts and Yellen’s
first press conference, it could be an opportunity to be more
transparent in explaining th path and j tifi ti of t
t
ti
l i i the th d justification f tapering.
i
Data Source: FactSet
Deutsche Asset
& Wealth Management
Data Source: Deutsche Bank Global Markets
Larry Adam, U.S. Chief Investment Strategist
4th Quarter Market Outlook
016437.10.02.13
12
14. QE Means “Quite Easy” Moneta Policy
ary
Taking a “Taper” Breather…For Now
Fed Economic Checklist
More Room to Go
Improvement
Checklist
Confidence
Employment
Prices
Pi
Economy
Government
Factor
Level to Look for
Last Time Level
Reached
Current Level
Level May 2013
x
x
Consumer Confidence
>90
October 2007
80
74
Small Business Optimism
>100
October 2006
94
94
x
x
Nonfarm Payrolls (6 Mo
>210K
April 2006
160K
203K
Unemployment Rate
<7.0%
November 2008
7.3%
7.6%
x
x
Housing Prices (S&P Case
>165
December 2008
162
152
1693
1669
x
x
Moving Average)
Shiller Index)
(initial "taper" talk)
Equity Prices (S&P 500)
1585
Inflation (PCE Deflator)
2.0%
February 2012
1.4%
1.1%
GDP
>2.3% (
(YoY) (sustain for
two/three co
onsecutive quarters)
2010
1.6% (2Q13)
1.3% (1Q13)
Interest Rates (10YR)
<3.1%
July 2011
2.62%
1.93%
Budget and Debt Ceiling
Agreement Between Both
Parties
December 2012
No Budget/Debt
Ceiling at Risk
Footnotes: Treasury yields and S&P 500 level for May is as of May 21, 2013. All other data as of O
October 2, 2013.
Data Source: FactSet.
Deutsche Asset
& Wealth Management
Larry Adam, U.S. Chief Investment Strategist
4th Quarter Market Outlook
016437.10.02.13
13
15. QE Means “Quite Easy” Monetary Policy
Fed Becoming More Hawkish?
Fed Composition 2013
Fed Composition 2014
2014 FOMC Voting Members
2013 FOMC Voting Members
Member Name
Ben S. Bernanke
FOMC Member Role
Chairman - Board of Governors
1
Member Name
FOMC Member Role
Rating
Janet Yellen (Favorite)
Chairman - Board of Governors
1
Vice Chair of FOMC - New York
1
Rating
William C D dl
Willi
C. Dudley
Vice Chair f
Vi Ch i of FOMC - N Y k
New York
1
William C Dudley
C.
Janet Yellen
Vice Chair Board of Governors
1
TBD
Vice Chair Board of Governors
Charles L. Evans*
Chicago Fed President
1
TBD*
Cleveland Fed President
Eric S. Rosengren*
Boston Fed President
1
TBD
Board of Governors
Elizabeth A. Duke
Board of Governors
2
TBD
Board of Governors
Sarah Bloom R ki
S h Bl
Raskin
Board f Governors
B d of G
2
Daniel K. Tarullo
D i l K T ll
Board f G
B d of Governors
2
Daniel K. Tarullo
Board of Governors
2
Jeremy C. Stein
Board of Governors
2
Jeremy C. Stein
Board of Governors
2
Jerome H. Powell
?
Board of Governors
3
Minneapolis Fed President
3
Jerome H. Powell
Board of Governors
3
Narayana Kocherlakota*
James Bullard*
St. Louis Fed President
3
Richard Fisher*
Dallas Fed President
4
Kansas Cit F d President
K
City Fed P
id t
4
Charles Pl
Ch l Plosser*
*
Philadelphia F d P
Phil d l hi Fed President
id t
5
Esther L G
E th L. George*
*
Average "Dove-Hawk" Rating (Dove =1, Hawk = 5)
1.9
Average "Dove-Hawk" Rating (Dove =1, Hawk = 5)
2.6
— Janet Yellen remains the favorite to replace Ben Bernanke in 2014. H
However, a new Vice Chairman will need to be appointed and with Fed
Governor Duke having stepped down at the end of August, Fed Gov
vernor Raskin set to be deputy Treasury secretary and Sandra Pianalto
resigning,
resigning the unfilled spots are likely to cause some uncertainty regarding majority views in the year ahead.
ahead
— In terms of the four regional Fed Presidents, the “dovish” Evans and Rosengren will be rotating out along with the more neutral Bullard and
e
“hawkish” George. In their place, Kocherlakota (leans “hawk”) will be joined by two of the Fed’s most “hawkish” members (Fisher and Plosser).
— Using the “dove-hawk” scale (1 = dove, 5 = hawk), the average of the known (assuming Yellen is Chairman) members saw a much more
“hawkish” tilt (2.6) relative to 2013 (1.9). Obama will need to determine if a more balanced or “hawkish” Fed is appropriate.
Footnotes:*Represents a regional Fed President that is a voting member for one year. Ranked based on the “Dove-Hawk” scale (Dove = 1, Hawk = 5).
Data Source: FRB, Bloomberg Finance LP, Wall Street Journal, DB U.S. Investment Strategy Group, DB Global Markets
Deutsche Asset
& Wealth Management
Larry Adam, U.S. Chief Investment Strategist
4th Quarter Market Outlook
016437.10.02.13
14
16. 5
Normalization in Yields to Continue
Acceleration in Growth Supports High Yields
Economic Outlook Still Points to Higher Yields
16.0%
Interest Rate Break-Out
Break Out
5.5%
US Benchmark Bond - 10 Year - Yield
5.0%
14.0%
4.5%
12.0%
4.0%
10.0%
3.5%
8.0%
3.0%
2.5%
6.0%
4.0%
DB Year End 2014 Target
~4.0% 10-Year Treasury Yield
End of
3Q13
1.5%
2.0%
0.0%
-4.0%
2.0%
1.0%
'07
-2.0%
0.0%
2.0%
4.0%
6.0%
8.0%
10.0%
12.0%
14.0%
(% 1YR) Nominal GDP (YoY %) - United States
— Using the year over year level of nominal GDP, interest rates
should continue to mover higher over the next 12 months (~4%).
Footnotes: Time period reflects 30 years through 2Q13.
Data Source: FactSet.
Deutsche Asset
& Wealth Management
'08
'09
'10
'11
'12
US Benchmark Bond - 10 Year - Yield
(MOV 50D) US Benchmark Bond - 10 Year - Yield
(MOV 200D) US Benchmark Bond - 10 Year - Yield
'13
— While rates have moved modestly lower with the political risks in
Washington, long term yields have broken through their long
term bull market trend.
Data Source: FactSet.
Larry Adam, U.S. Chief Investment Strategist
4th Quarter Market Outlook
016437.10.02.13
15
17. Normalization in Yields to Continue
Supply/Demand Dynamic Likely To Become More Difficult
Retail Outflows to Continue?
Net Issuance Will Remain Healthy
2013
2014
2015
2016
2017
2018
2019
2020
2021
2022
$450
2023
0.0%
$400
-0.5%
$350
-1.0%
$300
-2.1%
-2.0%
-2.5%
3 2%
-3.2%
-3.0%
-3.5%
-2.3%
-2.4% -2.5%
-2.7%
-3.8%
-3.7%
-4.0%
-2.3% -2.5%
-2.9%
2 9%
-2.9%
-3.2%
-3.1% -3.2%
-3.5%
-3.4% -3.3%
-3.6% -3.8%
-3.8%
-4.5%
-5.0%
-5.5%
bil
llions
-1.5%
$250
$200
$150
$100
$50
-5.3%
$0
Dec 07
Dec-07
U.S. Budget Deficit Projection - September 2013 (% of GDP)
U.S. Budget Deficit Projection - February 2013 (% of GDP)
May 09
May-09
Oct 10
Oct-10
Mar 12
Mar-12
Aug 13
Aug-13
12 Month Rolling Flow into Bond Mutual Funds
Data Source: ICI
Net Unrealized Gains/Losses for Commercial Banks
— Treasuries should continue to face headwinds from supply as the
deficit is
d fi it i expected t get worse from 2015 and b
t d to t
f
d beyond.
d
— In addition, ongoing fund outflows and regulations may present
risks to bond investors.
The 100 bps sell off in interest rates in May-June resulted
in a $40 billion reduction in tier-1 capital and cut tier-1
capital by 0.3%.
Data Source: Congressional Budget Office
Deutsche Asset
& Wealth Management
Data Source: Treasury Borrowing Advisory Committee, Federal Reserve
Larry Adam, U.S. Chief Investment Strategist
4th Quarter Market Outlook
016437.10.02.13
16
18. Normalization in Yields to Continue
Duration Risk Unlikely To Produce Recent Returns
Risk Reward: Don’t Expect Easy Returns Going Forward
Don t
Duration Risk
200
10.0%
180
9.0%
1
10 Year Annalized Re
eturn
10.0
188
High Yield
9.0
160
Emerging Market
8.0
Convertibles
8.0%
S&P 500
140
7.0
99
7.0%
120
6.0
100
5.0
6.0%
5.0%
3.0
36
40
Cash
34
20
1.0%
0.0%
0.0%
4.0
60
3.0%
2.0%
2 0%
71
80
Treasuries
4.0%
1.0
0
2.0%
4.0%
6.0%
8.0%
10.0%
12.0%
14.0%
16.0%
10 Year Standard Deviation
2.0
0.0
High Yield
Emerging
Market Debt
Invt Grade
5YR Treasury 10YR Treasury
Change in Basis Points to Result in Negative Total Return (1YR Time Frame) (LHS)
Duration (RHS)
— Treasuries have offered lower returns over the past 10 years
compared to other higher yield fixed income investments (e.g.
convertibles, emerging market debt and high yield).
— With interest rates expected to rise, investors should focus on
investments that offer lower duration and less interest rate
sensitivity.
years,
— With the rally in credit in recent years selectivity will be important
within “carry” investments.
— For example given the attractive “carry ” the yield on high yield
example,
carry,
debt would need to rise 188 bps in order for an investor to see
negative returns.
— In contrast, investors holding 10 year Treasuries would only need
to see yields rise 34 bps.
Footnotes: Time period reflects trailing 10 years as of September 30, 2013.
Data Source: FactSet
Deutsche Asset
& Wealth Management
Footnotes: Data as of October 2, 2013.
Data Source: FactSet.
Larry Adam, U.S. Chief Investment Strategist
4th Quarter Market Outlook
016437.10.02.13
17
19. Credit Fair Valued; Looking for Opportunity
6
Most Credit Fair Valued
Investment Grade — Fair Valued
700
600
500
High Yield Spreads Below Average
2500
Barclays US Agg Invt Grade Credit Spread
(OAS)
Barclays Capital U.S. High Yield Spread (to 5 year
Treasury Yield) in bps
(AVG) Barclays US Agg Invt Grade Credit
Spread (OAS)
2000
(AVG ex 2008-2009) Barclays US Agg Invt
Grade Credit Spread (OAS)
1500
400
300
(AVG) Barclays Capital U.S. High Yield Spread (to 5
year Treasury Yield) in bps
(AVG ex 2008-2009) Barclays US Agg Invt Grade
Credit Spread (OAS)
1000
200
500
100
0
Oct-93
Aug-96
Jun-99
Apr-02
Feb-05
Dec-07
Oct-10
Aug-13
— Investment grade spreads look fair valued in relation to history.
Even if you strip out the elevated levels seen during the financial
crisis, spreads are close to fair value.
— The historical average spread for investment grade debt (20
years) has been 142 bps while the average spread ex 2008-2009
has been 120 bps
bps.
0
Oct-93
Aug-96
Jun-99
Apr-02
Feb-05
Dec-07
Oct-10
Aug-13
— In addition, high yield spreads look fair valued in relation to
history.
— The historical average spread for high yield debt (20 years) has
been 571 bps while the average spread ex 2008-2009 has been
515 bps.
— Th f
Therefore, spreads at ~480 b h
d
480 bps have li i d room f narrowing.
limited
for
i
— Therefore, spreads at ~140 bps have limited room for narrowing.
Data Source: FactSet
Deutsche Asset
& Wealth Management
Data Source: FactSet
Larry Adam, U.S. Chief Investment Strategist
4th Quarter Market Outlook
016437.10.02.13
18
20. Credit Fair Valued; Looking For Opportunity
r
Convertibles Can Produce Attractive Returns Despite Rising Rates
Credit Performance in Rising Rate Environment
High Yield versus Convertibles in Rising Rate Environment
50%
40%
40%
BofA Merrill Lynch Co
onvertibles
60%
50%
BofA Merrill Lynch Co
onvertibles
60%
30%
R2=
20%
0.73
10%
0%
-10%
-20%
30%
20%
10%
0%
-10%
-20%
-30%
30%
-30%
-40%
-40%
R2= 0.05
-20%
0%
20%
40%
U.S. Barclays High Yield
60%
80%
-40%
-40%
-30%
-20%
-10%
0%
10%
U.S. Barclays High Yield
20%
30%
40%
— Convertibles have significantly outperformed high yield as equities h
have continued to rally and the default environment has remained
low. We believe convertibles continue to present an attractive opport
tunity for several reasons.
— Correlated to Equities: Historically, (10 years) convertibles are highly correlated to the S&P 500 (0.90). Therefore, given our constructive
y
bias towards equities, convertibles may benefit.
— Drastic Spread Narrowing Likely Over: High y
p
g
y
g yield has benefited from low spreads but g g forward we believe the bulk of the spread
m
p
going
p
compression is behind us. Returns going forward are likely to be mo muted than the robust returns over the past 10 years (9% ann).
ore
— Convertibles Outperform in Rising Rate Environment: Historically, du to the strong correlation to equities, convertibles generally
ue
outperform high yield in a period of rising rates and positive economic growth.
Footnotes: Time period reflects August 1994-August 2013 and exclude outliers above 40% for high yield returns
h
Data Source: FactSet.
Deutsche Asset
& Wealth Management
Larry Adam, U.S. Chief Investment Strategist
4th Quarter Market Outlook
016437.10.02.13
19
21. And the Bull Rally Marches On…
7
The Current “Bull Market” Rally Remains the Most Robust on Record at Its Current Duration
Despite uncertainty around the potential path of QE “tapering” and f
fiscal policy, U.S. equities have remained resilient and the S&P 500
“bull market” rally that began March 9, 2009 has remained intact.
— Relative to other historical “bull market” rallies, the S&P 500 current ra is now 4.5 years in duration and at its current juncture, it is the second
ally
most robust rally (~+151%) on record.
— At the 4.5 year mark versus other “bull market” rallies that have lasted this long without a 20% correction or greater, the trailing 12-month P/E
d
(15.7x) is above average (13.9x) despite the growth environment (trail
ling 4-quarter average real GDP: +1.6%) being less robust than the
average “bull market” rally (+3.7%).
— The S&P 500 continued higher in September, one of the most season
nally weak months of the year, and is now up ~26% in 2013 on an
annualized basis. Dating back to the S&P 500 Index inception (1930 w the first full year), the S&P 500 is on pace for the 16th strongest
was
annual return on record.
— Of all years, that would put this years S&P 500 rally in the top quartile of annual returns when annualizing year-to-date performance. It would
also be the strongest annual rally since 1998 (+26.7%).
( 26.7%).
S&P 500 Top “Bull Market” Rallies at Current Duration
“Bull Market” Rally Strongest at Current Duration
550
S&P 500 Top Bull Market Rallies
2009
2002
1987
1982
1974
1957
1949
1942
Rallies at Current Duration (4.5 Years)
350
300
Total Rally
Length
(Years)
S&P 500
Cumulative
Gain
S&P 500
Trailing 1212
Month P/E
S&P 500
Dividend
Yield
U.S. Real
GDP Prior 4Quarter
Average
Aug-1982
Aug-1987
5.0
156%
15.8
3.35%
3.0%
Mar-2009
Sep-2013
4.5
151%
15.7
2.01%
1.6%
Oct-2002
Oct-2007
5.0
93%
15.8
1.86%
1.9%
Aug-1956
7.1
84%
9.4
N/A
5.6%
Jul-1998
10.6
74%
18.6
3.15%
2.9%
Oct-1974
400
Maintaining record pace
S&P 500
Peak Date
Dec-1987
450
S&P 500
Trough Date
Jun-1949
500
Nov-1980
6.2
63%
7.9
5.27%
7.1%
Average of Bull Market
Rallies
6.4
104%
13.9
3.13%
3.7%
250
200
150
100
1
2
3
5
6
4
Number of Years
Footnotes: Returns are price only. As of October 2, 2013.
Data Source: FactSet.
Deutsche Asset
& Wealth Management
7
8
9
10
Footnotes: Returns are price only. As of October 2, 2013.
Data Source: FactSet.
Larry Adam, U.S. Chief Investment Strategist
4th Quarter Market Outlook
016437.10.02.13
20
22. And the Bull Rally Marches On…
The Current “Bull Market” Rally Remains the Most Robust on Record at Its Current Duration
Ranking Annual S&P 500 Index Returns – 2013 (Annualized) Top Q
g
(
) p Quartile and Best Since 1998
50%
Top Quartile
Bottom Quartile
40%
30%
20%
10%
0%
2013 = ~26%
(annualized, 16th
Best Year)
-10%
-20%
-30%
-40%
S&P 500 Annual Returns (Price Only)
1931
1937
2008
1974
1930
2002
1941
1973
1940
1932
1957
1966
2001
1929
1946
1962
1977
1969
2000
1981
1953
1990
1934
1939
1960
1994
1948
1970
2011
1947
1978
1984
1987
1956
2005
2007
1992
1993
1968
1959
2004
1965
1949
1971
1952
1979
1988
1942
2010
1964
2012
2006
1944
1986
1982
1972
1951
1983
1963
1976
1943
1999
1967
1996
1950
1961
2009
1938
1980
2013
1991
1985
2003
1955
1998
1989
1936
1945
1997
1975
1995
1958
1935
1954
1933
-50%
Footnotes: Returns are price only since the S&P 500 Index inception and data is as of October 2, 2013.
Data Source: FactSet.
Deutsche Asset
& Wealth Management
Larry Adam, U.S. Chief Investment Strategist
4th Quarter Market Outlook
016437.10.02.13
21
23. And the Bull Rally Marches On…
Broad Equities Fair Valued
S&P 500 Price to Earnings Ratio
S&P 500 P/E Pricing in Expected Economic Environment
24x
17
Average P/E Given
GDP Scenario
16
16.0
16.2
15.2
15
20x
Average P/E
14
16x
12x
13
13.4
13 4
13.1
12.3
12
11
10
9
8x
'04
'05
'06
'07
'08
S&P 500 Trailing P/E
(AVG) S&P 500 Trailing P/E
'09
'10
'11
'12
'13
Recession Periods - United States
8
Less than - -2% to 0%
2%
0% to 2%
2% to 4%
4% - 6%
6% or More
Real GDP (YoY)
(
)
— The trailing P/E of the S&P 500 is trading (15.7x) on the 10 year
average (15.8x).
Data Source: FactSet.
Deutsche Asset
& Wealth Management
— In addition, when using history as a guide, the P/E is likely
reflecting the outlook for growth (2-4%).
Footnotes: Time period reflects 1Q48 – 2Q13.
Data Source: FactSet
Larry Adam, U.S. Chief Investment Strategist
4th Quarter Market Outlook
016437.10.02.13
22
24. And the Bull Rally Marches On…
Earnings Growth Will Need to Support Higher Prices
Earnings Growth Slowing but Expected to Accelerate
Earnings Troughing and Reaccelerating
60.0%
14%
estimates
Year-over-Year Grow (%)
wth
12%
50.0%
40.0%
10%
2014/4c
2014/3c
2014/2c
2014/1c
-10.0%
2013/4c
0%
2013/3c
0.0%
%
2013/2c
2%
2013/1c
10.0%
2012/4C
4%
2012/3C
20.0%
2012/2C
6%
2012/1C
30.0%
2011/4C
8%
4Q09
— The earnings environment is expected to improve as economic
growth improves.
— While we think some of the estimates may be overly optimistic,
we believe earnings growth of 5-7% in 2014 can support higher
equity prices.
Data Source: FactSet, FirstCall.
Deutsche Asset
& Wealth Management
2Q10
3Q10
4Q10
1Q11
2Q11
3Q11
4Q11
1Q12
2Q12
3Q12
4Q12
Quarterly Earnings Estimate (YoY %)
1Q10
1Q13
2Q13
3Q13
— If you look at the past quarters since the end of the “Great
Recession,” earnings tend to be lowered going into earnings
season and then typically improve throughout earnings season.
Footnotes: Change in earnings estimates from 12 weeks prior to 12 weeks after earnings
season.
Data Source: FactSet
Larry Adam, U.S. Chief Investment Strategist
4th Quarter Market Outlook
016437.10.02.13
23
25. 8
Selectivity Important in a Fa Valued World
air
Searching for Value Within Sectors
Finding Value at Sector Level
2014 Earnings Achievability
30%
Consensus 2014
Earnings Growth Est.
Our Base Case
2014 Earnings
Growth Est.
DifferenceBetween
Consensus and Base
Case
Telecom
11%
3%
-8%
Financials
8%
6%
-2%
Cons. Discret
18%
5%
-13%
Materials
18%
5%
-13%
Cons. Staples
10%
5%
-5%
Industrials
11%
7%
-4%
S&P 500
11%
6%
-5%
Energy
11%
8%
-3%
25%
20%
15%
10%
5%
0%
-5%
Relative to 10 year average (P/E, P/BV, P/S, PEG)
-10%
Cons. Discretionar
ry
Utilitie
es
Cons. Staple
es
Healthcar
re
Material
ls
Industrial
ls
S&P 50
00
Telecom. Service
es
Energ
gy
Financial
ls
Info Tec
ch
-15%
— When looking at the sector level, the majority of sectors are
either trading at a premium to their 10 year average.
Lower negative
revisions
— Info tech, financials and energy are the only sectors trading at a
discount.
di
t
9%
-2%
9%
7%
-2%
Utilities
Deutsche Asset
& Wealth Management
11%
Healthcare
Footnotes: Data as of October 2, 2013.
Data Source: FactSet
Info Tech
4%
3%
-1%
Footnotes: Consensus as of September 2013.
Data Source: FactSet
Larry Adam, U.S. Chief Investment Strategist
4th Quarter Market Outlook
016437.10.02.13
24
26. Selectivity Important in a Fair V
Valued World
Favor Dividend Paying Investments Despite Rise in Interest Rates
Dividend Growth by Sector (Last 10 Years)
Interest Rate Sensitive Investments and Higher Yields
14
25.0%
# of Consecutive Years of Dividend Growth (LHS)
12
280
20.0%
10 YR Dividend Growth Rate (Ann) (RHS)
10
15.0%
8
10.0%
6
5.0%
4
0.0%
2
-5.0%
0
-10.0%
Cons. Discretionar
ry
Financials
Industrials
Materials
Healthcar
re
Telecom
m
Utilitie
es
Cons. Staples
s
Info Tec
ch
Energ
gy
230
180
130
80
Apr-03
Oct-03
Utilities
— We continue to favor dividend paying investments despite the
modest rise in interest rates.
— Energy and info tech have seen the highest dividend growth over
the past 10 years and have seen the highest number of
consecutive years with dividend growth
growth.
Footnotes: Annual growth through December 2012.
Data Source: FactSet.
Deutsche Asset
& Wealth Management
Apr-04
Oct-04
Telecom
Apr-05
Oct-05
REITs
Apr-06
Oct-06
S&P 500
Apr-07
MLPs
— Despite the rise in interest rates, dividend paying investments
can still perform well. As long as the rise in rates is accompanied
by better economic growth some interest rate sensitive
investments should perform well.
— In fact, from the 2003-2007 period of rising rates utilities
fact
2003 2007
rates, utilities,
telecom, REITs and MLPs outperformed the S&P 500.
Footnotes: Rising rate period from 2003-2007.
Data Source: FactSet, Bloomberg Finance LP.
Larry Adam, U.S. Chief Investment Strategist
4th Quarter Market Outlook
016437.10.02.13
25
27. Selectivity Important in a Fair V
Valued World
Searching for Value Within Global Regions
Finding Value at Regional Level
Monetary Policy
Valuations
Earnings
Earnings
Revisions
Technicals
Final Score
Japan
1.00
1.00
-1.00
1.00
1.00
1.00
4.00
Europe
0.75
0 75
0.75
0 75
0.00
0 00
1.00
1 00
-1 00
1.00
1.00
1 00
2.50
2 50
U.S.
1.00
1.00
0.00
1.00
-1.00
0.25
2.25
UK
0.75
0.75
0.00
0.00
-1.00
0.25
0.75
1.00
1 00
0.25
0 25
1.00
1 00
1.00
1 00
-1.00
1 00
1.00
1 00
3.25
3 25
Korea
0.25
0.00
1.00
1.00
-1.00
1.00
2.25
Russia
0.00
0.00
1.00
-1.00
1.00
1.00
2.00
Taiwan
1.00
0.00
0.00
1.00
-1.00
1.00
2.00
2 00
India
0.25
0.75
1.00
0.00
-1.00
0.75
1.75
Indonesia
1.00
1.00
-1.00
1.00
-1.00
0.75
1.75
Brazil
0.25
0.00
-1.00
0.00
-1.00
1.00
-0.75
Mexico
Emerging Econ
nomies
Macro
Fundamentals
China
Developed Ec
conomies
Country by
Ranking
0.00
0.00
-1.00
0.00
-1.00
0.75
-1.25
Footnotes: Valuation model factors attractiveness given levels of change in PMI (Macro Fundame
entals), change in real interest rates (Monetary policy), P/E discount/premium (Valuations),
earnings growth and interest rates (Earnings), three month earnings revisions (Earnings Revisions), 50 and 200 day moving average (Technicals).
Data Source: DEAM U.S. Investment Strategy Group, FactSet, Bloomberg Finance LP.
Deutsche Asset
& Wealth Management
Larry Adam, U.S. Chief Investment Strategist
4th Quarter Market Outlook
016437.10.02.13
26
28. 9
Will the Dollar Be “King”?
A New Cyclical Uptrend for the U.S. Dollar?
Key Factors Impacting the U.S. Dollar Outlook
Historical U.S. Dollar Cycles
150
Long Dated
Cycles
+
Historically, the U.S. dollar has gone through several multi-year cycles and
it appears the most recent downward cycle (9 years) ended in mid-2011
140
130
6 years,
-18%
6 years,
+67%
10 years,
-46%
120
7 years,
+43%
9 years,
-40%
110
Decoupling of
Monetary
Policy
+
The eventual "tapering" of QE by the Fed as the economy improves, as well
as further policy easing by the BOJ, ECB and BOE will likely lead to U.S.
dollar strength
???
100
90
80
Better
Economic
Growth
Prospects
+
Capital / Fund
Flows to U.S.
+
Increased capital inflows into the U.S. serves as a catalyst for the U S
US
U.S.
dollar strengthening
Geopolitical
Risks
+
Political risks in the Eurozone, Japan and the Middle East would increase
the "safe haven" status of the U.S. dollar
Export
Sensitivity
70
U.S. economic growth prospects are superior to other major developed
economies like Japan and the Eurozone
60
1973
1978
1983
1988
1993
1998
2003
2008
2013
Nominal U.S. Trade Weighted Dollar Index
Real U.S. Trade Weighted Dollar Index
—
Strength in the U.S. dollar could hamper export activity and as a result, U.S.
economic growth
Data Source: Deutsche Asset & Wealth Management Investment Strategy Group.
Deutsche Asset
& Wealth Management
— The U S dollar has strengthened YTD and appears to be at an
U.S.
inflection point after trending lower since 2002. We expect an
upward cycle to occur as U.S. growth improves and the U.S.
deficit is reduced from recent fiscal reform.
— Over the last 40 years the U.S. dollar has seen five major
y
,
p
,
g g years in length.
g
cycles, both downward and upward, averaging 8 y
— While a strong dollar may benefit the fiscal health of the
economy and support fund flows, we are monitoring it closely as
U.S. corporate profits may be negatively impacted. Near-term,
dollar gains will likely pose downside risks for commodities and
hedging of foreign equity positions should be considered.
Footnotes: Data as of August 31, 2013.
Data Source: FactSet. As of August 31, 2013.
Larry Adam, U.S. Chief Investment Strategist
4th Quarter Market Outlook
016437.10.02.13
27
29. Will the Dollar Be “King”?
U.S. Dollar Trends Derived from Global Monetary Policy
U.S. Dollar Moves Driven by Monetary Policy?
85
Bernanke
“dovish” in
NABE Speech
Anticipation
leading up to
Sep. 13 QE
announcement
84
83
Global Balance Sheet Expansion
Fed decides not to
“taper” at
September meeting
Japan’s
Abe takes
office
82
81
80
Bernanke outlines
Japan details QE
plans, growth reforms QE “tapering” path
Jun. 18
79
78
Jul-2012
Sep-2012 Nov-2012
Jan-2013 Mar-2013 May-2013
Jul-2013
Government
shutdown
Sep-2013
U.S. Trade-Weighted Dollar Index
—
Source: DB Global Markets.
Over the last year, global monetary policy has become a more
year
significant factor in U.S. dollar moves. Outside of Fed policy, we
have seen the U.S. dollar rally as a result of Japan’s aggressive
QE programs and more recently, the ECB and BOE’s forward
guidance on low rates for the foreseeable future.
—
The magnitude of the Bank of Japan s balance sheet expansion
Japan’s
relative to the Fed’s will continue to support U.S. dollar strength,
specifically against the Yen.
Footnotes: As of October 2, 2013.
Data Source: FactSet.
Deutsche Asset
& Wealth Management
Data Source: Deutsche Bank Global Markets
Larry Adam, U.S. Chief Investment Strategist
4th Quarter Market Outlook
016437.10.02.13
28
30. Will the Dollar Be “King”?
Economic Catalysts for U.S. Dollar Strength
Global GDP Estimates – U.S. Relative Strength
Unemployment Rates – U.S. vs. Eurozone
12.5%
12.0%
11.5%
11.0%
10.5%
10.0%
10 0%
9.5%
9.0%
8.5%
8.0%
7.5%
7.0%
Jul-2010
J l 2010
3.5%
3.0%
2.5%
2.0%
1.5%
1.0%
0.5%
0.0%
-0.5%
-1.0%
2013 est.
U.S. GDP
2014 est.
Japan GDP
Jan-2011
J 2011
Jul-2011
J l 2011
Jan-2012
J 2012
U.S. Unemployment Rate
Jul-2012
J l 2012
Jan-2013
J 2013
Jul-2013
J l 2013
Eurozone Unemployment Rate
Eurozone GDP
Data Source: FactSet.
Inflation – Japan Deflation Persists
—
Superior growth prospects in the U.S. relative to Japan and the
Eurozone are supportive of U.S. dollar strength.
4.0%
4 0%
BoJ Inflation
Target = 2%
3.0%
—
We expect the U.S. to grow by 1.8% in 2013 before accelerating
to a growth level of 3.0% in 2014.
—
The U.S. unemployment rate has trended lower over the last
three years while the Eurozone unemployment rate has trended
higher and is now at a new record high (12.2%).
—
In terms of inflation on a year-ago basis, U.S. price levels
continue to grow while Japan has seen deflation for the last 12
months.
2.0%
1.0%
0.0%
-1.0%
-2.0%
-3.0%
2003
2004
2005
2006
2007
2008
2009
2010
2011
2012
2013
Japan Consumer Price Index (YoY %)
Data Source: FactSet, DB Global Investment Strategy Group.
Deutsche Asset
& Wealth Management
Data Source: FactSet.
Larry Adam, U.S. Chief Investment Strategist
4th Quarter Market Outlook
016437.10.02.13
29
31. Will the Dollar Be “King”?
Long Term Cyclical Dollar Trends Tend to See Short Term Counter Moves
EURUSD: All Long Trends Have Large Countertrend Moves
EURUSD Tied to EU & U.S. 2Yr Rate Differentials
1.38
1.37
5
Euro (lhs)
2y rate diff (bps, rhs)
1.36
1.35
1.34
1.33
1 33
-5
-10
-15
1.32
1.31
1.30
1.29
1.28
1.27
1 27
1.26
Oct-12
0
-20
-25
-30
-35
-40
Dec-12
Feb-13
Apr-13
Jun-13
Aug-13
Data Source: Deutsche Bank Global Markets.
—
All long term cycles for the U.S. dollar, specifically looking at the
p,
EURUSD relationship, have seen several “countertrend” moves
like we have seen with recent dollar weakness.
Foreign Buying of Europe Equities Over U.S. Overdone
-40%
—
—
We see recent Euro strength and dollar weakness as temporary.
The difference between 2-year sovereign yields in the EU and
U.S. have a close correlation to the EURUSD spot rate. We expect
a reversal in the recent upward trend as the Fed begins to “taper”
QE and the Eurozone recovery proves to be slow.
The Euro has also benefitted from a surge in demand for
European equities that has outpaced flows into U.S. markets in
recent months. However, we see the current level of demand as
unsustainable.
Data Source: Deutsche Bank Global Markets
Deutsche Asset
& Wealth Management
-30%
Change i relative valuation of E
Ch
in l ti
l ti
f Euro stocks
t k
vs US (p/e ratios, lhs)
Foreign buying of Euro equities minus US
equities ($bn,rhs)
400
300
200
-20%
100
-10%
0
0%
-100
10%
-200
Euro stocks
-300
becoming
relatively
30%
-400
more expensive
40%
-500
500
00 01 02 03 04 05 06 07 08 09 10 11 12 13
Data Source: Deutsche Bank Global Markets
Larry Adam, U.S. Chief Investment Strategist
4th Quarter Market Outlook
20%
016437.10.02.13
30
32. 10
Commodities to be Challeng
ged
Dollar Largest Challenge to Commodities
Key Factors Impacting Commodity Index
Dollar Challenge to Commodities
0.00
U.S. Dollar
—
Expectations for a multi-year Dollar appreciation.
-0.10
-0.20
Emerging
Market
Economies
/
Emerging market growth slowly recovering but still weak in
historical context.
-0 30
0.30
-0.40
-0.50
Developed
Market
Economies
+
Investment
Demand
—
Retail demand has weakened and institutions are unlikely to
further increase exposure due to disappointing performance
Supply Levels
pp y
—
U.S. crude oil and natural gas oversupply concerns have emerged
due to the U S energy "renaissance"
U.S.
renaissance
—
The modest "tailwind" from negative real interest rates has
dissipated and higher interest rates increase the "cost" of holding
commodities.
Real Interest
Rates
Developed market economies momentum gaining traction.
-0.60
-0.70
Geopolitical
Unrest
/
Geopolitical unrest is subsiding…for now.
W eather
/
-0.80
Energy
Softs
Grains
DJ UBS
Commodity
Index
Precious
Metals
Industrials
Metals
20 YR Correlation to U.S. Dollar
— Given the strong negative correlation between commodities and
the dollar we believe commodities will be challenged by a rise in
the dollar.
— Over the past 20 y
p
years, the commodity sectors most negatively
,
y
g
y
correlated to the dollar are precious metals and industrial metals.
Limited weather disruptions expected in the near term. Looking for
insights into winter weather season.
Footnotes: Time period reflects September 1993-September 2013.
Data Source: FactSet
Deutsche Asset
& Wealth Management
Larry Adam, U.S. Chief Investment Strategist
4th Quarter Market Outlook
016437.10.02.13
31
33. Commodities to be Challenged
Dynamics Driving Energy Prices Changing
Oil
O Less Sensitive to Geopolitical Unrest
S
G
US/EU Iran Sanctions
Arab Spring
$125
Non O C S
OPEC Supply to Expected to Rise
Libya Supply/Syria
Unrest
62.0%
61.5%
$115
61.0%
$105
60.5%
$95
60.0%
$85
59.5%
$75
59.0%
$65
Sep-2009
Sep-2010
Sep-2011
Brent Crude Oil Spot Price ($/bbl)
Sep-2012
Sep-2013
WTI Crude Oil Spot Price ($/bbl)
58.5%
58.0%
2009
2010
2011
2012
2013
2014
Total Non-OPEC Crude Oil Output as a % of Total Non-OPEC and OPEC
Output
—
Crude oil prices are becoming less sensitive to the disruptions
from the Middle East.
—
Part of the reason that Middle East tensions are having less of an
impact is due to the fact that Non Opec oil supply is rising.
—
Looking at the recent Libya supply disruptions and Syria unrest,
the price of crude oil did not spike as seen during past Middle East
conflicts.
conflicts
—
With big producers such as the U.S. and Mexico, Non Opec oil
supply should make up ~62% of total oil supply by 2015.
Data Source: FactSet.
Deutsche Asset
& Wealth Management
Data Source: IEA
Larry Adam, U.S. Chief Investment Strategist
4th Quarter Market Outlook
016437.10.02.13
32
34. Commodities to be Challenged
Gauging Investor Demand – Less Support from Retail and Institutio
onal Investors?
Speculative Retail Investors Flee the Gold Market
DJ-UBS Commodity Index Trailing Returns
85
12%
75
10%
-27%
65
8%
55
6%
45
4%
35
2%
25
Jun-08
0%
Sep-03
Dec-04
Mar-06
Jun-07
Sep-08
Dec-09
Mar-11
Jun-12
Sep-13
Dow Jones UBS Commodity Return (10YR Rolling Annualized)
—
—
Jul-09
Jul-10
Aug-11
Aug-12
Aug-13
Total Known ETF Holdings of Gold
Footnotes: Data as of September 27, 2013.
Data Source: Bloomberg Finance LP.
Institutional Commodities Exposure Levels Out in 2012
After correcting in 2013, the 10-year annualized return of the DJUBS Commodity Index fell to +0.5%.
C
dit I d f ll t 0 5%
9%
Gold is just one example of how investor demand can be “fickle,”
specifically in regards to speculative commodities trading. The
strong correction in gold reminds us that investments that become
inflated due to speculation as opposed to solid fundamentals are
sensitive to sharp corrections.
corrections
7%
8%
8%
2011
2012
8%
7%
6%
6%
6%
5%
4%
4%
4%
3%
3%
3%
—
Institutions have increased exposures to commodities over the
last decade and at current levels, they have little incentive to add
additional exposure given disappointing performance.
2%
2%
1%
0%
2003
Footnotes: Data as of September 27, 2013.
Data Source: FactSet.
Deutsche Asset
& Wealth Management
2004
2005
2006
2007
2008
2009
2010
Commodities - Avg. Institutional Allocation
Data Source: NACUBO-Commonfund Endowment Studies (2003 to 2012), FactSet.
Larry Adam, U.S. Chief Investment Strategist
4th Quarter Market Outlook
016437.10.02.13
33
35. Economic and Asset Class For
recasts
GDP Growth
in %
World
USA
Euroland
UK
Japan
China
2013
2014
3.1%
1.8%
-0.4%
1.2%
1.7%
7.5%
3.7%
3.0%
0.7%
1.8%
1.5%
7.5%
Key Interest Rates
USA (Fed funds)
Euroland (Refi rate)
UK (Repo rate)
( p
)
Japan (Money market rate)
Currencies
Inflation (CPI)
Current*
Year End
Forecast
12-Month
Forecast
0.25%
0.50%
0.50%
0.10%
0.25%
0.50%
0.50%
0.10%
0.25%
0.25%
0.50%
0.10%
Current*
Year End
Forecast
12-Month
Forecast
2013
2014
1.7%
2.5%
EUR/USD
USD/JPY
1.35
98.69
1.31
101.00
1.25
114.00
Euroland
1.6%
1.6%
EUR/CHF
1.23
1.25
1.25
UK
Japan
China
2.4%
0.1%
2.8%
2.2%
1.5%
3.1%
GBP/USD
USD/CNY
1.61
6.12
1.57
6.10
1.52
6.00
2013
2014
Commodities
Current*
Year End
Forecast
12-Month
Forecast
-2.7%
2.5%
-2.9%
-2.6%
2.7%
-2.6%
Oil (WTI) in USD
Gold in USD
103
1336
100
1300
100
1300
in %
USA
Current Account Balance
in % of GDP
USA
Euroland
UK
Japan
1.0%
1.8%
China
2.2%
2.0%
Fiscal Balance
in % of GDP
USA
Euroland
UK
Japan
China
2013
2014
-4.5%
-2.9%
-7.0%
-9.5%
-2.0%
-3.5%
-2.8%
-6.5%
-8.5%
-1.8%
Equities
USA (S&P 500)
Euroland (Euro Stoxx 50)
Germany (DAX)
UK (FTSE 100)
Japan (Nikkei)
Asia ex Japan (MSCI in USD)
Latin America (MSCI in USD)
Sovereign Rates
USA
Euroland (German Bund)
UK
Japan
Current*
1693
2927
8666
6552
14621
543
3387
Current*
2.63%
1.82%
2.57%
0.67%
Dividend Yield
P/E (LTM)**
Year End
Forecast
12-Month
Forecast
2.0%
3.6%
3.1%
3.5%
1.5%
2.4%
2.6%
15.7
13.1
12.4
12.9
19.5
12.7
14.3
1715
2925
8750
6600
14800
570
3550
1810
3185
9410
7000
16000
600
3650
Country CDS
Year End
Forecast
12-Month
Forecast
27.5
24.7
32.2
60.9
3.00%
2.10%
2.90%
0.80%
3.70%
2.30%
3.00%
1.25%
Data Source: FactSet, Bloomberg Finance LP, Deutsche Bank Global Investment Committee foreca
asts as of GIC meeting on September 24, 2013.
* As of September 25, 2013. **LTM stands for last 12 months.
Deutsche Asset
& Wealth Management
Larry Adam, U.S. Chief Investment Strategist
4th Quarter Market Outlook
016437.10.02.13
34