SlideShare a Scribd company logo
1 of 13
Download to read offline
PRICE TARGET REVISION | COMMENT
MAY 8, 2012
First Capital Realty Inc. (TSX: FCR)
In-Line Q1/12; All About Quality, Not Quantity
Outperform
Average Risk
Price: 18.77
Shares O/S (MM): 180.2
Dividend: 0.80
NAVPS: 17.00
BVPS: 14.35
Float (MM): 69.0
Debt to Cap: 50%
Price Target: 20.00 ↑ 18.50
Implied All-In Return: 11%
Market Cap (MM): 3,382
Yield: 4.3%
P/NAVPS: 1.1x
P/BVPS: 1.3x
BVPS above is fully taxed. Pre-tax BVPS is $16.02
Priced at market close on May 8, 2012 ET
Event
First Capital Realty ("FCR") has reported Q1/12 results.
Investment Opinion
• In-line Q1 – Q1/12 FFO/share of $0.25 was +3% from Q1/11’s $0.24 and
fractionally ahead of our $0.24E.
• Organic Growth Set To Improve – Q1/12 “stable” s-p NOI increased 0.1%.
2012 guidance is for 1.0–2.0% growth. Q1/12 renewal leasing spreads on
416,000 sf of GLA were +10% (average net rent of $17.50/sf) while rents on
177,000 sf of gross new leases (including dev’t/redev't space coming on-line)
were 22% higher than those on non-renewals/terminations. Solid leasing
spreads and the ramp-up in re-tenanted former Blockbuster locations give us
confidence in the annual outlook.
• Acquisition Pace Slows/Dispositions Accelerate – Versus $443MM in 2011,
the acquisition pace has slowed, with Q1/12 activity of $45MM. 2012 guidance
is for redev't and IPP investments of $150–200MM. On the other side of the
ledger, YTD sales activity includes three wholly owned assets, a remaining
50% stake in a third, and a 50/50% JV deal on two more, for total proceeds of
~$176MM. The pick-up in sell-side activity puts FCR on track to monetize
$250–300MM of properties this year (former guidance of $250MM).
Management is clearly executing on its strategy to liberate capital from
secondary markets/non-strategic properties. Proceeds are being used to fund
redev’t/dev’t through 2012–2013 and acquire selected properties within major
markets from which it can create more value over time. Given narrowing yield
differentials between primary and secondary markets, we applaud FCR’s
capital discipline and its drive to continually become a better (not just bigger)
company.
• Proposing To Acquire ProMed – On May 4, Gazit-Globe Lt and FCR
announced a preliminary non-binding proposal to acquire Gazit America Inc
(TSX: GAA) for a deemed deal value of $7.07/share ($2.90 cash + 0.222 FCR
shares). FCR plans to acquire ProMed, GAA's medical office business. From
FCR's viewpoint, we like the plan and we believe the strategy to be
complementary and value-enhancing over time. While the offer is at a 34%
premium to GAA's pre-proposal price, virtually every way you cut the
numbers, its at a discount to GAA's current BPVS. Thus, GAA's special
committee has some work to do. See Appendix I herein.
• Price Target Increased To $20 From $18.50; Outperform Reiterated
Priced as of prior trading day's market close, EST (unless otherwise noted).
125 WEEKS 25DEC09 - 08MAY12
12.00
14.00
16.00
18.00
D J F M A M J J A S O N
2010
D J F M A M J J A S O N
2011
D J F M A M
2012
HI-11MAY12 18.86
LO/HI DIFF 77.51%
CLOSE 18.77
LO-07MAY10 10.63
1500
3000
4500
PEAK VOL. 5738.0
VOLUME 362.5
100.00
110.00
120.00
130.00
Rel. S&P/TSX COMPOSITE INDEX HI-11MAY12 139.89
LO/HI DIFF 45.07%
CLOSE 139.89
LO-19FEB10 96.43
RBC Dominion Securities Inc.
Neil Downey, CA, CFA (Analyst)
(416) 842-7835; neil.downey@rbccm.com
Michael Markidis, CFA (Analyst)
(416) 842-7897; michael.markidis@rbccm.com
Kevin Cheng, CFA (Associate)
(416) 842-3803; kevin.cheng@rbccm.com
Shivalika Handa (Associate)
(416) 842-7894; shivalika.handa@rbccm.com
FY Dec 2010A 2011A 2012E 2013E
EPS (Op) - FD 0.26 2.75 1.47 1.37
Prev. 1.32 1.36
P/E 72.2x 6.8x 12.8x 13.7x
FFO (Op) - FD 0.98 0.96 1.01 1.06
P/FFO 19.2x 19.6x 18.6x 17.7x
AFFO - FD 0.86 0.88 0.90 0.97
Prev. 0.92
P/AFFO 21.8x 21.3x 20.9x 19.4x
FFO (Op) - FD Q1 Q2 Q3 Q4
2010 0.24A 0.23A 0.24A 0.27A
2011 0.24A 0.23A 0.24A 0.25A
2012 0.25A 0.25E 0.25E 0.26E
Prev. 0.24E 0.26E
FFO (Op): FFO = Funds From Operations
EPS (Op): All 2010 figures (EPS, FFO and AFFO) are shown in
accordance with Canadian GAAP. 2011 onward in accordance
with IFRS.
All values in CAD unless otherwise noted.
For Required Non-U.S. Analyst and Conflicts Disclosures, see page 10.
2
Q1/12 Results and Recap
An In-line Quarter – Q1/12 FFO/share of $0.25 (rounded) marked a 3% increase from Q1/11’s $0.24 and was fractionally ahead of
our $0.24 estimate. Operating results were in line with our expectations. Lower than expected interest expense was the primary driver
of variance to our forecast.
Occupancy Slips Modestly – Q1/12 occupancy of 95.9% was down 50bps from Q1/11’s 96.4% and 30bps sequentially from Q4/11’s
96.2%. During the first quarter, two locations tenanted by Hart Stores (30,900 sf) and Premier Fitness (21,800 sf) were closed due to
bankruptcy. We note that the latter has subsequently been taken up by GoodLife Fitness.
FCR’s occupancy stats continue to be negatively impacted by the October 2011 bankruptcy of Blockbuster Canada. Firm
commitments from 21 new tenants for 70,000 sf (of the 117,000 sf vacated) have been received, yet only six of these tenants had taken
occupancy by March 31. Over the next two quarters, the Blockbuster failure should prove to be a positive for shareholders, in our
view.
Same-Property NOI Growth Set To Improve – Q1/12 “stable” same-property NOI increased 0.1%. This figure specifically
excludes properties that are relatively stable but are undergoing a façade, parking, or lighting upgrade, or that have expansion pads or
building extensions under way. For the full-year 2012, Management has guided toward “stable” same-property NOI growth in the
range of 1% to 2%.
Exhibit 1: Quarterly Portfolio Occupancy And Same-Property NOI Growth (Q1/04 To Q1/12)
90%
92%
94%
96%
98%
Q1/04 Q3/05 Q1/07 Q3/08 Q1/10 Q3/11
Portfolio Occupancy Long-Term Average
-2%
0%
2%
4%
6%
8%
Q1/04 Q1/06 Q1/08 Q1/10 Q1/12
Same-Property NOI Growth 4Q Moving Avg.
Source: RBC Capital Markets and Company reports
Healthy Leasing Spreads On Renewals – A total of 416,000 sf of space was renewed during Q1/12. The average net rent of
$17.50/sf on this space represented a healthy spread of 9.6% over the expiring rate of $15.96/sf. Gross new leases (which includes
development and redevelopment space coming on-line) aggregated to 177,000 sf. We calculate that these new leases were executed at
net rents of $22.22/sf, or 22.0% higher than the net rents on leases that were not renewed/terminated during the quarter.
Over the next four years (through to the end of 2015), annual lease maturities are relatively consistent, averaging 2.3 million sf (~10%
of total portfolio GLA). With average expiring rents of ~$17/sf being significantly below market rent estimates, this should be a solid
driver behind improved same-property NOI growth over the medium term.
Acquisition Pace Slows; Planning To Acquire ProMed – Compared to 2011 ($443 million), FCR’s acquisition pace has slowed,
with $45 million of acquisitions completed during the first quarter specifically. Q1/12 acquisitions added 59,200 sf of retail space and
3.6 acres of land to FCR’s portfolio. FCR’s outlook for 2012 guides toward expected investment activity of $150–200 million into
redevelopment and income producing property acquisitions.
Property specific details of the Q1/12 activity are highlighted in Exhibit 2 below.
Not contemplated within the investment volume noted above is FCR’s proposal to acquire ProMed from Gazit America Inc. This
conditional offer was announced after the market close on May 4. The 930,000 sf of GLA owned by ProMed has a value in the $215–
225 million range. We see the ownership and management of medical office buildings and related healthcare real estate as a natural
extension/evolution of FCR’s business model, from being solely a shopping centre owner (manager and developer) to one with mixed-
use and other properties. We provide additional details and commentary on this proposed transaction in Appendix 1 on page 5.
First Capital Realty Inc.May 8, 2012
3
Exhibit 2: Q1/12 Acquisition Activity
City Prov. Quarter
Price
($MM) GLA (sf) Acres $/sf
$MM /
Acre
Mount Royal Village (The Devenish)1
Calgary AB Q1 22.1 43,200 n.a. 512 n.a.
Langford Centre (2800 Bryn Maur Road) Langford BC Q1 3.9 16,000 n.a. 244 n.a.
Loblaws Plaza (1450 Merivale Road) Ottawa ON Q1 2.4 n.a. 0.6 n.a. 4.4
Other Toronto ON Q1 2.8 n.a. n.a. n.a. n.a.
5500 Dundas Street Etobicoke ON Q1 6.2 n.a. 2.4 n.a. 2.6
Main & Main Developments Toronto ON Q1 7.4 n.a. 0.6 n.a. 12.3
Total Q1/12 Acquisitions 44.8 59,200 3.6
Notes: 1
Excludes a residential component of ~13,000 sf, which is not included in FCR's total GLA
Source: RBC Capital Markets and Company reports
Development/Redevelopment Activities: The Beat Goes On…This Could Be The Biggest Year Of New Deliveries In FCR’s
History – FCR continues to advance its development/redevelopment initiatives. In this regard, $54.3 million was invested during
Q1/12, resulting in the delivery of 90,000 sf of space. In totality, FCR expects to deliver 600,000–700,000 sf from development,
redevelopment, and expansion to income producing status this year. Having a gross value of $250–300 million, this would make 2012
the most active new development year in the company’s history. We believe yield on cost will be in the 7.0–8.0% range.
Exhibit 3 below summarizes the active development pipeline through to 2013, as it currently stands.
Exhibit 3: Active Development Pipeline – 2012 To 2013
Costs ($MM) GLA (sf)
Incurred Remaining Total Completed Active Total
Same Property With Redevelopment And Expansion 16.9 33.5 50.4 n.a. 86,760 86,760
Major Redevelopment 281.3 58.7 340.0 738,569 361,344 1,099,913
Greenfield Development 262.5 52.0 314.5 781,347 360,081 1,141,428
Total 2012-2013 560.8 144.1 654.5 1,519,916 808,185 2,241,341
Source: RBC Capital Markets and Company reports
Management has noted that in 2013–2014, the company plans to commence approximately six projects, each of which will be
generally quite large. For instance, the large scale mixed-use (retail, office, residential, below grade parking) redevelopment
intensification scheme at Humbertown Shopping Centre would be a multi-year, multi-phase project with a capital budget in excess of
$300 million. We understand that FCR has partnered with Tridel on the proposed mid- to high-rise residential components of this
project.
Capital Recycling Program Gains Traction – FCR has actually increased its guidance for asset dispositions in 2012 from $250
million to $300 million. In Q1/12, two wholly owned properties (Woodgrove Crossing, Nanaimo, BC; and the Woolridge Building,
Coquitlam, BC) and the remaining 50% interest in a third property (Orleans Gardens, Gloucester, ON) were sold for total gross
proceeds of $48 million. This rendered a balance of $250 million of properties that were classified as “held for sale” at Q1/12.
Subsequently, FCR disposed of its 50% interests in two properties, located in Sherwood Park, AB, to an institutional investor and a
100% stake in its 332,000 sf Brantford Commons shopping Centre. Gross proceeds from the three transactions were $128 million.
FCR will continue to manage the joint-ventured Alberta properties (for its own account, and on behalf of its new partner).
FCR is clearly executing upon its strategy to liberate capital from properties that are not considered to be strategic and/or are located
in smaller markets. Proceeds are being used to fund the redevelopment/development pipeline through 2012 and beyond, and to acquire
selected properties within major markets from which FCR believes it will be able to create value over time.
Given robust pricing parameters in the private property market, and, the narrowing of property yields between secondary and primary
markets, we applaud FCR’s capital discipline and its drive to continually become a better (and not just a bigger) company.
Balance Sheet Is In Strong Shape – Q1/12 liquidity of $420 million consisted of $2 million in cash and $418 million of available
credit. On April 4, FCR issued $175 million of Series “N” unsecured debentures (4.5% fixed rate; ~240 bps new issue spread; due
March 2021). We believe a portion of the net proceeds from this offering will be used to retire the $100 million of Series “A”
unsecured debentures (5.08% coupon) maturing in June 2012. Incorporating these transactions, we see pro forma liquidity of roughly
$490 million (see Exhibit 4).
First Capital Realty Inc.May 8, 2012
4
We believe FCR’s solid liquidity position, access to multiple forms of debt capital (property specific mortgages, unsecured debentures
and convertibles), and ongoing property disposition program should provide the company with substantial financial flexibility to fund
its property development and redevelopment initiatives into 2013, without tapping the market for additional equity capital.
Exhibit 4: Pro Forma Liquidity And Debt Maturity Profile ($MM, unless noted)1
Cash 2
Undrawn Lines 488
Liquidity 490
Lines 36
Unsecured Debentures 1,322
Convertible Debentures 356
Mortgages 1,463
Total Debt 3,178
Liquidity as a % of Total Debt 15%
% Unsecured 53%
% Secured 47%
0
300
600
900
1,200
1,500
1,800
Liquidity Lines 2012
Commercial Property Debt Unsecured Debentures Res. & Land Development Debt
0
300
600
900
1,200
1,500
1,800
Liquidity Lines 2012
Commercial Property Debt Unsecured Debentures Res. & Land Development Debt
0
300
600
900
1,200
1,500
1,800
Liquidity Lines 2012
Commercial Property Debt Unsecured Debentures Res. & Land Development Debt
0
300
600
900
1,200
1,500
1,800
Liquidity Lines 2012
Commercial Property Debt Unsecured Debentures Res. & Land Development Debt
0
300
600
900
1,200
1,500
1,800
Liquidity Lines 2012
Commercial Property Debt Unsecured Debentures Res. & Land Development Debt
0
500
1,000
1,500
2,000
Liquidity Lines 2012 2013 2014 2015 2016+
Mortgages Unsecured Debentures Convertible Debentures
Note: 1
Incorporates $175 million Series “N” unsecured debentures (issued April 4) and assumed repayment of $100 million of Series "A" unsecured
debentures due in June 2012
Source: RBC Capital Markets estimates and Company reports
Exhibit 5: Summary NAV And Sensitivity Matrix ($MM, unless noted)
NAV/Unit Sensitivity - Change In Forward 12-Months' NOI
3% 2% 1% 0% -1% -2% -3%
FTM NOI ("Cash Basis") 351 5.25% $22.66 $22.30 $21.94 $21.58 $21.21 $20.85 $20.49
Cap Rate Applied By RBC CM 6.0% 5.50% $20.97 $20.62 $20.28 $19.94 $19.59 $19.25 $18.90
Gross Property Value 5,852 5.75% $19.43 $19.10 $18.77 $18.44 $18.11 $17.78 $17.45
+ Value Of Other Assets 522 6.00% $18.02 $17.70 $17.38 $17.00 $16.75 $16.44 $16.12
= Total Assets 6,373 6.25% $16.72 $16.41 $16.11 $15.81 $15.51 $15.20 $14.90
- Net Debt And Convertible Debt (3,195) 6.50% $15.52 $15.23 $14.93 $14.64 $14.35 $14.06 $13.77
- Non-Controlling Interests (11) 6.75% $14.41 $14.13 $13.85 $13.57 $13.28 $13.00 $12.72
= NAV 3,167
Diluted Shares (MM) 186 Premium/(Discount) To NAV Sensitivity - Change In FTM NOI
NAV/Share $17.00 3% 2% 1% 0% -1% -2% -3%
Share Price $18.77 5.25% -17% -16% -14% -13% -12% -10% -8%
Premium (Discount) To NAV 10% 5.50% -10% -9% -7% -6% -4% -2% -1%
5.75% -3% -2% 0% 2% 4% 6% 8%
LTV 50% 6.00% 4% 6% 8% 10% 12% 14% 16%
LTV - excluding Conv. Debs 44% 6.25% 12% 14% 17% 19% 21% 23% 26%
6.50% 21% 23% 26% 28% 31% 33% 36%
6.75% 30% 33% 36% 38% 41% 44% 48%
CapRateCapRate
Source: RBC Capital Markets estimates and Company reports
FFO/Share Estimates Unchanged; Price Target Increased To $20 (From $18.50) – Our 2012/2013 FFO/share estimates remain
unchanged at $1.01 and $1.06, respectively. We’ve increased our price target to $20 (from $18.50). Our revised price target is derived
via the application of a 21x multiple (was 18.5x) to our 2013 AFFO/unit estimate. Our target multiple continues to represents a
premium to the average which we apply to our Canadian commercial property universe. We believe this is justified in light of the high
quality and defensive characteristics inherent in the portfolio, FCR’s value-added business model, the strength in its capital structure,
and overall franchise value. Based on relative return expectations, we reiterate our Outperform, Average Risk rating.
First Capital Realty Inc.May 8, 2012
5
Appendix I: The Proposal To Acquire ProMed Though A Gazit-America (GAA) Privatization
On May 4, Gazit-Globe Ltd (NYSE:GZT, “Gazit-Globe”,) and First Capital Realty (“FCR”) announced a preliminary non-binding
proposal to acquire Gazit America Inc (TSX: GAA) for deemed value of $7.07 per GAA share. Consideration will be part cash and
part in the form of FCR common shares. Gazit-Globe owns 73.1% of GAA’s outstanding shares. The acquisition proposal is for the
remaining 26.9%.
GAA’s business consists principally of two assets:
i) An interest in 930,000 sf of medical office and related real estate, which had a Q4/11 IFRS fair value of $218 million; and
ii) 14.3 million common shares (representing a 12.5% stake) of Equity One, Inc. (NYSE: EQY), a U.S. shopping centre REIT.
At Q4/11, GAA’s liability profile included $232 million in mortgages, credit facilities and term loans, and $57 million of loans from
affiliates (including US$36 million from FCR). This placed Q4/11 leverage at a comparatively high 60%. Having said this, we note
GAA does not pay a dividend. In our view, a business model with 100% earnings retention is capable of supporting higher gearing
than that of the typical REIT, which pays out the vast majority of its earnings.
Exhibit 6: Gazit America’s Balance Sheet (As At Q4/11 And RBC CM’s Current Estimates) ($MM unless noted)
MTM Est. Current
Q4/11A Adj.1
Fair Value
Investment Properties 218.4 4.1 222.5
Equity One Shares 246.6 52.5 299.1
Other Assets 18.5 18.5
Total Assets 483.4 56.7 540.1
Mortgages, Credit Facilities and Term Loans 232.0 232.0
Loans From Affiliates (includes US$36MM from FCR) 57.4 57.4
Deferred Income Tax Liability 41.6 17.0 58.6
Other Liabilities 7.7 7.7
Total Liabilities 338.7 17.0 355.7
Equity 144.7 39.7 184.4
Total Liabilities And Equity 483.4 56.7 540.1
Total Debt To Gross Assets 60% 54%
Shares (MM) 23.3 23.3
Fully Diluted Shares (MM) 34.8 34.8
Note: 1
Adjustments made by RBC Capital Markets to estimate the current Fair Value balance sheet for GAA. Major assumptions include EQY share
price of US$21.10 and a combined effective tax rate of 30%. Source: RBC Capital Markets estimates and Company reports
Proposed Transaction Mechanics And Timeline – The proposed transaction will see FCR acquire ProMed Properties (CA) Inc., the
legal entity that holds all of the Canadian investment properties. As such, FCR will also assume ProMed’s liabilities. And, to the
extent there are other liabililites within GAA that are related to the direct property portfolio, FCR may also be responsible to
acquire/assume these. Gazit will acquire GAA’s other assets (principally the EQY shares) and liabilities.
Exhibit 7: Gazit America – Simplified Organizational Structure
Gazit America Inc.
(Ontario)
Silver Maple (2001) Inc.
(Nevada)
ProMed Properties (CA) Inc.
(Ontario)
Ficus Inc.
(Delaware)
Equity One, Inc.
(Delaware) (12.5% stake)
The Medical and Health Care Properties
and Redevelopment Assets
Source: RBC Capital Markets and GAA reports
First Capital Realty Inc.May 8, 2012
6
The $7.07 stated preliminary offer price per GAA share consists of the sum of $2.90 in cash and 0.222 FCR shares (at a deemed price
of $18.75) per GAA share. We note that (in general terms) the cash component of the offer will increase or decrease by a factor of
40% of the amount by which the EQY share price exceeds US$21.75 or declines below US$18.75.
A special committee of GAA’s board of directors has been established. This committee has already engaged an advisor to assist in
forming its opinion on the preliminary offer (and presumably, in negotiating any changes). Ultimately, any firm proposal will require
(among other things) approval by the minority shareholders of Gazit America at a special meeting called for this purpose. The joint
press release from GAA, FCR, and Gazit states a targeted deal closing date of July 2012.
A Few Numbers Relevant To GAA Shareholders; Offer Price Appears To Be At A Discount To Current Book Value (Fully
Taxed) – The stated conditional offer price of $7.07 per GAA share represents a substantial 34% premium to the May 4th
(pre-
announcement) trading price of $5.29/share. Versus GAA’s December 31, 2011 BVPS of $6.21, the premium is a lesser 14%.
However, relative to our current estimated BVPS of $7.91, the offer represents an 11% discount. This current BVPS estimate
incorporates the sizable increase in the EQY share price since year-end 2011 (it has rallied by US$4.12, to US$21.10 from US$16.98),
net of an estimated increase the deferred tax liability.
Exhibit 8: Gazit America – BVPS Analysis
MTM Est. Current
Q4/11A Adj. Fair Value
Book Values Per Share:
Basic $6.21 $1.70 $7.91
Pre-Tax Basic $7.99 $2.43 $10.43
Deferred Tax Liability:
Per Share - Basic $1.79 $0.73 $2.52
Note: Diluted and fully diluted amounts per share are in some instances materially lower, based upon dilutive derivative instruments within GAA’s
capital structure. These include 0.9MM share purchase options and outstanding warrants for the purchase of 10.6MM common shares at prices ranging
from $5.63/share to $7.50/share. Diluted and fully diluted BVPS figures are available upon request.
Source: RBC Capital Markets estimates and Company reports
Deferred Income Taxes Complicate The Matter, As They Are Not Usually Taken To Be A “Hard” Liability – GAA’s Q4/11
balance sheet included a deferred tax liability of $41.6 million. Substantially all of this relates to the low tax basis in the EQY shares.
And, with the ~US$4 upward move in EQY’s share price since December 31, we estimate that the deferred tax liability has increased
by ~$17 million since year-end (to ~$59 million). Ignoring the deferred tax liability (an approach that FCR itself employs when
presenting certain figures, such as its implied cap rate) would yield a December 31, 2011 pre-tax BVPS of $7.99 and a current pre-tax
BVPS estimate of $10.43. On this basis, the $7.07 offer price equates to a 12% discount to the December 31st
value and a 32%
discount to the current estimated value. Our book value calculations suggest the special committee has some work to do.
Often, the stated value of a deferred tax liability is not taken as a “hard” number in merger and acquisition analysis. Hence, coming to
terms with the “economic value” or “present value” of GAA’s deferred tax liability will be one major component of the special
committee’s role. And, we believe this will probably be one of the committee’s hard negotiating points. We also believe there will be
a myriad of other considerations, both quantitative and qualitative, that relate to the merits of the non-binding offer.
Profiling The ProMed Portfolio – The ProMed property portfolio encompasses ~930,000 sf and includes 12 medical office and retail
properties with a 50% interest in a 13th
property jointly owned with FCR. Many of the properties are located near or adjacent to
existing FCR properties. They are geographically dispersed across seven major markets: Calgary, Edmonton, the Greater Toronto
Area, London, Kitchener-Waterloo, Ottawa, and the Greater Montreal area. Exhibit 11 on page 8 lists each ProMed property and any
adjacent or nearby FCR property.
Recent disclosures by GAA suggest 2012 NOI should be ~$14.6 million. Hence, the December 31, 2011 property valuation of ~$218
million would imply a going-in cap rate of ~6.7%.
A Good, Complementary Fit With FCR, In Our View – FCR’s business focuses on five core strategies to drive long-term returns
for investors:
i) proactive asset management and value creation;
ii) the acquisition of older urban centers for repositioning and redevelopment;
iii) the acquisition of adjacent properties / sites;
iv) densification of properties – retail, office, residential; and
v) improving the cost of debt and equity.
First Capital Realty Inc.May 8, 2012
7
We see the ownership and management of medical office buildings and related healthcare real estate as a natural extension/evolution
of FCR’s business model, from being solely a shopping centre owner (manager and developer) to one with mixed-use and other
properties. We believe the ProMed portfolio is complementary to FCR’s existing business and that it fits the five strategic criteria on a
number of fronts. For instance, nine of the properties are located within close proximity to existing FCR properties (with 12 properties
located near a major hospital). FCR Management has noted that four ProMed properties offer redevelopment and intensification
opportunities (including the two highlighted below in Exhibit 9). Moreover, we believe ProMed’s overall cost of capital is likely to be
reduced if it operates as a wholly owned, yet independently run, operating division within FCR, as opposed to a standalone public
company.
In keeping with the FCR image and corporate logo, the ProMed business will be re-branded “First Medical” subsequent to the closing
of the proposed transaction.
Exhibit 9: ProMed Properties That Offer Redevelopment Opportunities
Meadowlark Health & Shopping Centre, Edmonton, AB Coronation Medical Centre, Cambridge, ON
Source: RBC Capital Markets and Company reports
Assuming FCR acquires ProMed, the business will represent approximately 3.9% of FCR’s total GLA of ~24 million sf and
approximately 3.6% of its property portfolio, which will have a value in excess of $6 billion.
Exhibit 10: Pro-Forma Gross Leasable Area and Portfolio IFRS Value1
GLA (MM, sf)
23
0.93
ProMed FCR
IFRS Value ($MMf)
218
5,912
ProMed FCR
Notes: 1
IFRS Values as of December 31, 2011
Source: RBC Capital Markets and Company reports
First Capital Realty Inc.May 8, 2012
8
Exhibit 11: The ProMed Property Portfolio
GAA Acquisition Adjacent or Nearby
Property City Province Sq Ft Retail? Floors Cost ($M) FCR Property Adjacent Hospital
Meadowlark Health & Shopping Centre* Edmonton Alberta 153,000 Y 1 $42.4 50-50 JV with FCR
Kingsway Mews Edmonton Alberta 42,000 Y 1 $9.6
Sunpark Plaza Calgary Alberta 125,000 Y 3 $34.6 South Community Health Centre
Westminster Medical Centre* London Ontario 113,000 Y 1 $14.1 Wellington Corners London Health Sciences Centre,
Parkwood Hospital
London Medical Centre London Ontario 49,000 N 4
Wellington Corners London Health Sciences Centre,
Parkwood Hospital
Coronation Medical Centre* Cambridge Ontario 68,000 N 1-2 Delta Centre Cambridge Memorial Hospital
Belmont Professional Centre Kitchener Ontario 47,000 Y 4 $9.9 Grand River Hospital
71 King Street Mississauga Ontario 49,000 Y 5 $10.2 Trillium Health Centre
1670 Bayview Avenue Toronto Ontario 40,000 Y 5 $12.5 Leaside Village
Nepean Medical Centre* Ottawa Ontario 49,000 Y 4 $13.4 College Square
Kent Professional Building Ottawa Ontario 42,000 Y 5 $10.7 216 Elgin Street Saint Vincent Hospital
5700 Cote-des-Neiges Montreal Quebec 92,000 Y 6 $25.4 Centre Commercial Van Horne
Place Adoncour Longueuil Quebec 61,000 Y 3 $15.0 Place Roland Therrien Hôpital Pierre-Boucher
Total 930,000 $214.2
*Redevelopment opportunity
Misericordia Community Hospital,
Royal Alexandra Hospital,
Glenrose Rehabilitation Hospital
$16.4
St. Mary's Hospital Centre, Jewish General Hospital
,CHU Sainte-Justine
Sunnybrook Health Sciences Centre,
Holland & Bloorview Kids Rehab Hospital,
Centre for Addiction & Mental Health
Source: RBC Capital Markets estimates and company reports
First Capital Realty Inc.May 8, 2012
9
Valuation
Our $20 price target is derived by applying an 21x multiple to our 2013 AFFO/share estimate. Our target multiple continues to
represent a premium to the group average, which we believe is warranted based on First Capital Realty's stable and improving
operating results, its value-add business model, and the underlying NAV/share. We rate the shares Outperform, Average Risk.
Price Target Impediment
Impediments to the achievement of our price objectives relate primarily to the risks associated with ownership of real property, which
include (but not limited to): competition for tenants; new supply of competing retail space; general and local economic conditions;
interest rate fluctuations; financial strength (credit risk) of tenants; and relative liquidity of real estate assets. As a company
exclusively focused upon the ownership/management of retail properties, any factor negatively impacting consumer spending is a risk
for FCR. Additionally, retail centres rely on anchor-tenants. Although alternative tenancies exist, a property can be impacted by even
the temporary loss of an anchor-tenant.
Company Description
First Capital Realty Inc ("FCR") is a fully integrated Canadian real estate operating company, with a focus on the ownership,
management, acquisition and development of neighbourhood and community shopping centres. Its centres are most commonly
anchored by grocery stores, junior department stores or drug stores. As FCR's tenant base provides consumers with goods and services
essential to everyday life, the Company's properties are of the type that tends to be weekly destinations for most Canadian households.
The company currently owns interests in over 160 properties (including development sites) with approximately 23 million sf of GLA.
First Capital Realty Inc.May 8, 2012
10
Required Disclosures
Non-U.S. Analyst Disclosure
Michael Markidis, Kevin Cheng and Shivalika Handa (i) are not registered/qualified as research analysts with the NYSE and/or
FINRA and (ii) may not be associated persons of the RBC Capital Markets, LLC and therefore may not be subject to FINRA Rule
2711 and NYSE Rule 472 restrictions on communications with a subject company, public appearances and trading securities held by a
research analyst account.
Conflicts Disclosures
The analyst(s) responsible for preparing this research report received compensation that is based upon various factors, including total
revenues of the member companies of RBC Capital Markets and its affiliates, a portion of which are or have been generated by
investment banking activities of the member companies of RBC Capital Markets and its affiliates.
A member company of RBC Capital Markets or one of its affiliates managed or co-managed a public offering of securities for First
Capital Realty Inc. in the past 12 months.
A member company of RBC Capital Markets or one of its affiliates received compensation for investment banking services from First
Capital Realty Inc. in the past 12 months.
RBC Dominion Securities Inc. makes a market in the securities of First Capital Realty Inc. and may act as principal with regard to
sales or purchases of this security.
A member company of RBC Capital Markets or one of its affiliates received compensation for products or services other than
investment banking services from First Capital Realty Inc. during the past 12 months. During this time, a member company of RBC
Capital Markets or one of its affiliates provided non-investment banking securities-related services to First Capital Realty Inc..
A member company of RBC Capital Markets or one of its affiliates received compensation for products or services other than
investment banking services from First Capital Realty Inc. during the past 12 months. During this time, a member company of RBC
Capital Markets or one of its affiliates provided non-securities services to First Capital Realty Inc..
RBC Capital Markets has provided First Capital Realty Inc. with investment banking services in the past 12 months.
RBC Capital Markets has provided First Capital Realty Inc. with non-investment banking securities-related services in the past 12
months.
RBC Capital Markets has provided First Capital Realty Inc. with non-securities services in the past 12 months.
Research personnel, including the analyst or analyst team responsible for this report or recommendation or any individuals directly
involved in the preparation of the report, including their supervisors, hold(s) or exercise(s) investment discretion over a long position
in the common shares of First Capital Realty Inc..
The author is employed by RBC Dominion Securities Inc., a securities broker-dealer with principal offices located in Toronto, Canada.
Explanation of RBC Capital Markets Equity Rating System
An analyst's 'sector' is the universe of companies for which the analyst provides research coverage. Accordingly, the rating assigned to
a particular stock represents solely the analyst's view of how that stock will perform over the next 12 months relative to the analyst's
sector average.
Ratings
Top Pick (TP): Represents analyst's best idea in the sector; expected to provide significant absolute total return over 12 months with a
favorable risk-reward ratio.
Outperform (O): Expected to materially outperform sector average over 12 months.
Sector Perform (SP): Returns expected to be in line with sector average over 12 months.
Underperform (U): Returns expected to be materially below sector average over 12 months.
Risk Qualifiers (any of the following criteria may be present):
Average Risk (Avg): Volatility and risk expected to be comparable to sector; average revenue and earnings predictability; no
significant cash flow/financing concerns over coming 12-24 months; fairly liquid.
Above Average Risk (AA): Volatility and risk expected to be above sector; below average revenue and earnings predictability; may
not be suitable for a significant class of individual equity investors; may have negative cash flow; low market cap or float.
Speculative (Spec): Risk consistent with venture capital; low public float; potential balance sheet concerns; risk of being delisted.
Distribution of Ratings
First Capital Realty Inc.May 8, 2012
11
For the purpose of ratings distributions, regulatory rules require member firms to assign ratings to one of three rating categories - Buy,
Hold/Neutral, or Sell - regardless of a firm's own rating categories. Although RBC Capital Markets' ratings of Top Pick/Outperform,
Sector Perform and Underperform most closely correspond to Buy, Hold/Neutral and Sell, respectively, the meanings are not the same
because our ratings are determined on a relative basis (as described above).
Distribution of Ratings
RBC Capital Markets, Equity Research
Investment Banking
Serv./Past 12 Mos.
Rating Count Percent Count Percent
BUY[TP/O] 773 51.77 231 29.88
HOLD[SP] 654 43.80 156 23.85
SELL[U] 66 4.42 3 4.55
Q1 Q2 Q3 Q1 Q2 Q3 Q1 Q2 Q3 Q1 Q2
6
9
12
15
18
21
2010 2011 2012
11/10/09
SP:12.81
01/13/10
SP:14.38
03/01/10
OP:14.38
08/09/10
OP:15
09/03/10
OP:16.25
03/07/11
OP:16.5
05/16/11
OP:17.5
11/10/11
OP:18.5
Rating and Price Target History for: First Capital Realty Inc. as of 05-07-2012 (in CAD)
Legend:
TP: Top Pick; O: Outperform; SP: Sector Perform; U: Underperform; I: Initiation of Research Coverage; D: Discontinuation of Research Coverage; NR: Not Rated; NA: Not Available;
RL: Recommended List - RL: On: Refers to date a security was placed on a recommended list, while RL Off: Refers to date a security was removed from a recommended list.
Created by BlueMatrix
References to a Recommended List in the recommendation history chart may include one or more recommended lists or model
portfolios maintained by a business unit of the Wealth Management Division of RBC Capital Markets, LLC. These Recommended
Lists include a former list called the Prime Opportunity List (RL 3), the Guided Portfolio: Prime Income (RL 6), the Guided Portfolio:
Large Cap (RL 7), Guided Portfolio: Dividend Growth (RL 8), the Guided Portfolio: Midcap 111 (RL9), and the Guided Portfolio:
ADR (RL 10). The abbreviation 'RL On' means the date a security was placed on a Recommended List. The abbreviation 'RL Off'
means the date a security was removed from a Recommended List.
Conflicts Policy
RBC Capital Markets Policy for Managing Conflicts of Interest in Relation to Investment Research is available from us on request. To
access our current policy, clients should refer to
https://www.rbccm.com/global/file-414164.pdf
or send a request to RBC CM Research Publishing, P.O. Box 50, 200 Bay Street, Royal Bank Plaza, 29th Floor, South Tower,
Toronto, Ontario M5J 2W7. We reserve the right to amend or supplement this policy at any time.
Dissemination of Research and Short-Term Trade Ideas
RBC Capital Markets endeavors to make all reasonable efforts to provide research simultaneously to all eligible clients, having regard
to local time zones in overseas jurisdictions. RBC Capital Markets' research is posted to our proprietary websites to ensure eligible
clients receive coverage initiations and changes in ratings, targets and opinions in a timely manner. Additional distribution may be
done by the sales personnel via email, fax or regular mail. Clients may also receive our research via third-party vendors. Please contact
your investment advisor or institutional salesperson for more information regarding RBC Capital Markets' research. RBC Capital
Markets also provides eligible clients with access to SPARC on its proprietary INSIGHT website. SPARC contains market color and
commentary, and may also contain Short-Term Trade Ideas regarding the securities of subject companies discussed in this or other
First Capital Realty Inc.May 8, 2012
12
research reports. SPARC may be accessed via the following hyperlink: https://www.rbcinsight.com. A Short-Term Trade Idea reflects
the research analyst's directional view regarding the price of the security of a subject company in the coming days or weeks, based on
market and trading events. A Short-Term Trade Idea may differ from the price targets and/or recommendations in our published
research reports reflecting the research analyst's views of the longer-term (one year) prospects of the subject company, as a result of
the differing time horizons, methodologies and/or other factors. Thus, it is possible that the security of a subject company that is
considered a long-term 'Sector Perform' or even an 'Underperform' might be a short-term buying opportunity as a result of temporary
selling pressure in the market; conversely, the security of a subject company that is rated a long-term 'Outperform' could be considered
susceptible to a short-term downward price correction. Short-Term Trade Ideas are not ratings, nor are they part of any ratings system,
and RBC Capital Markets generally does not intend, nor undertakes any obligation, to maintain or update Short-Term Trade Ideas.
Short-Term Trade Ideas discussed in SPARC may not be suitable for all investors and have not been tailored to individual investor
circumstances and objectives, and investors should make their own independent decisions regarding any Short-Term Trade Ideas
discussed therein.
Analyst Certification
All of the views expressed in this report accurately reflect the personal views of the responsible analyst(s) about any and all of the
subject securities or issuers. No part of the compensation of the responsible analyst(s) named herein is, or will be, directly or
indirectly, related to the specific recommendations or views expressed by the responsible analyst(s) in this report.
Disclaimer
RBC Capital Markets is the business name used by certain branches and subsidiaries of the Royal Bank of Canada, including RBC Dominion Securities Inc., RBC
Capital Markets, LLC, RBC Europe Limited, RBC Capital Markets (Hong Kong) Limited, Royal Bank of Canada, Hong Kong Branch and Royal Bank of Canada,
Sydney Branch. The information contained in this report has been compiled by RBC Capital Markets from sources believed to be reliable, but no representation or
warranty, express or implied, is made by Royal Bank of Canada, RBC Capital Markets, its affiliates or any other person as to its accuracy, completeness or correctness.
All opinions and estimates contained in this report constitute RBC Capital Markets' judgement as of the date of this report, are subject to change without notice and are
provided in good faith but without legal responsibility. Nothing in this report constitutes legal, accounting or tax advice or individually tailored investment advice. This
material is prepared for general circulation to clients and has been prepared without regard to the individual financial circumstances and objectives of persons who
receive it. The investments or services contained in this report may not be suitable for you and it is recommended that you consult an independent investment advisor if
you are in doubt about the suitability of such investments or services. This report is not an offer to sell or a solicitation of an offer to buy any securities. Past
performance is not a guide to future performance, future returns are not guaranteed, and a loss of original capital may occur. RBC Capital Markets research analyst
compensation is based in part on the overall profitability of RBC Capital Markets, which includes profits attributable to investment banking revenues. Every province in
Canada, state in the U.S., and most countries throughout the world have their own laws regulating the types of securities and other investment products which may be
offered to their residents, as well as the process for doing so. As a result, the securities discussed in this report may not be eligible for sale in some jurisdictions. This
report is not, and under no circumstances should be construed as, a solicitation to act as securities broker or dealer in any jurisdiction by any person or company that is
not legally permitted to carry on the business of a securities broker or dealer in that jurisdiction. To the full extent permitted by law neither RBC Capital Markets nor
any of its affiliates, nor any other person, accepts any liability whatsoever for any direct or consequential loss arising from any use of this report or the information
contained herein. No matter contained in this document may be reproduced or copied by any means without the prior consent of RBC Capital Markets.
Additional information is available on request.
To U.S. Residents:
This publication has been approved by RBC Capital Markets, LLC (member FINRA, NYSE, SIPC), which is a U.S. registered broker-dealer and which accepts
responsibility for this report and its dissemination in the United States. Any U.S. recipient of this report that is not a registered broker-dealer or a bank acting in a broker
or dealer capacity and that wishes further information regarding, or to effect any transaction in, any of the securities discussed in this report, should contact and place
orders with RBC Capital Markets, LLC.
To Canadian Residents:
This publication has been approved by RBC Dominion Securities Inc.(member IIROC). Any Canadian recipient of this report that is not a Designated Institution in
Ontario, an Accredited Investor in British Columbia or Alberta or a Sophisticated Purchaser in Quebec (or similar permitted purchaser in any other province) and that
wishes further information regarding, or to effect any transaction in, any of the securities discussed in this report should contact and place orders with RBC Dominion
Securities Inc., which, without in any way limiting the foregoing, accepts responsibility for this report and its dissemination in Canada.
To U.K. Residents:
This publication has been approved by RBC Europe Limited ('RBCEL') which is authorized and regulated by Financial Services Authority ('FSA'), in connection with
its distribution in the United Kingdom. This material is not for general distribution in the United Kingdom to retail clients, as defined under the rules of the FSA.
However, targeted distribution may be made to selected retail clients of RBC and its affiliates. RBCEL accepts responsibility for this report and its dissemination in the
United Kingdom.
To Persons Receiving This Advice in Australia:
This material has been distributed in Australia by Royal Bank of Canada - Sydney Branch (ABN 86 076 940 880, AFSL No. 246521). This material has been prepared
for general circulation and does not take into account the objectives, financial situation or needs of any recipient. Accordingly, any recipient should, before acting on
this material, consider the appropriateness of this material having regard to their objectives, financial situation and needs. If this material relates to the acquisition or
possible acquisition of a particular financial product, a recipient in Australia should obtain any relevant disclosure document prepared in respect of that product and
consider that document before making any decision about whether to acquire the product.
To Hong Kong Residents:
This publication is distributed in Hong Kong by RBC Investment Services (Asia) Limited, RBC Investment Management (Asia) Limited and RBC Capital Markets
(Hong Kong) Limited, licensed corporations under the Securities and Futures Ordinance or, by the Royal Bank of Canada, Hong Kong Branch, a registered institution
under the Securities and Futures Ordinance. This material has been prepared for general circulation and does not take into account the objectives, financial situation, or
needs of any recipient. Hong Kong persons wishing to obtain further information on any of the securities mentioned in this publication should contact RBC Investment
Services (Asia) Limited, RBC Investment Management (Asia) Limited, RBC Capital Markets (Hong Kong) Limited or Royal Bank of Canada, Hong Kong Branch at
17/Floor, Cheung Kong Center, 2 Queen's Road Central, Hong Kong (telephone number is 2848-1388).
To Singapore Residents:
This publication is distributed in Singapore by the Royal Bank of Canada, Singapore Branch and Royal Bank of Canada (Asia) Limited, registered entities granted
offshore bank and merchant bank status by the Monetary Authority of Singapore, respectively. This material has been prepared for general circulation and does not take
into account the objectives, financial situation, or needs of any recipient. You are advised to seek independent advice from a financial adviser before purchasing any
First Capital Realty Inc.May 8, 2012
13
product. If you do not obtain independent advice, you should consider whether the product is suitable for you. Past performance is not indicative of future performance.
If you have any questions related to this publication, please contact the Royal Bank of Canada, Singapore Branch or Royal Bank of Canada (Asia) Limited.
To Japanese Residents:
Unless otherwise exempted by Japanese law, this publication is distributed in Japan by or through RBC Capital Markets (Japan) Ltd., a registered type one financial
instruments firm and/or Royal Bank of Canada, Tokyo Branch, a licensed foreign bank.
.® Registered trademark of Royal Bank of Canada. RBC Capital Markets is a trademark of Royal Bank of Canada. Used under license.
Copyright © RBC Capital Markets, LLC 2012 - Member SIPC
Copyright © RBC Dominion Securities Inc. 2012 - Member CIPF
Copyright © RBC Europe Limited 2012
Copyright © Royal Bank of Canada 2012
All rights reserved
First Capital Realty Inc.May 8, 2012

More Related Content

What's hot

ratio analysis cipla ltd
ratio analysis cipla ltdratio analysis cipla ltd
ratio analysis cipla ltdste1fire
 
4863682 financial-analysis-on-annual-report-on-two-company
4863682 financial-analysis-on-annual-report-on-two-company4863682 financial-analysis-on-annual-report-on-two-company
4863682 financial-analysis-on-annual-report-on-two-companycapechore
 
2007 Q4 TRW Auto Earnings Presentation
2007 Q4 TRW Auto Earnings Presentation 2007 Q4 TRW Auto Earnings Presentation
2007 Q4 TRW Auto Earnings Presentation finance18
 
FIN 571 FINAL EXAM - FIN 571 FINAL EXAM Questions and Answers | Transwebetutors
FIN 571 FINAL EXAM - FIN 571 FINAL EXAM Questions and Answers | TranswebetutorsFIN 571 FINAL EXAM - FIN 571 FINAL EXAM Questions and Answers | Transwebetutors
FIN 571 FINAL EXAM - FIN 571 FINAL EXAM Questions and Answers | TranswebetutorsTransweb E Tutors
 
Aegon: simplification and growth
Aegon: simplification and growthAegon: simplification and growth
Aegon: simplification and growthAegon
 
Moelis Company - Q3 Investor Presentation
Moelis Company - Q3 Investor PresentationMoelis Company - Q3 Investor Presentation
Moelis Company - Q3 Investor PresentationMoelis_Company
 
20180620 sauc oppenheimer consumer conference widescreen final
20180620 sauc oppenheimer consumer conference widescreen final20180620 sauc oppenheimer consumer conference widescreen final
20180620 sauc oppenheimer consumer conference widescreen finaldrhincorporated
 
Zep presentation - may 2013
Zep   presentation - may 2013Zep   presentation - may 2013
Zep presentation - may 2013Zep Inc.
 
Zep presentation - june 2013
Zep   presentation - june 2013Zep   presentation - june 2013
Zep presentation - june 2013Zep Inc.
 
Report on financial statement for five years using trend, comparative & comm...
Report on financial statement for five years using trend, comparative  & comm...Report on financial statement for five years using trend, comparative  & comm...
Report on financial statement for five years using trend, comparative & comm...Sayen Upreti
 
Ratio Analysis of Coca-Cola
Ratio Analysis of Coca-ColaRatio Analysis of Coca-Cola
Ratio Analysis of Coca-ColaWajid Ali
 
Moelis company april investor pres_vfinal (1)
Moelis  company april investor pres_vfinal (1)Moelis  company april investor pres_vfinal (1)
Moelis company april investor pres_vfinal (1)Moelis_Company
 
Moelis Investor Presentation
Moelis Investor PresentationMoelis Investor Presentation
Moelis Investor PresentationMoelis_Company
 
Market Strategy - October 2010
Market Strategy - October 2010Market Strategy - October 2010
Market Strategy - October 2010Angel Broking
 
Amdocs First Quarter Results for Fiscal 2009
Amdocs First Quarter Results for Fiscal 2009Amdocs First Quarter Results for Fiscal 2009
Amdocs First Quarter Results for Fiscal 2009earningsreport
 
Oshkosh Activist Situation Report
Oshkosh Activist Situation ReportOshkosh Activist Situation Report
Oshkosh Activist Situation ReportAlliance Advisors
 

What's hot (20)

ratio analysis cipla ltd
ratio analysis cipla ltdratio analysis cipla ltd
ratio analysis cipla ltd
 
Ebl. 2
Ebl. 2Ebl. 2
Ebl. 2
 
4863682 financial-analysis-on-annual-report-on-two-company
4863682 financial-analysis-on-annual-report-on-two-company4863682 financial-analysis-on-annual-report-on-two-company
4863682 financial-analysis-on-annual-report-on-two-company
 
Ebl 3
Ebl 3Ebl 3
Ebl 3
 
2007 Q4 TRW Auto Earnings Presentation
2007 Q4 TRW Auto Earnings Presentation 2007 Q4 TRW Auto Earnings Presentation
2007 Q4 TRW Auto Earnings Presentation
 
FIN 571 FINAL EXAM - FIN 571 FINAL EXAM Questions and Answers | Transwebetutors
FIN 571 FINAL EXAM - FIN 571 FINAL EXAM Questions and Answers | TranswebetutorsFIN 571 FINAL EXAM - FIN 571 FINAL EXAM Questions and Answers | Transwebetutors
FIN 571 FINAL EXAM - FIN 571 FINAL EXAM Questions and Answers | Transwebetutors
 
Aegon: simplification and growth
Aegon: simplification and growthAegon: simplification and growth
Aegon: simplification and growth
 
Moelis Company - Q3 Investor Presentation
Moelis Company - Q3 Investor PresentationMoelis Company - Q3 Investor Presentation
Moelis Company - Q3 Investor Presentation
 
20180620 sauc oppenheimer consumer conference widescreen final
20180620 sauc oppenheimer consumer conference widescreen final20180620 sauc oppenheimer consumer conference widescreen final
20180620 sauc oppenheimer consumer conference widescreen final
 
Zep presentation - may 2013
Zep   presentation - may 2013Zep   presentation - may 2013
Zep presentation - may 2013
 
Zep presentation - june 2013
Zep   presentation - june 2013Zep   presentation - june 2013
Zep presentation - june 2013
 
Report on financial statement for five years using trend, comparative & comm...
Report on financial statement for five years using trend, comparative  & comm...Report on financial statement for five years using trend, comparative  & comm...
Report on financial statement for five years using trend, comparative & comm...
 
Ratio Analysis of Coca-Cola
Ratio Analysis of Coca-ColaRatio Analysis of Coca-Cola
Ratio Analysis of Coca-Cola
 
Moelis company april investor pres_vfinal (1)
Moelis  company april investor pres_vfinal (1)Moelis  company april investor pres_vfinal (1)
Moelis company april investor pres_vfinal (1)
 
Moelis Investor Presentation
Moelis Investor PresentationMoelis Investor Presentation
Moelis Investor Presentation
 
BHP Billiton Petroleum
BHP Billiton PetroleumBHP Billiton Petroleum
BHP Billiton Petroleum
 
Ebl
EblEbl
Ebl
 
Market Strategy - October 2010
Market Strategy - October 2010Market Strategy - October 2010
Market Strategy - October 2010
 
Amdocs First Quarter Results for Fiscal 2009
Amdocs First Quarter Results for Fiscal 2009Amdocs First Quarter Results for Fiscal 2009
Amdocs First Quarter Results for Fiscal 2009
 
Oshkosh Activist Situation Report
Oshkosh Activist Situation ReportOshkosh Activist Situation Report
Oshkosh Activist Situation Report
 

Similar to First Capital Realty - FCR

Valuation Analysis and Structured Management Buy-Out of SolarTech Inc.
Valuation Analysis and Structured Management Buy-Out of SolarTech Inc.Valuation Analysis and Structured Management Buy-Out of SolarTech Inc.
Valuation Analysis and Structured Management Buy-Out of SolarTech Inc.Neda Petkova
 
wolfe power & gas final (1)
wolfe power & gas final (1)wolfe power & gas final (1)
wolfe power & gas final (1)AES_BigSky
 
ASSESSMENT 3 MARKETING PLAN (35 marks) A Marketing Plan provide.docx
ASSESSMENT 3 MARKETING PLAN (35 marks) A Marketing Plan provide.docxASSESSMENT 3 MARKETING PLAN (35 marks) A Marketing Plan provide.docx
ASSESSMENT 3 MARKETING PLAN (35 marks) A Marketing Plan provide.docxcargillfilberto
 
Legacy Reserves October 2013 Investor Presentation
Legacy Reserves October 2013 Investor PresentationLegacy Reserves October 2013 Investor Presentation
Legacy Reserves October 2013 Investor PresentationCompany Spotlight
 
09 16-14 baml power & gas final
09 16-14 baml power & gas final09 16-14 baml power & gas final
09 16-14 baml power & gas finalAES_BigSky
 
Credit Suisse Industrial and Environmental Services Conference 2013
Credit Suisse Industrial and Environmental Services Conference 2013Credit Suisse Industrial and Environmental Services Conference 2013
Credit Suisse Industrial and Environmental Services Conference 2013ProgressiveWaste
 
goldman sachs barclays-conference-presentation 2017
 goldman sachs barclays-conference-presentation 2017 goldman sachs barclays-conference-presentation 2017
goldman sachs barclays-conference-presentation 2017GE 94
 
03 30-15 april investor presentation final
03 30-15 april investor presentation final03 30-15 april investor presentation final
03 30-15 april investor presentation finalAES_BigSky
 
03 30-15 april investor presentation final
03 30-15 april investor presentation final03 30-15 april investor presentation final
03 30-15 april investor presentation finalAES_BigSky
 
Brookfield Office Properties - BPO - Quarterly Earnings
Brookfield Office Properties - BPO - Quarterly EarningsBrookfield Office Properties - BPO - Quarterly Earnings
Brookfield Office Properties - BPO - Quarterly EarningsKevin Cheng, CFA
 
Trc investor presentation final
Trc investor presentation finalTrc investor presentation final
Trc investor presentation finaltrcsolutions
 
12 15-14 december investor presentation final
12 15-14 december investor presentation final12 15-14 december investor presentation final
12 15-14 december investor presentation finalAES_BigSky
 
Rexnord Corporation (RXN) Q4 Fiscal Year 2020 Financial Results
Rexnord Corporation (RXN) Q4 Fiscal Year 2020 Financial ResultsRexnord Corporation (RXN) Q4 Fiscal Year 2020 Financial Results
Rexnord Corporation (RXN) Q4 Fiscal Year 2020 Financial ResultsRexnord
 
Merrill Lynch\'s Valuation
Merrill Lynch\'s ValuationMerrill Lynch\'s Valuation
Merrill Lynch\'s Valuationszrehman
 
April Investor Presentation
April Investor PresentationApril Investor Presentation
April Investor PresentationAES_BigSky
 
04 15-15 april investor presentation wc-final
04 15-15 april investor presentation wc-final04 15-15 april investor presentation wc-final
04 15-15 april investor presentation wc-finalAES_BigSky
 
Bank of America Merrill Lynch 2015 Transportation Conference
Bank of America Merrill Lynch 2015 Transportation ConferenceBank of America Merrill Lynch 2015 Transportation Conference
Bank of America Merrill Lynch 2015 Transportation ConferenceDelta_Airlines
 
2015 citi may presentation-final
2015 citi  may presentation-final2015 citi  may presentation-final
2015 citi may presentation-finalinvestor_phillips66
 

Similar to First Capital Realty - FCR (20)

Valuation Analysis and Structured Management Buy-Out of SolarTech Inc.
Valuation Analysis and Structured Management Buy-Out of SolarTech Inc.Valuation Analysis and Structured Management Buy-Out of SolarTech Inc.
Valuation Analysis and Structured Management Buy-Out of SolarTech Inc.
 
Fls Week 2 Additional Research
Fls Week 2   Additional ResearchFls Week 2   Additional Research
Fls Week 2 Additional Research
 
wolfe power & gas final (1)
wolfe power & gas final (1)wolfe power & gas final (1)
wolfe power & gas final (1)
 
ASSESSMENT 3 MARKETING PLAN (35 marks) A Marketing Plan provide.docx
ASSESSMENT 3 MARKETING PLAN (35 marks) A Marketing Plan provide.docxASSESSMENT 3 MARKETING PLAN (35 marks) A Marketing Plan provide.docx
ASSESSMENT 3 MARKETING PLAN (35 marks) A Marketing Plan provide.docx
 
Legacy Reserves October 2013 Investor Presentation
Legacy Reserves October 2013 Investor PresentationLegacy Reserves October 2013 Investor Presentation
Legacy Reserves October 2013 Investor Presentation
 
09 16-14 baml power & gas final
09 16-14 baml power & gas final09 16-14 baml power & gas final
09 16-14 baml power & gas final
 
Credit Suisse Industrial and Environmental Services Conference 2013
Credit Suisse Industrial and Environmental Services Conference 2013Credit Suisse Industrial and Environmental Services Conference 2013
Credit Suisse Industrial and Environmental Services Conference 2013
 
goldman sachs barclays-conference-presentation 2017
 goldman sachs barclays-conference-presentation 2017 goldman sachs barclays-conference-presentation 2017
goldman sachs barclays-conference-presentation 2017
 
03 30-15 april investor presentation final
03 30-15 april investor presentation final03 30-15 april investor presentation final
03 30-15 april investor presentation final
 
03 30-15 april investor presentation final
03 30-15 april investor presentation final03 30-15 april investor presentation final
03 30-15 april investor presentation final
 
Brookfield Office Properties - BPO - Quarterly Earnings
Brookfield Office Properties - BPO - Quarterly EarningsBrookfield Office Properties - BPO - Quarterly Earnings
Brookfield Office Properties - BPO - Quarterly Earnings
 
Trc investor presentation final
Trc investor presentation finalTrc investor presentation final
Trc investor presentation final
 
12 15-14 december investor presentation final
12 15-14 december investor presentation final12 15-14 december investor presentation final
12 15-14 december investor presentation final
 
Rexnord Corporation (RXN) Q4 Fiscal Year 2020 Financial Results
Rexnord Corporation (RXN) Q4 Fiscal Year 2020 Financial ResultsRexnord Corporation (RXN) Q4 Fiscal Year 2020 Financial Results
Rexnord Corporation (RXN) Q4 Fiscal Year 2020 Financial Results
 
Monthly highlights
Monthly highlightsMonthly highlights
Monthly highlights
 
Merrill Lynch\'s Valuation
Merrill Lynch\'s ValuationMerrill Lynch\'s Valuation
Merrill Lynch\'s Valuation
 
April Investor Presentation
April Investor PresentationApril Investor Presentation
April Investor Presentation
 
04 15-15 april investor presentation wc-final
04 15-15 april investor presentation wc-final04 15-15 april investor presentation wc-final
04 15-15 april investor presentation wc-final
 
Bank of America Merrill Lynch 2015 Transportation Conference
Bank of America Merrill Lynch 2015 Transportation ConferenceBank of America Merrill Lynch 2015 Transportation Conference
Bank of America Merrill Lynch 2015 Transportation Conference
 
2015 citi may presentation-final
2015 citi  may presentation-final2015 citi  may presentation-final
2015 citi may presentation-final
 

More from Kevin Cheng, CFA

Equity Strategy - Consumer Staples
Equity Strategy - Consumer StaplesEquity Strategy - Consumer Staples
Equity Strategy - Consumer StaplesKevin Cheng, CFA
 
CXP initiation - Office REIT
CXP initiation - Office REITCXP initiation - Office REIT
CXP initiation - Office REITKevin Cheng, CFA
 
Equity Strategy - Staying Defensive
Equity Strategy - Staying DefensiveEquity Strategy - Staying Defensive
Equity Strategy - Staying DefensiveKevin Cheng, CFA
 
Asset Managers - Recession risks, Trust Banks & Asset Mgrs
Asset Managers - Recession risks, Trust Banks & Asset MgrsAsset Managers - Recession risks, Trust Banks & Asset Mgrs
Asset Managers - Recession risks, Trust Banks & Asset MgrsKevin Cheng, CFA
 
Asset Managers - Defensive But Not Immune
Asset Managers - Defensive But Not ImmuneAsset Managers - Defensive But Not Immune
Asset Managers - Defensive But Not ImmuneKevin Cheng, CFA
 

More from Kevin Cheng, CFA (12)

Equity Strategy - Consumer Staples
Equity Strategy - Consumer StaplesEquity Strategy - Consumer Staples
Equity Strategy - Consumer Staples
 
Equity Strategy - TSX
Equity Strategy - TSXEquity Strategy - TSX
Equity Strategy - TSX
 
Focus - Economic Research
Focus - Economic ResearchFocus - Economic Research
Focus - Economic Research
 
DEA Initiation Report
DEA Initiation ReportDEA Initiation Report
DEA Initiation Report
 
CXP initiation - Office REIT
CXP initiation - Office REITCXP initiation - Office REIT
CXP initiation - Office REIT
 
Agf market outlook
Agf market outlookAgf market outlook
Agf market outlook
 
Equity Strategy - Staying Defensive
Equity Strategy - Staying DefensiveEquity Strategy - Staying Defensive
Equity Strategy - Staying Defensive
 
Asset Managers - Recession risks, Trust Banks & Asset Mgrs
Asset Managers - Recession risks, Trust Banks & Asset MgrsAsset Managers - Recession risks, Trust Banks & Asset Mgrs
Asset Managers - Recession risks, Trust Banks & Asset Mgrs
 
Asset Managers - Defensive But Not Immune
Asset Managers - Defensive But Not ImmuneAsset Managers - Defensive But Not Immune
Asset Managers - Defensive But Not Immune
 
The deleveraging cycle
The deleveraging cycleThe deleveraging cycle
The deleveraging cycle
 
Market Strategy
Market StrategyMarket Strategy
Market Strategy
 
U.S. Real Rates
U.S. Real RatesU.S. Real Rates
U.S. Real Rates
 

Recently uploaded

Independent Lucknow Call Girls 8923113531WhatsApp Lucknow Call Girls make you...
Independent Lucknow Call Girls 8923113531WhatsApp Lucknow Call Girls make you...Independent Lucknow Call Girls 8923113531WhatsApp Lucknow Call Girls make you...
Independent Lucknow Call Girls 8923113531WhatsApp Lucknow Call Girls make you...makika9823
 
Mulki Call Girls 7001305949 WhatsApp Number 24x7 Best Services
Mulki Call Girls 7001305949 WhatsApp Number 24x7 Best ServicesMulki Call Girls 7001305949 WhatsApp Number 24x7 Best Services
Mulki Call Girls 7001305949 WhatsApp Number 24x7 Best Servicesnajka9823
 
Vp Girls near me Delhi Call Now or WhatsApp
Vp Girls near me Delhi Call Now or WhatsAppVp Girls near me Delhi Call Now or WhatsApp
Vp Girls near me Delhi Call Now or WhatsAppmiss dipika
 
Bladex Earnings Call Presentation 1Q2024
Bladex Earnings Call Presentation 1Q2024Bladex Earnings Call Presentation 1Q2024
Bladex Earnings Call Presentation 1Q2024Bladex
 
Instant Issue Debit Cards - School Designs
Instant Issue Debit Cards - School DesignsInstant Issue Debit Cards - School Designs
Instant Issue Debit Cards - School Designsegoetzinger
 
Lundin Gold April 2024 Corporate Presentation v4.pdf
Lundin Gold April 2024 Corporate Presentation v4.pdfLundin Gold April 2024 Corporate Presentation v4.pdf
Lundin Gold April 2024 Corporate Presentation v4.pdfAdnet Communications
 
Stock Market Brief Deck for 4/24/24 .pdf
Stock Market Brief Deck for 4/24/24 .pdfStock Market Brief Deck for 4/24/24 .pdf
Stock Market Brief Deck for 4/24/24 .pdfMichael Silva
 
fca-bsps-decision-letter-redacted (1).pdf
fca-bsps-decision-letter-redacted (1).pdffca-bsps-decision-letter-redacted (1).pdf
fca-bsps-decision-letter-redacted (1).pdfHenry Tapper
 
House of Commons ; CDC schemes overview document
House of Commons ; CDC schemes overview documentHouse of Commons ; CDC schemes overview document
House of Commons ; CDC schemes overview documentHenry Tapper
 
Classical Theory of Macroeconomics by Adam Smith
Classical Theory of Macroeconomics by Adam SmithClassical Theory of Macroeconomics by Adam Smith
Classical Theory of Macroeconomics by Adam SmithAdamYassin2
 
OAT_RI_Ep19 WeighingTheRisks_Apr24_TheYellowMetal.pptx
OAT_RI_Ep19 WeighingTheRisks_Apr24_TheYellowMetal.pptxOAT_RI_Ep19 WeighingTheRisks_Apr24_TheYellowMetal.pptx
OAT_RI_Ep19 WeighingTheRisks_Apr24_TheYellowMetal.pptxhiddenlevers
 
(办理学位证)加拿大萨省大学毕业证成绩单原版一比一
(办理学位证)加拿大萨省大学毕业证成绩单原版一比一(办理学位证)加拿大萨省大学毕业证成绩单原版一比一
(办理学位证)加拿大萨省大学毕业证成绩单原版一比一S SDS
 
Call Girls In Yusuf Sarai Women Seeking Men 9654467111
Call Girls In Yusuf Sarai Women Seeking Men 9654467111Call Girls In Yusuf Sarai Women Seeking Men 9654467111
Call Girls In Yusuf Sarai Women Seeking Men 9654467111Sapana Sha
 
Andheri Call Girls In 9825968104 Mumbai Hot Models
Andheri Call Girls In 9825968104 Mumbai Hot ModelsAndheri Call Girls In 9825968104 Mumbai Hot Models
Andheri Call Girls In 9825968104 Mumbai Hot Modelshematsharma006
 
Vip B Aizawl Call Girls #9907093804 Contact Number Escorts Service Aizawl
Vip B Aizawl Call Girls #9907093804 Contact Number Escorts Service AizawlVip B Aizawl Call Girls #9907093804 Contact Number Escorts Service Aizawl
Vip B Aizawl Call Girls #9907093804 Contact Number Escorts Service Aizawlmakika9823
 
SBP-Market-Operations and market managment
SBP-Market-Operations and market managmentSBP-Market-Operations and market managment
SBP-Market-Operations and market managmentfactical
 
government_intervention_in_business_ownership[1].pdf
government_intervention_in_business_ownership[1].pdfgovernment_intervention_in_business_ownership[1].pdf
government_intervention_in_business_ownership[1].pdfshaunmashale756
 
call girls in Nand Nagri (DELHI) 🔝 >༒9953330565🔝 genuine Escort Service 🔝✔️✔️
call girls in  Nand Nagri (DELHI) 🔝 >༒9953330565🔝 genuine Escort Service 🔝✔️✔️call girls in  Nand Nagri (DELHI) 🔝 >༒9953330565🔝 genuine Escort Service 🔝✔️✔️
call girls in Nand Nagri (DELHI) 🔝 >༒9953330565🔝 genuine Escort Service 🔝✔️✔️9953056974 Low Rate Call Girls In Saket, Delhi NCR
 

Recently uploaded (20)

Independent Lucknow Call Girls 8923113531WhatsApp Lucknow Call Girls make you...
Independent Lucknow Call Girls 8923113531WhatsApp Lucknow Call Girls make you...Independent Lucknow Call Girls 8923113531WhatsApp Lucknow Call Girls make you...
Independent Lucknow Call Girls 8923113531WhatsApp Lucknow Call Girls make you...
 
Mulki Call Girls 7001305949 WhatsApp Number 24x7 Best Services
Mulki Call Girls 7001305949 WhatsApp Number 24x7 Best ServicesMulki Call Girls 7001305949 WhatsApp Number 24x7 Best Services
Mulki Call Girls 7001305949 WhatsApp Number 24x7 Best Services
 
Vp Girls near me Delhi Call Now or WhatsApp
Vp Girls near me Delhi Call Now or WhatsAppVp Girls near me Delhi Call Now or WhatsApp
Vp Girls near me Delhi Call Now or WhatsApp
 
Bladex Earnings Call Presentation 1Q2024
Bladex Earnings Call Presentation 1Q2024Bladex Earnings Call Presentation 1Q2024
Bladex Earnings Call Presentation 1Q2024
 
Instant Issue Debit Cards - School Designs
Instant Issue Debit Cards - School DesignsInstant Issue Debit Cards - School Designs
Instant Issue Debit Cards - School Designs
 
Lundin Gold April 2024 Corporate Presentation v4.pdf
Lundin Gold April 2024 Corporate Presentation v4.pdfLundin Gold April 2024 Corporate Presentation v4.pdf
Lundin Gold April 2024 Corporate Presentation v4.pdf
 
Stock Market Brief Deck for 4/24/24 .pdf
Stock Market Brief Deck for 4/24/24 .pdfStock Market Brief Deck for 4/24/24 .pdf
Stock Market Brief Deck for 4/24/24 .pdf
 
fca-bsps-decision-letter-redacted (1).pdf
fca-bsps-decision-letter-redacted (1).pdffca-bsps-decision-letter-redacted (1).pdf
fca-bsps-decision-letter-redacted (1).pdf
 
House of Commons ; CDC schemes overview document
House of Commons ; CDC schemes overview documentHouse of Commons ; CDC schemes overview document
House of Commons ; CDC schemes overview document
 
🔝+919953056974 🔝young Delhi Escort service Pusa Road
🔝+919953056974 🔝young Delhi Escort service Pusa Road🔝+919953056974 🔝young Delhi Escort service Pusa Road
🔝+919953056974 🔝young Delhi Escort service Pusa Road
 
Classical Theory of Macroeconomics by Adam Smith
Classical Theory of Macroeconomics by Adam SmithClassical Theory of Macroeconomics by Adam Smith
Classical Theory of Macroeconomics by Adam Smith
 
OAT_RI_Ep19 WeighingTheRisks_Apr24_TheYellowMetal.pptx
OAT_RI_Ep19 WeighingTheRisks_Apr24_TheYellowMetal.pptxOAT_RI_Ep19 WeighingTheRisks_Apr24_TheYellowMetal.pptx
OAT_RI_Ep19 WeighingTheRisks_Apr24_TheYellowMetal.pptx
 
(办理学位证)加拿大萨省大学毕业证成绩单原版一比一
(办理学位证)加拿大萨省大学毕业证成绩单原版一比一(办理学位证)加拿大萨省大学毕业证成绩单原版一比一
(办理学位证)加拿大萨省大学毕业证成绩单原版一比一
 
Call Girls In Yusuf Sarai Women Seeking Men 9654467111
Call Girls In Yusuf Sarai Women Seeking Men 9654467111Call Girls In Yusuf Sarai Women Seeking Men 9654467111
Call Girls In Yusuf Sarai Women Seeking Men 9654467111
 
Andheri Call Girls In 9825968104 Mumbai Hot Models
Andheri Call Girls In 9825968104 Mumbai Hot ModelsAndheri Call Girls In 9825968104 Mumbai Hot Models
Andheri Call Girls In 9825968104 Mumbai Hot Models
 
Vip B Aizawl Call Girls #9907093804 Contact Number Escorts Service Aizawl
Vip B Aizawl Call Girls #9907093804 Contact Number Escorts Service AizawlVip B Aizawl Call Girls #9907093804 Contact Number Escorts Service Aizawl
Vip B Aizawl Call Girls #9907093804 Contact Number Escorts Service Aizawl
 
SBP-Market-Operations and market managment
SBP-Market-Operations and market managmentSBP-Market-Operations and market managment
SBP-Market-Operations and market managment
 
government_intervention_in_business_ownership[1].pdf
government_intervention_in_business_ownership[1].pdfgovernment_intervention_in_business_ownership[1].pdf
government_intervention_in_business_ownership[1].pdf
 
Monthly Economic Monitoring of Ukraine No 231, April 2024
Monthly Economic Monitoring of Ukraine No 231, April 2024Monthly Economic Monitoring of Ukraine No 231, April 2024
Monthly Economic Monitoring of Ukraine No 231, April 2024
 
call girls in Nand Nagri (DELHI) 🔝 >༒9953330565🔝 genuine Escort Service 🔝✔️✔️
call girls in  Nand Nagri (DELHI) 🔝 >༒9953330565🔝 genuine Escort Service 🔝✔️✔️call girls in  Nand Nagri (DELHI) 🔝 >༒9953330565🔝 genuine Escort Service 🔝✔️✔️
call girls in Nand Nagri (DELHI) 🔝 >༒9953330565🔝 genuine Escort Service 🔝✔️✔️
 

First Capital Realty - FCR

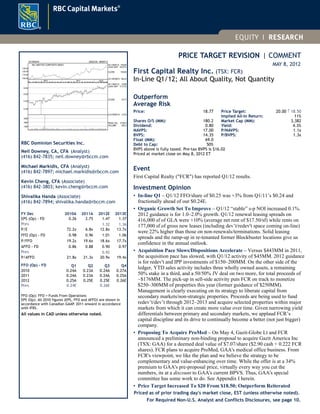
  • 1. PRICE TARGET REVISION | COMMENT MAY 8, 2012 First Capital Realty Inc. (TSX: FCR) In-Line Q1/12; All About Quality, Not Quantity Outperform Average Risk Price: 18.77 Shares O/S (MM): 180.2 Dividend: 0.80 NAVPS: 17.00 BVPS: 14.35 Float (MM): 69.0 Debt to Cap: 50% Price Target: 20.00 ↑ 18.50 Implied All-In Return: 11% Market Cap (MM): 3,382 Yield: 4.3% P/NAVPS: 1.1x P/BVPS: 1.3x BVPS above is fully taxed. Pre-tax BVPS is $16.02 Priced at market close on May 8, 2012 ET Event First Capital Realty ("FCR") has reported Q1/12 results. Investment Opinion • In-line Q1 – Q1/12 FFO/share of $0.25 was +3% from Q1/11’s $0.24 and fractionally ahead of our $0.24E. • Organic Growth Set To Improve – Q1/12 “stable” s-p NOI increased 0.1%. 2012 guidance is for 1.0–2.0% growth. Q1/12 renewal leasing spreads on 416,000 sf of GLA were +10% (average net rent of $17.50/sf) while rents on 177,000 sf of gross new leases (including dev’t/redev't space coming on-line) were 22% higher than those on non-renewals/terminations. Solid leasing spreads and the ramp-up in re-tenanted former Blockbuster locations give us confidence in the annual outlook. • Acquisition Pace Slows/Dispositions Accelerate – Versus $443MM in 2011, the acquisition pace has slowed, with Q1/12 activity of $45MM. 2012 guidance is for redev't and IPP investments of $150–200MM. On the other side of the ledger, YTD sales activity includes three wholly owned assets, a remaining 50% stake in a third, and a 50/50% JV deal on two more, for total proceeds of ~$176MM. The pick-up in sell-side activity puts FCR on track to monetize $250–300MM of properties this year (former guidance of $250MM). Management is clearly executing on its strategy to liberate capital from secondary markets/non-strategic properties. Proceeds are being used to fund redev’t/dev’t through 2012–2013 and acquire selected properties within major markets from which it can create more value over time. Given narrowing yield differentials between primary and secondary markets, we applaud FCR’s capital discipline and its drive to continually become a better (not just bigger) company. • Proposing To Acquire ProMed – On May 4, Gazit-Globe Lt and FCR announced a preliminary non-binding proposal to acquire Gazit America Inc (TSX: GAA) for a deemed deal value of $7.07/share ($2.90 cash + 0.222 FCR shares). FCR plans to acquire ProMed, GAA's medical office business. From FCR's viewpoint, we like the plan and we believe the strategy to be complementary and value-enhancing over time. While the offer is at a 34% premium to GAA's pre-proposal price, virtually every way you cut the numbers, its at a discount to GAA's current BPVS. Thus, GAA's special committee has some work to do. See Appendix I herein. • Price Target Increased To $20 From $18.50; Outperform Reiterated Priced as of prior trading day's market close, EST (unless otherwise noted). 125 WEEKS 25DEC09 - 08MAY12 12.00 14.00 16.00 18.00 D J F M A M J J A S O N 2010 D J F M A M J J A S O N 2011 D J F M A M 2012 HI-11MAY12 18.86 LO/HI DIFF 77.51% CLOSE 18.77 LO-07MAY10 10.63 1500 3000 4500 PEAK VOL. 5738.0 VOLUME 362.5 100.00 110.00 120.00 130.00 Rel. S&P/TSX COMPOSITE INDEX HI-11MAY12 139.89 LO/HI DIFF 45.07% CLOSE 139.89 LO-19FEB10 96.43 RBC Dominion Securities Inc. Neil Downey, CA, CFA (Analyst) (416) 842-7835; neil.downey@rbccm.com Michael Markidis, CFA (Analyst) (416) 842-7897; michael.markidis@rbccm.com Kevin Cheng, CFA (Associate) (416) 842-3803; kevin.cheng@rbccm.com Shivalika Handa (Associate) (416) 842-7894; shivalika.handa@rbccm.com FY Dec 2010A 2011A 2012E 2013E EPS (Op) - FD 0.26 2.75 1.47 1.37 Prev. 1.32 1.36 P/E 72.2x 6.8x 12.8x 13.7x FFO (Op) - FD 0.98 0.96 1.01 1.06 P/FFO 19.2x 19.6x 18.6x 17.7x AFFO - FD 0.86 0.88 0.90 0.97 Prev. 0.92 P/AFFO 21.8x 21.3x 20.9x 19.4x FFO (Op) - FD Q1 Q2 Q3 Q4 2010 0.24A 0.23A 0.24A 0.27A 2011 0.24A 0.23A 0.24A 0.25A 2012 0.25A 0.25E 0.25E 0.26E Prev. 0.24E 0.26E FFO (Op): FFO = Funds From Operations EPS (Op): All 2010 figures (EPS, FFO and AFFO) are shown in accordance with Canadian GAAP. 2011 onward in accordance with IFRS. All values in CAD unless otherwise noted. For Required Non-U.S. Analyst and Conflicts Disclosures, see page 10.
  • 2. 2 Q1/12 Results and Recap An In-line Quarter – Q1/12 FFO/share of $0.25 (rounded) marked a 3% increase from Q1/11’s $0.24 and was fractionally ahead of our $0.24 estimate. Operating results were in line with our expectations. Lower than expected interest expense was the primary driver of variance to our forecast. Occupancy Slips Modestly – Q1/12 occupancy of 95.9% was down 50bps from Q1/11’s 96.4% and 30bps sequentially from Q4/11’s 96.2%. During the first quarter, two locations tenanted by Hart Stores (30,900 sf) and Premier Fitness (21,800 sf) were closed due to bankruptcy. We note that the latter has subsequently been taken up by GoodLife Fitness. FCR’s occupancy stats continue to be negatively impacted by the October 2011 bankruptcy of Blockbuster Canada. Firm commitments from 21 new tenants for 70,000 sf (of the 117,000 sf vacated) have been received, yet only six of these tenants had taken occupancy by March 31. Over the next two quarters, the Blockbuster failure should prove to be a positive for shareholders, in our view. Same-Property NOI Growth Set To Improve – Q1/12 “stable” same-property NOI increased 0.1%. This figure specifically excludes properties that are relatively stable but are undergoing a façade, parking, or lighting upgrade, or that have expansion pads or building extensions under way. For the full-year 2012, Management has guided toward “stable” same-property NOI growth in the range of 1% to 2%. Exhibit 1: Quarterly Portfolio Occupancy And Same-Property NOI Growth (Q1/04 To Q1/12) 90% 92% 94% 96% 98% Q1/04 Q3/05 Q1/07 Q3/08 Q1/10 Q3/11 Portfolio Occupancy Long-Term Average -2% 0% 2% 4% 6% 8% Q1/04 Q1/06 Q1/08 Q1/10 Q1/12 Same-Property NOI Growth 4Q Moving Avg. Source: RBC Capital Markets and Company reports Healthy Leasing Spreads On Renewals – A total of 416,000 sf of space was renewed during Q1/12. The average net rent of $17.50/sf on this space represented a healthy spread of 9.6% over the expiring rate of $15.96/sf. Gross new leases (which includes development and redevelopment space coming on-line) aggregated to 177,000 sf. We calculate that these new leases were executed at net rents of $22.22/sf, or 22.0% higher than the net rents on leases that were not renewed/terminated during the quarter. Over the next four years (through to the end of 2015), annual lease maturities are relatively consistent, averaging 2.3 million sf (~10% of total portfolio GLA). With average expiring rents of ~$17/sf being significantly below market rent estimates, this should be a solid driver behind improved same-property NOI growth over the medium term. Acquisition Pace Slows; Planning To Acquire ProMed – Compared to 2011 ($443 million), FCR’s acquisition pace has slowed, with $45 million of acquisitions completed during the first quarter specifically. Q1/12 acquisitions added 59,200 sf of retail space and 3.6 acres of land to FCR’s portfolio. FCR’s outlook for 2012 guides toward expected investment activity of $150–200 million into redevelopment and income producing property acquisitions. Property specific details of the Q1/12 activity are highlighted in Exhibit 2 below. Not contemplated within the investment volume noted above is FCR’s proposal to acquire ProMed from Gazit America Inc. This conditional offer was announced after the market close on May 4. The 930,000 sf of GLA owned by ProMed has a value in the $215– 225 million range. We see the ownership and management of medical office buildings and related healthcare real estate as a natural extension/evolution of FCR’s business model, from being solely a shopping centre owner (manager and developer) to one with mixed- use and other properties. We provide additional details and commentary on this proposed transaction in Appendix 1 on page 5. First Capital Realty Inc.May 8, 2012
  • 3. 3 Exhibit 2: Q1/12 Acquisition Activity City Prov. Quarter Price ($MM) GLA (sf) Acres $/sf $MM / Acre Mount Royal Village (The Devenish)1 Calgary AB Q1 22.1 43,200 n.a. 512 n.a. Langford Centre (2800 Bryn Maur Road) Langford BC Q1 3.9 16,000 n.a. 244 n.a. Loblaws Plaza (1450 Merivale Road) Ottawa ON Q1 2.4 n.a. 0.6 n.a. 4.4 Other Toronto ON Q1 2.8 n.a. n.a. n.a. n.a. 5500 Dundas Street Etobicoke ON Q1 6.2 n.a. 2.4 n.a. 2.6 Main & Main Developments Toronto ON Q1 7.4 n.a. 0.6 n.a. 12.3 Total Q1/12 Acquisitions 44.8 59,200 3.6 Notes: 1 Excludes a residential component of ~13,000 sf, which is not included in FCR's total GLA Source: RBC Capital Markets and Company reports Development/Redevelopment Activities: The Beat Goes On…This Could Be The Biggest Year Of New Deliveries In FCR’s History – FCR continues to advance its development/redevelopment initiatives. In this regard, $54.3 million was invested during Q1/12, resulting in the delivery of 90,000 sf of space. In totality, FCR expects to deliver 600,000–700,000 sf from development, redevelopment, and expansion to income producing status this year. Having a gross value of $250–300 million, this would make 2012 the most active new development year in the company’s history. We believe yield on cost will be in the 7.0–8.0% range. Exhibit 3 below summarizes the active development pipeline through to 2013, as it currently stands. Exhibit 3: Active Development Pipeline – 2012 To 2013 Costs ($MM) GLA (sf) Incurred Remaining Total Completed Active Total Same Property With Redevelopment And Expansion 16.9 33.5 50.4 n.a. 86,760 86,760 Major Redevelopment 281.3 58.7 340.0 738,569 361,344 1,099,913 Greenfield Development 262.5 52.0 314.5 781,347 360,081 1,141,428 Total 2012-2013 560.8 144.1 654.5 1,519,916 808,185 2,241,341 Source: RBC Capital Markets and Company reports Management has noted that in 2013–2014, the company plans to commence approximately six projects, each of which will be generally quite large. For instance, the large scale mixed-use (retail, office, residential, below grade parking) redevelopment intensification scheme at Humbertown Shopping Centre would be a multi-year, multi-phase project with a capital budget in excess of $300 million. We understand that FCR has partnered with Tridel on the proposed mid- to high-rise residential components of this project. Capital Recycling Program Gains Traction – FCR has actually increased its guidance for asset dispositions in 2012 from $250 million to $300 million. In Q1/12, two wholly owned properties (Woodgrove Crossing, Nanaimo, BC; and the Woolridge Building, Coquitlam, BC) and the remaining 50% interest in a third property (Orleans Gardens, Gloucester, ON) were sold for total gross proceeds of $48 million. This rendered a balance of $250 million of properties that were classified as “held for sale” at Q1/12. Subsequently, FCR disposed of its 50% interests in two properties, located in Sherwood Park, AB, to an institutional investor and a 100% stake in its 332,000 sf Brantford Commons shopping Centre. Gross proceeds from the three transactions were $128 million. FCR will continue to manage the joint-ventured Alberta properties (for its own account, and on behalf of its new partner). FCR is clearly executing upon its strategy to liberate capital from properties that are not considered to be strategic and/or are located in smaller markets. Proceeds are being used to fund the redevelopment/development pipeline through 2012 and beyond, and to acquire selected properties within major markets from which FCR believes it will be able to create value over time. Given robust pricing parameters in the private property market, and, the narrowing of property yields between secondary and primary markets, we applaud FCR’s capital discipline and its drive to continually become a better (and not just a bigger) company. Balance Sheet Is In Strong Shape – Q1/12 liquidity of $420 million consisted of $2 million in cash and $418 million of available credit. On April 4, FCR issued $175 million of Series “N” unsecured debentures (4.5% fixed rate; ~240 bps new issue spread; due March 2021). We believe a portion of the net proceeds from this offering will be used to retire the $100 million of Series “A” unsecured debentures (5.08% coupon) maturing in June 2012. Incorporating these transactions, we see pro forma liquidity of roughly $490 million (see Exhibit 4). First Capital Realty Inc.May 8, 2012
  • 4. 4 We believe FCR’s solid liquidity position, access to multiple forms of debt capital (property specific mortgages, unsecured debentures and convertibles), and ongoing property disposition program should provide the company with substantial financial flexibility to fund its property development and redevelopment initiatives into 2013, without tapping the market for additional equity capital. Exhibit 4: Pro Forma Liquidity And Debt Maturity Profile ($MM, unless noted)1 Cash 2 Undrawn Lines 488 Liquidity 490 Lines 36 Unsecured Debentures 1,322 Convertible Debentures 356 Mortgages 1,463 Total Debt 3,178 Liquidity as a % of Total Debt 15% % Unsecured 53% % Secured 47% 0 300 600 900 1,200 1,500 1,800 Liquidity Lines 2012 Commercial Property Debt Unsecured Debentures Res. & Land Development Debt 0 300 600 900 1,200 1,500 1,800 Liquidity Lines 2012 Commercial Property Debt Unsecured Debentures Res. & Land Development Debt 0 300 600 900 1,200 1,500 1,800 Liquidity Lines 2012 Commercial Property Debt Unsecured Debentures Res. & Land Development Debt 0 300 600 900 1,200 1,500 1,800 Liquidity Lines 2012 Commercial Property Debt Unsecured Debentures Res. & Land Development Debt 0 300 600 900 1,200 1,500 1,800 Liquidity Lines 2012 Commercial Property Debt Unsecured Debentures Res. & Land Development Debt 0 500 1,000 1,500 2,000 Liquidity Lines 2012 2013 2014 2015 2016+ Mortgages Unsecured Debentures Convertible Debentures Note: 1 Incorporates $175 million Series “N” unsecured debentures (issued April 4) and assumed repayment of $100 million of Series "A" unsecured debentures due in June 2012 Source: RBC Capital Markets estimates and Company reports Exhibit 5: Summary NAV And Sensitivity Matrix ($MM, unless noted) NAV/Unit Sensitivity - Change In Forward 12-Months' NOI 3% 2% 1% 0% -1% -2% -3% FTM NOI ("Cash Basis") 351 5.25% $22.66 $22.30 $21.94 $21.58 $21.21 $20.85 $20.49 Cap Rate Applied By RBC CM 6.0% 5.50% $20.97 $20.62 $20.28 $19.94 $19.59 $19.25 $18.90 Gross Property Value 5,852 5.75% $19.43 $19.10 $18.77 $18.44 $18.11 $17.78 $17.45 + Value Of Other Assets 522 6.00% $18.02 $17.70 $17.38 $17.00 $16.75 $16.44 $16.12 = Total Assets 6,373 6.25% $16.72 $16.41 $16.11 $15.81 $15.51 $15.20 $14.90 - Net Debt And Convertible Debt (3,195) 6.50% $15.52 $15.23 $14.93 $14.64 $14.35 $14.06 $13.77 - Non-Controlling Interests (11) 6.75% $14.41 $14.13 $13.85 $13.57 $13.28 $13.00 $12.72 = NAV 3,167 Diluted Shares (MM) 186 Premium/(Discount) To NAV Sensitivity - Change In FTM NOI NAV/Share $17.00 3% 2% 1% 0% -1% -2% -3% Share Price $18.77 5.25% -17% -16% -14% -13% -12% -10% -8% Premium (Discount) To NAV 10% 5.50% -10% -9% -7% -6% -4% -2% -1% 5.75% -3% -2% 0% 2% 4% 6% 8% LTV 50% 6.00% 4% 6% 8% 10% 12% 14% 16% LTV - excluding Conv. Debs 44% 6.25% 12% 14% 17% 19% 21% 23% 26% 6.50% 21% 23% 26% 28% 31% 33% 36% 6.75% 30% 33% 36% 38% 41% 44% 48% CapRateCapRate Source: RBC Capital Markets estimates and Company reports FFO/Share Estimates Unchanged; Price Target Increased To $20 (From $18.50) – Our 2012/2013 FFO/share estimates remain unchanged at $1.01 and $1.06, respectively. We’ve increased our price target to $20 (from $18.50). Our revised price target is derived via the application of a 21x multiple (was 18.5x) to our 2013 AFFO/unit estimate. Our target multiple continues to represents a premium to the average which we apply to our Canadian commercial property universe. We believe this is justified in light of the high quality and defensive characteristics inherent in the portfolio, FCR’s value-added business model, the strength in its capital structure, and overall franchise value. Based on relative return expectations, we reiterate our Outperform, Average Risk rating. First Capital Realty Inc.May 8, 2012
  • 5. 5 Appendix I: The Proposal To Acquire ProMed Though A Gazit-America (GAA) Privatization On May 4, Gazit-Globe Ltd (NYSE:GZT, “Gazit-Globe”,) and First Capital Realty (“FCR”) announced a preliminary non-binding proposal to acquire Gazit America Inc (TSX: GAA) for deemed value of $7.07 per GAA share. Consideration will be part cash and part in the form of FCR common shares. Gazit-Globe owns 73.1% of GAA’s outstanding shares. The acquisition proposal is for the remaining 26.9%. GAA’s business consists principally of two assets: i) An interest in 930,000 sf of medical office and related real estate, which had a Q4/11 IFRS fair value of $218 million; and ii) 14.3 million common shares (representing a 12.5% stake) of Equity One, Inc. (NYSE: EQY), a U.S. shopping centre REIT. At Q4/11, GAA’s liability profile included $232 million in mortgages, credit facilities and term loans, and $57 million of loans from affiliates (including US$36 million from FCR). This placed Q4/11 leverage at a comparatively high 60%. Having said this, we note GAA does not pay a dividend. In our view, a business model with 100% earnings retention is capable of supporting higher gearing than that of the typical REIT, which pays out the vast majority of its earnings. Exhibit 6: Gazit America’s Balance Sheet (As At Q4/11 And RBC CM’s Current Estimates) ($MM unless noted) MTM Est. Current Q4/11A Adj.1 Fair Value Investment Properties 218.4 4.1 222.5 Equity One Shares 246.6 52.5 299.1 Other Assets 18.5 18.5 Total Assets 483.4 56.7 540.1 Mortgages, Credit Facilities and Term Loans 232.0 232.0 Loans From Affiliates (includes US$36MM from FCR) 57.4 57.4 Deferred Income Tax Liability 41.6 17.0 58.6 Other Liabilities 7.7 7.7 Total Liabilities 338.7 17.0 355.7 Equity 144.7 39.7 184.4 Total Liabilities And Equity 483.4 56.7 540.1 Total Debt To Gross Assets 60% 54% Shares (MM) 23.3 23.3 Fully Diluted Shares (MM) 34.8 34.8 Note: 1 Adjustments made by RBC Capital Markets to estimate the current Fair Value balance sheet for GAA. Major assumptions include EQY share price of US$21.10 and a combined effective tax rate of 30%. Source: RBC Capital Markets estimates and Company reports Proposed Transaction Mechanics And Timeline – The proposed transaction will see FCR acquire ProMed Properties (CA) Inc., the legal entity that holds all of the Canadian investment properties. As such, FCR will also assume ProMed’s liabilities. And, to the extent there are other liabililites within GAA that are related to the direct property portfolio, FCR may also be responsible to acquire/assume these. Gazit will acquire GAA’s other assets (principally the EQY shares) and liabilities. Exhibit 7: Gazit America – Simplified Organizational Structure Gazit America Inc. (Ontario) Silver Maple (2001) Inc. (Nevada) ProMed Properties (CA) Inc. (Ontario) Ficus Inc. (Delaware) Equity One, Inc. (Delaware) (12.5% stake) The Medical and Health Care Properties and Redevelopment Assets Source: RBC Capital Markets and GAA reports First Capital Realty Inc.May 8, 2012
  • 6. 6 The $7.07 stated preliminary offer price per GAA share consists of the sum of $2.90 in cash and 0.222 FCR shares (at a deemed price of $18.75) per GAA share. We note that (in general terms) the cash component of the offer will increase or decrease by a factor of 40% of the amount by which the EQY share price exceeds US$21.75 or declines below US$18.75. A special committee of GAA’s board of directors has been established. This committee has already engaged an advisor to assist in forming its opinion on the preliminary offer (and presumably, in negotiating any changes). Ultimately, any firm proposal will require (among other things) approval by the minority shareholders of Gazit America at a special meeting called for this purpose. The joint press release from GAA, FCR, and Gazit states a targeted deal closing date of July 2012. A Few Numbers Relevant To GAA Shareholders; Offer Price Appears To Be At A Discount To Current Book Value (Fully Taxed) – The stated conditional offer price of $7.07 per GAA share represents a substantial 34% premium to the May 4th (pre- announcement) trading price of $5.29/share. Versus GAA’s December 31, 2011 BVPS of $6.21, the premium is a lesser 14%. However, relative to our current estimated BVPS of $7.91, the offer represents an 11% discount. This current BVPS estimate incorporates the sizable increase in the EQY share price since year-end 2011 (it has rallied by US$4.12, to US$21.10 from US$16.98), net of an estimated increase the deferred tax liability. Exhibit 8: Gazit America – BVPS Analysis MTM Est. Current Q4/11A Adj. Fair Value Book Values Per Share: Basic $6.21 $1.70 $7.91 Pre-Tax Basic $7.99 $2.43 $10.43 Deferred Tax Liability: Per Share - Basic $1.79 $0.73 $2.52 Note: Diluted and fully diluted amounts per share are in some instances materially lower, based upon dilutive derivative instruments within GAA’s capital structure. These include 0.9MM share purchase options and outstanding warrants for the purchase of 10.6MM common shares at prices ranging from $5.63/share to $7.50/share. Diluted and fully diluted BVPS figures are available upon request. Source: RBC Capital Markets estimates and Company reports Deferred Income Taxes Complicate The Matter, As They Are Not Usually Taken To Be A “Hard” Liability – GAA’s Q4/11 balance sheet included a deferred tax liability of $41.6 million. Substantially all of this relates to the low tax basis in the EQY shares. And, with the ~US$4 upward move in EQY’s share price since December 31, we estimate that the deferred tax liability has increased by ~$17 million since year-end (to ~$59 million). Ignoring the deferred tax liability (an approach that FCR itself employs when presenting certain figures, such as its implied cap rate) would yield a December 31, 2011 pre-tax BVPS of $7.99 and a current pre-tax BVPS estimate of $10.43. On this basis, the $7.07 offer price equates to a 12% discount to the December 31st value and a 32% discount to the current estimated value. Our book value calculations suggest the special committee has some work to do. Often, the stated value of a deferred tax liability is not taken as a “hard” number in merger and acquisition analysis. Hence, coming to terms with the “economic value” or “present value” of GAA’s deferred tax liability will be one major component of the special committee’s role. And, we believe this will probably be one of the committee’s hard negotiating points. We also believe there will be a myriad of other considerations, both quantitative and qualitative, that relate to the merits of the non-binding offer. Profiling The ProMed Portfolio – The ProMed property portfolio encompasses ~930,000 sf and includes 12 medical office and retail properties with a 50% interest in a 13th property jointly owned with FCR. Many of the properties are located near or adjacent to existing FCR properties. They are geographically dispersed across seven major markets: Calgary, Edmonton, the Greater Toronto Area, London, Kitchener-Waterloo, Ottawa, and the Greater Montreal area. Exhibit 11 on page 8 lists each ProMed property and any adjacent or nearby FCR property. Recent disclosures by GAA suggest 2012 NOI should be ~$14.6 million. Hence, the December 31, 2011 property valuation of ~$218 million would imply a going-in cap rate of ~6.7%. A Good, Complementary Fit With FCR, In Our View – FCR’s business focuses on five core strategies to drive long-term returns for investors: i) proactive asset management and value creation; ii) the acquisition of older urban centers for repositioning and redevelopment; iii) the acquisition of adjacent properties / sites; iv) densification of properties – retail, office, residential; and v) improving the cost of debt and equity. First Capital Realty Inc.May 8, 2012
  • 7. 7 We see the ownership and management of medical office buildings and related healthcare real estate as a natural extension/evolution of FCR’s business model, from being solely a shopping centre owner (manager and developer) to one with mixed-use and other properties. We believe the ProMed portfolio is complementary to FCR’s existing business and that it fits the five strategic criteria on a number of fronts. For instance, nine of the properties are located within close proximity to existing FCR properties (with 12 properties located near a major hospital). FCR Management has noted that four ProMed properties offer redevelopment and intensification opportunities (including the two highlighted below in Exhibit 9). Moreover, we believe ProMed’s overall cost of capital is likely to be reduced if it operates as a wholly owned, yet independently run, operating division within FCR, as opposed to a standalone public company. In keeping with the FCR image and corporate logo, the ProMed business will be re-branded “First Medical” subsequent to the closing of the proposed transaction. Exhibit 9: ProMed Properties That Offer Redevelopment Opportunities Meadowlark Health & Shopping Centre, Edmonton, AB Coronation Medical Centre, Cambridge, ON Source: RBC Capital Markets and Company reports Assuming FCR acquires ProMed, the business will represent approximately 3.9% of FCR’s total GLA of ~24 million sf and approximately 3.6% of its property portfolio, which will have a value in excess of $6 billion. Exhibit 10: Pro-Forma Gross Leasable Area and Portfolio IFRS Value1 GLA (MM, sf) 23 0.93 ProMed FCR IFRS Value ($MMf) 218 5,912 ProMed FCR Notes: 1 IFRS Values as of December 31, 2011 Source: RBC Capital Markets and Company reports First Capital Realty Inc.May 8, 2012
  • 8. 8 Exhibit 11: The ProMed Property Portfolio GAA Acquisition Adjacent or Nearby Property City Province Sq Ft Retail? Floors Cost ($M) FCR Property Adjacent Hospital Meadowlark Health & Shopping Centre* Edmonton Alberta 153,000 Y 1 $42.4 50-50 JV with FCR Kingsway Mews Edmonton Alberta 42,000 Y 1 $9.6 Sunpark Plaza Calgary Alberta 125,000 Y 3 $34.6 South Community Health Centre Westminster Medical Centre* London Ontario 113,000 Y 1 $14.1 Wellington Corners London Health Sciences Centre, Parkwood Hospital London Medical Centre London Ontario 49,000 N 4 Wellington Corners London Health Sciences Centre, Parkwood Hospital Coronation Medical Centre* Cambridge Ontario 68,000 N 1-2 Delta Centre Cambridge Memorial Hospital Belmont Professional Centre Kitchener Ontario 47,000 Y 4 $9.9 Grand River Hospital 71 King Street Mississauga Ontario 49,000 Y 5 $10.2 Trillium Health Centre 1670 Bayview Avenue Toronto Ontario 40,000 Y 5 $12.5 Leaside Village Nepean Medical Centre* Ottawa Ontario 49,000 Y 4 $13.4 College Square Kent Professional Building Ottawa Ontario 42,000 Y 5 $10.7 216 Elgin Street Saint Vincent Hospital 5700 Cote-des-Neiges Montreal Quebec 92,000 Y 6 $25.4 Centre Commercial Van Horne Place Adoncour Longueuil Quebec 61,000 Y 3 $15.0 Place Roland Therrien Hôpital Pierre-Boucher Total 930,000 $214.2 *Redevelopment opportunity Misericordia Community Hospital, Royal Alexandra Hospital, Glenrose Rehabilitation Hospital $16.4 St. Mary's Hospital Centre, Jewish General Hospital ,CHU Sainte-Justine Sunnybrook Health Sciences Centre, Holland & Bloorview Kids Rehab Hospital, Centre for Addiction & Mental Health Source: RBC Capital Markets estimates and company reports First Capital Realty Inc.May 8, 2012
  • 9. 9 Valuation Our $20 price target is derived by applying an 21x multiple to our 2013 AFFO/share estimate. Our target multiple continues to represent a premium to the group average, which we believe is warranted based on First Capital Realty's stable and improving operating results, its value-add business model, and the underlying NAV/share. We rate the shares Outperform, Average Risk. Price Target Impediment Impediments to the achievement of our price objectives relate primarily to the risks associated with ownership of real property, which include (but not limited to): competition for tenants; new supply of competing retail space; general and local economic conditions; interest rate fluctuations; financial strength (credit risk) of tenants; and relative liquidity of real estate assets. As a company exclusively focused upon the ownership/management of retail properties, any factor negatively impacting consumer spending is a risk for FCR. Additionally, retail centres rely on anchor-tenants. Although alternative tenancies exist, a property can be impacted by even the temporary loss of an anchor-tenant. Company Description First Capital Realty Inc ("FCR") is a fully integrated Canadian real estate operating company, with a focus on the ownership, management, acquisition and development of neighbourhood and community shopping centres. Its centres are most commonly anchored by grocery stores, junior department stores or drug stores. As FCR's tenant base provides consumers with goods and services essential to everyday life, the Company's properties are of the type that tends to be weekly destinations for most Canadian households. The company currently owns interests in over 160 properties (including development sites) with approximately 23 million sf of GLA. First Capital Realty Inc.May 8, 2012
  • 10. 10 Required Disclosures Non-U.S. Analyst Disclosure Michael Markidis, Kevin Cheng and Shivalika Handa (i) are not registered/qualified as research analysts with the NYSE and/or FINRA and (ii) may not be associated persons of the RBC Capital Markets, LLC and therefore may not be subject to FINRA Rule 2711 and NYSE Rule 472 restrictions on communications with a subject company, public appearances and trading securities held by a research analyst account. Conflicts Disclosures The analyst(s) responsible for preparing this research report received compensation that is based upon various factors, including total revenues of the member companies of RBC Capital Markets and its affiliates, a portion of which are or have been generated by investment banking activities of the member companies of RBC Capital Markets and its affiliates. A member company of RBC Capital Markets or one of its affiliates managed or co-managed a public offering of securities for First Capital Realty Inc. in the past 12 months. A member company of RBC Capital Markets or one of its affiliates received compensation for investment banking services from First Capital Realty Inc. in the past 12 months. RBC Dominion Securities Inc. makes a market in the securities of First Capital Realty Inc. and may act as principal with regard to sales or purchases of this security. A member company of RBC Capital Markets or one of its affiliates received compensation for products or services other than investment banking services from First Capital Realty Inc. during the past 12 months. During this time, a member company of RBC Capital Markets or one of its affiliates provided non-investment banking securities-related services to First Capital Realty Inc.. A member company of RBC Capital Markets or one of its affiliates received compensation for products or services other than investment banking services from First Capital Realty Inc. during the past 12 months. During this time, a member company of RBC Capital Markets or one of its affiliates provided non-securities services to First Capital Realty Inc.. RBC Capital Markets has provided First Capital Realty Inc. with investment banking services in the past 12 months. RBC Capital Markets has provided First Capital Realty Inc. with non-investment banking securities-related services in the past 12 months. RBC Capital Markets has provided First Capital Realty Inc. with non-securities services in the past 12 months. Research personnel, including the analyst or analyst team responsible for this report or recommendation or any individuals directly involved in the preparation of the report, including their supervisors, hold(s) or exercise(s) investment discretion over a long position in the common shares of First Capital Realty Inc.. The author is employed by RBC Dominion Securities Inc., a securities broker-dealer with principal offices located in Toronto, Canada. Explanation of RBC Capital Markets Equity Rating System An analyst's 'sector' is the universe of companies for which the analyst provides research coverage. Accordingly, the rating assigned to a particular stock represents solely the analyst's view of how that stock will perform over the next 12 months relative to the analyst's sector average. Ratings Top Pick (TP): Represents analyst's best idea in the sector; expected to provide significant absolute total return over 12 months with a favorable risk-reward ratio. Outperform (O): Expected to materially outperform sector average over 12 months. Sector Perform (SP): Returns expected to be in line with sector average over 12 months. Underperform (U): Returns expected to be materially below sector average over 12 months. Risk Qualifiers (any of the following criteria may be present): Average Risk (Avg): Volatility and risk expected to be comparable to sector; average revenue and earnings predictability; no significant cash flow/financing concerns over coming 12-24 months; fairly liquid. Above Average Risk (AA): Volatility and risk expected to be above sector; below average revenue and earnings predictability; may not be suitable for a significant class of individual equity investors; may have negative cash flow; low market cap or float. Speculative (Spec): Risk consistent with venture capital; low public float; potential balance sheet concerns; risk of being delisted. Distribution of Ratings First Capital Realty Inc.May 8, 2012
  • 11. 11 For the purpose of ratings distributions, regulatory rules require member firms to assign ratings to one of three rating categories - Buy, Hold/Neutral, or Sell - regardless of a firm's own rating categories. Although RBC Capital Markets' ratings of Top Pick/Outperform, Sector Perform and Underperform most closely correspond to Buy, Hold/Neutral and Sell, respectively, the meanings are not the same because our ratings are determined on a relative basis (as described above). Distribution of Ratings RBC Capital Markets, Equity Research Investment Banking Serv./Past 12 Mos. Rating Count Percent Count Percent BUY[TP/O] 773 51.77 231 29.88 HOLD[SP] 654 43.80 156 23.85 SELL[U] 66 4.42 3 4.55 Q1 Q2 Q3 Q1 Q2 Q3 Q1 Q2 Q3 Q1 Q2 6 9 12 15 18 21 2010 2011 2012 11/10/09 SP:12.81 01/13/10 SP:14.38 03/01/10 OP:14.38 08/09/10 OP:15 09/03/10 OP:16.25 03/07/11 OP:16.5 05/16/11 OP:17.5 11/10/11 OP:18.5 Rating and Price Target History for: First Capital Realty Inc. as of 05-07-2012 (in CAD) Legend: TP: Top Pick; O: Outperform; SP: Sector Perform; U: Underperform; I: Initiation of Research Coverage; D: Discontinuation of Research Coverage; NR: Not Rated; NA: Not Available; RL: Recommended List - RL: On: Refers to date a security was placed on a recommended list, while RL Off: Refers to date a security was removed from a recommended list. Created by BlueMatrix References to a Recommended List in the recommendation history chart may include one or more recommended lists or model portfolios maintained by a business unit of the Wealth Management Division of RBC Capital Markets, LLC. These Recommended Lists include a former list called the Prime Opportunity List (RL 3), the Guided Portfolio: Prime Income (RL 6), the Guided Portfolio: Large Cap (RL 7), Guided Portfolio: Dividend Growth (RL 8), the Guided Portfolio: Midcap 111 (RL9), and the Guided Portfolio: ADR (RL 10). The abbreviation 'RL On' means the date a security was placed on a Recommended List. The abbreviation 'RL Off' means the date a security was removed from a Recommended List. Conflicts Policy RBC Capital Markets Policy for Managing Conflicts of Interest in Relation to Investment Research is available from us on request. To access our current policy, clients should refer to https://www.rbccm.com/global/file-414164.pdf or send a request to RBC CM Research Publishing, P.O. Box 50, 200 Bay Street, Royal Bank Plaza, 29th Floor, South Tower, Toronto, Ontario M5J 2W7. We reserve the right to amend or supplement this policy at any time. Dissemination of Research and Short-Term Trade Ideas RBC Capital Markets endeavors to make all reasonable efforts to provide research simultaneously to all eligible clients, having regard to local time zones in overseas jurisdictions. RBC Capital Markets' research is posted to our proprietary websites to ensure eligible clients receive coverage initiations and changes in ratings, targets and opinions in a timely manner. Additional distribution may be done by the sales personnel via email, fax or regular mail. Clients may also receive our research via third-party vendors. Please contact your investment advisor or institutional salesperson for more information regarding RBC Capital Markets' research. RBC Capital Markets also provides eligible clients with access to SPARC on its proprietary INSIGHT website. SPARC contains market color and commentary, and may also contain Short-Term Trade Ideas regarding the securities of subject companies discussed in this or other First Capital Realty Inc.May 8, 2012
  • 12. 12 research reports. SPARC may be accessed via the following hyperlink: https://www.rbcinsight.com. A Short-Term Trade Idea reflects the research analyst's directional view regarding the price of the security of a subject company in the coming days or weeks, based on market and trading events. A Short-Term Trade Idea may differ from the price targets and/or recommendations in our published research reports reflecting the research analyst's views of the longer-term (one year) prospects of the subject company, as a result of the differing time horizons, methodologies and/or other factors. Thus, it is possible that the security of a subject company that is considered a long-term 'Sector Perform' or even an 'Underperform' might be a short-term buying opportunity as a result of temporary selling pressure in the market; conversely, the security of a subject company that is rated a long-term 'Outperform' could be considered susceptible to a short-term downward price correction. Short-Term Trade Ideas are not ratings, nor are they part of any ratings system, and RBC Capital Markets generally does not intend, nor undertakes any obligation, to maintain or update Short-Term Trade Ideas. Short-Term Trade Ideas discussed in SPARC may not be suitable for all investors and have not been tailored to individual investor circumstances and objectives, and investors should make their own independent decisions regarding any Short-Term Trade Ideas discussed therein. Analyst Certification All of the views expressed in this report accurately reflect the personal views of the responsible analyst(s) about any and all of the subject securities or issuers. No part of the compensation of the responsible analyst(s) named herein is, or will be, directly or indirectly, related to the specific recommendations or views expressed by the responsible analyst(s) in this report. Disclaimer RBC Capital Markets is the business name used by certain branches and subsidiaries of the Royal Bank of Canada, including RBC Dominion Securities Inc., RBC Capital Markets, LLC, RBC Europe Limited, RBC Capital Markets (Hong Kong) Limited, Royal Bank of Canada, Hong Kong Branch and Royal Bank of Canada, Sydney Branch. The information contained in this report has been compiled by RBC Capital Markets from sources believed to be reliable, but no representation or warranty, express or implied, is made by Royal Bank of Canada, RBC Capital Markets, its affiliates or any other person as to its accuracy, completeness or correctness. All opinions and estimates contained in this report constitute RBC Capital Markets' judgement as of the date of this report, are subject to change without notice and are provided in good faith but without legal responsibility. Nothing in this report constitutes legal, accounting or tax advice or individually tailored investment advice. This material is prepared for general circulation to clients and has been prepared without regard to the individual financial circumstances and objectives of persons who receive it. The investments or services contained in this report may not be suitable for you and it is recommended that you consult an independent investment advisor if you are in doubt about the suitability of such investments or services. This report is not an offer to sell or a solicitation of an offer to buy any securities. Past performance is not a guide to future performance, future returns are not guaranteed, and a loss of original capital may occur. RBC Capital Markets research analyst compensation is based in part on the overall profitability of RBC Capital Markets, which includes profits attributable to investment banking revenues. Every province in Canada, state in the U.S., and most countries throughout the world have their own laws regulating the types of securities and other investment products which may be offered to their residents, as well as the process for doing so. As a result, the securities discussed in this report may not be eligible for sale in some jurisdictions. This report is not, and under no circumstances should be construed as, a solicitation to act as securities broker or dealer in any jurisdiction by any person or company that is not legally permitted to carry on the business of a securities broker or dealer in that jurisdiction. To the full extent permitted by law neither RBC Capital Markets nor any of its affiliates, nor any other person, accepts any liability whatsoever for any direct or consequential loss arising from any use of this report or the information contained herein. No matter contained in this document may be reproduced or copied by any means without the prior consent of RBC Capital Markets. Additional information is available on request. To U.S. Residents: This publication has been approved by RBC Capital Markets, LLC (member FINRA, NYSE, SIPC), which is a U.S. registered broker-dealer and which accepts responsibility for this report and its dissemination in the United States. Any U.S. recipient of this report that is not a registered broker-dealer or a bank acting in a broker or dealer capacity and that wishes further information regarding, or to effect any transaction in, any of the securities discussed in this report, should contact and place orders with RBC Capital Markets, LLC. To Canadian Residents: This publication has been approved by RBC Dominion Securities Inc.(member IIROC). Any Canadian recipient of this report that is not a Designated Institution in Ontario, an Accredited Investor in British Columbia or Alberta or a Sophisticated Purchaser in Quebec (or similar permitted purchaser in any other province) and that wishes further information regarding, or to effect any transaction in, any of the securities discussed in this report should contact and place orders with RBC Dominion Securities Inc., which, without in any way limiting the foregoing, accepts responsibility for this report and its dissemination in Canada. To U.K. Residents: This publication has been approved by RBC Europe Limited ('RBCEL') which is authorized and regulated by Financial Services Authority ('FSA'), in connection with its distribution in the United Kingdom. This material is not for general distribution in the United Kingdom to retail clients, as defined under the rules of the FSA. However, targeted distribution may be made to selected retail clients of RBC and its affiliates. RBCEL accepts responsibility for this report and its dissemination in the United Kingdom. To Persons Receiving This Advice in Australia: This material has been distributed in Australia by Royal Bank of Canada - Sydney Branch (ABN 86 076 940 880, AFSL No. 246521). This material has been prepared for general circulation and does not take into account the objectives, financial situation or needs of any recipient. Accordingly, any recipient should, before acting on this material, consider the appropriateness of this material having regard to their objectives, financial situation and needs. If this material relates to the acquisition or possible acquisition of a particular financial product, a recipient in Australia should obtain any relevant disclosure document prepared in respect of that product and consider that document before making any decision about whether to acquire the product. To Hong Kong Residents: This publication is distributed in Hong Kong by RBC Investment Services (Asia) Limited, RBC Investment Management (Asia) Limited and RBC Capital Markets (Hong Kong) Limited, licensed corporations under the Securities and Futures Ordinance or, by the Royal Bank of Canada, Hong Kong Branch, a registered institution under the Securities and Futures Ordinance. This material has been prepared for general circulation and does not take into account the objectives, financial situation, or needs of any recipient. Hong Kong persons wishing to obtain further information on any of the securities mentioned in this publication should contact RBC Investment Services (Asia) Limited, RBC Investment Management (Asia) Limited, RBC Capital Markets (Hong Kong) Limited or Royal Bank of Canada, Hong Kong Branch at 17/Floor, Cheung Kong Center, 2 Queen's Road Central, Hong Kong (telephone number is 2848-1388). To Singapore Residents: This publication is distributed in Singapore by the Royal Bank of Canada, Singapore Branch and Royal Bank of Canada (Asia) Limited, registered entities granted offshore bank and merchant bank status by the Monetary Authority of Singapore, respectively. This material has been prepared for general circulation and does not take into account the objectives, financial situation, or needs of any recipient. You are advised to seek independent advice from a financial adviser before purchasing any First Capital Realty Inc.May 8, 2012
  • 13. 13 product. If you do not obtain independent advice, you should consider whether the product is suitable for you. Past performance is not indicative of future performance. If you have any questions related to this publication, please contact the Royal Bank of Canada, Singapore Branch or Royal Bank of Canada (Asia) Limited. To Japanese Residents: Unless otherwise exempted by Japanese law, this publication is distributed in Japan by or through RBC Capital Markets (Japan) Ltd., a registered type one financial instruments firm and/or Royal Bank of Canada, Tokyo Branch, a licensed foreign bank. .® Registered trademark of Royal Bank of Canada. RBC Capital Markets is a trademark of Royal Bank of Canada. Used under license. Copyright © RBC Capital Markets, LLC 2012 - Member SIPC Copyright © RBC Dominion Securities Inc. 2012 - Member CIPF Copyright © RBC Europe Limited 2012 Copyright © Royal Bank of Canada 2012 All rights reserved First Capital Realty Inc.May 8, 2012