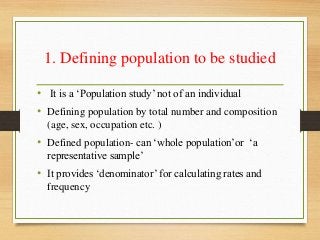
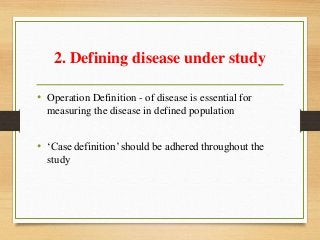
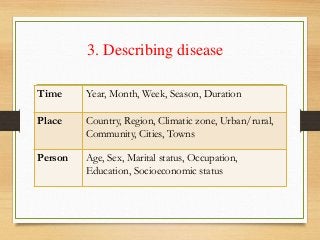
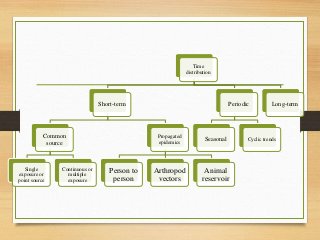
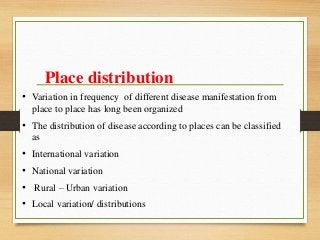
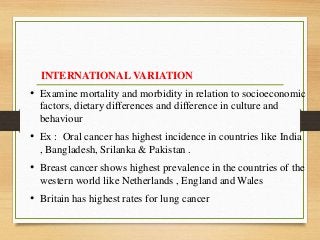
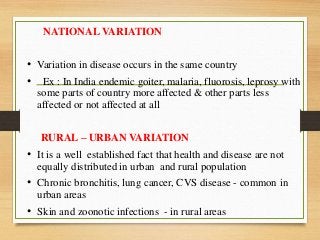
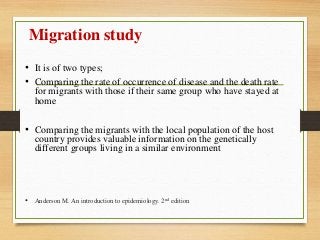
This document provides an overview of epidemiology including its definition, history, aims, tools of measurement, and study designs. Some key points:
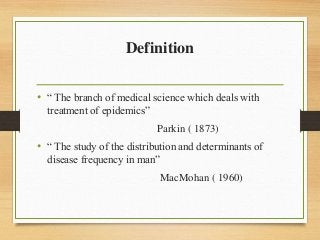
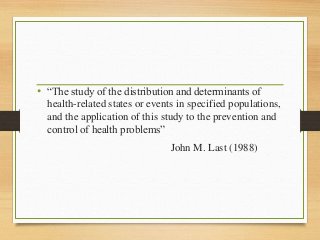
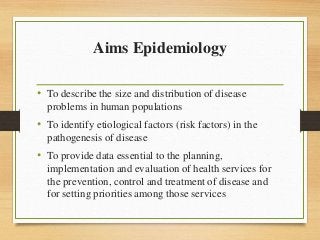
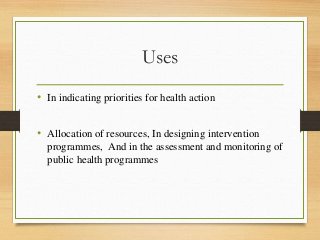
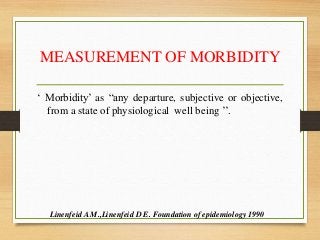
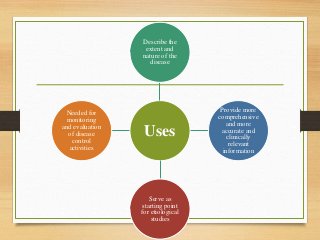
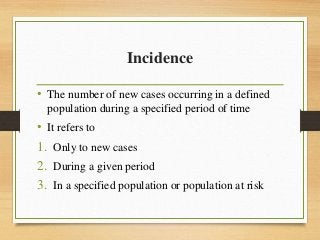
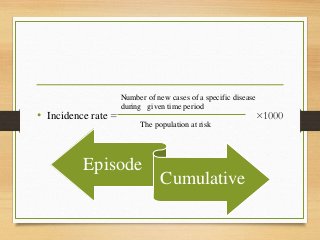
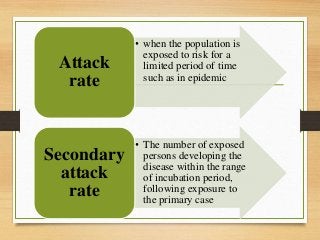
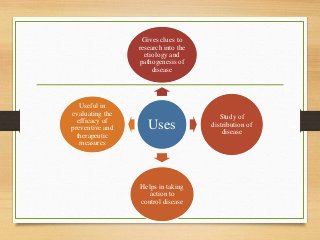
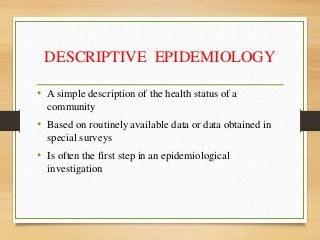
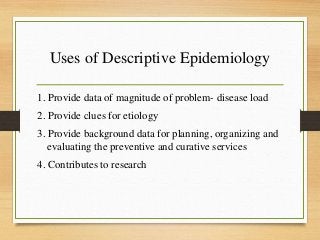
- Epidemiology is the study of disease distribution and determinants in populations and its application to disease control and prevention. It aims to describe disease problems, identify risk factors, and provide data to plan and evaluate health services.
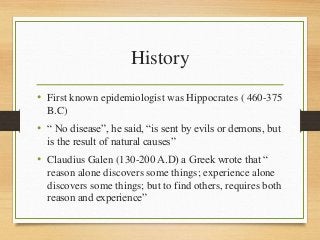
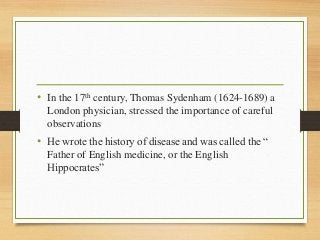
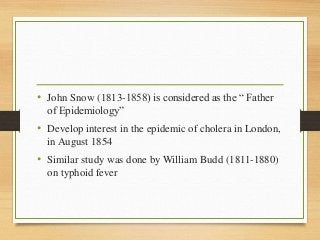
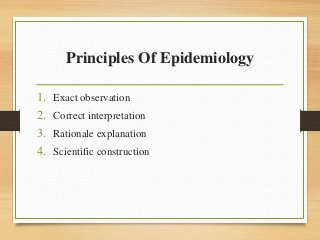
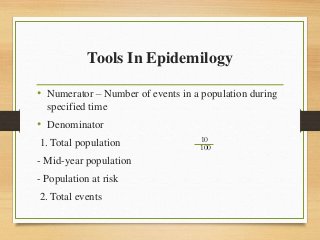
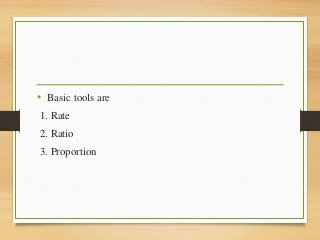
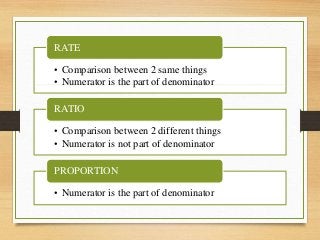
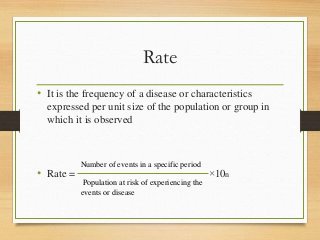
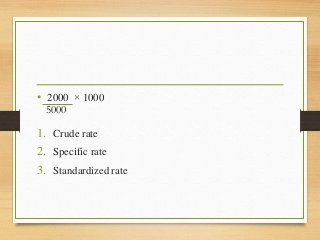
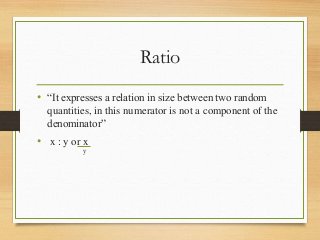
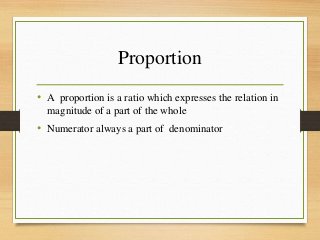
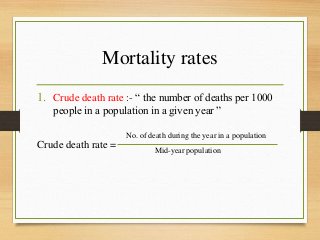
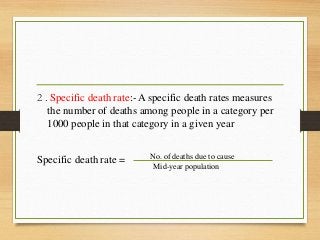
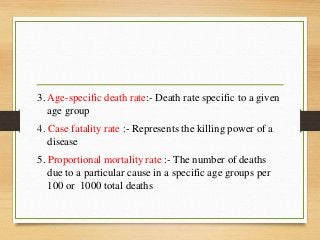
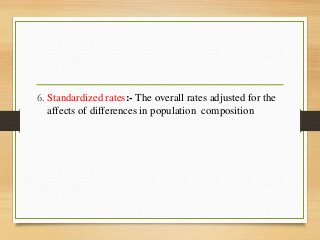
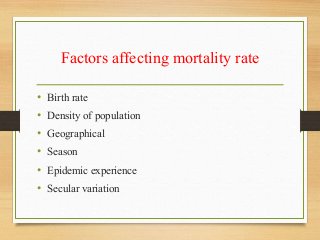
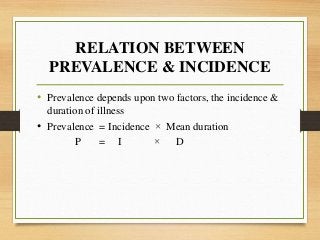
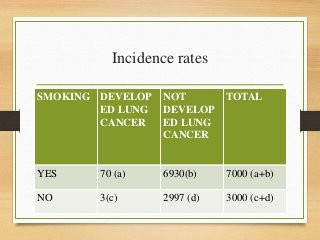
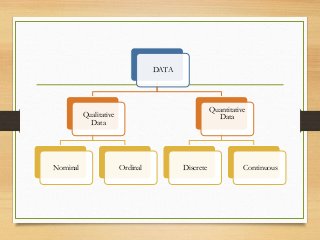
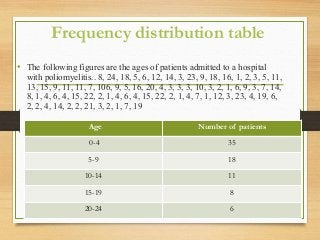
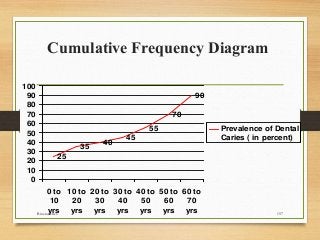
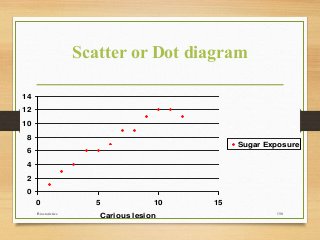
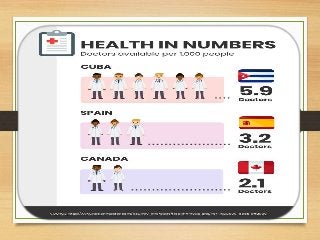
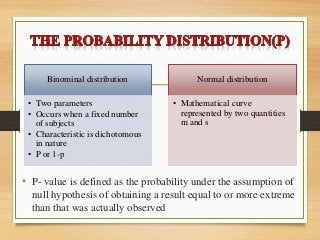
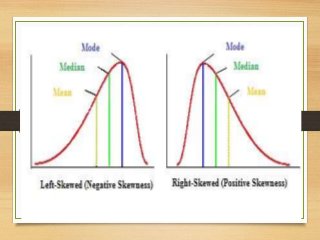
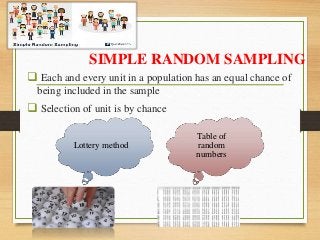
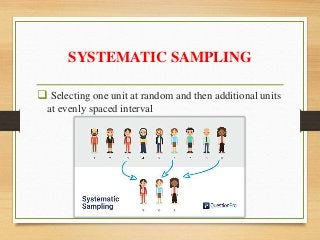
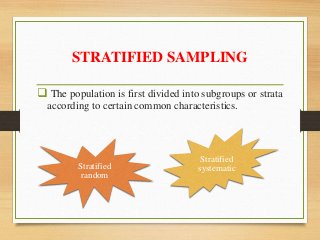
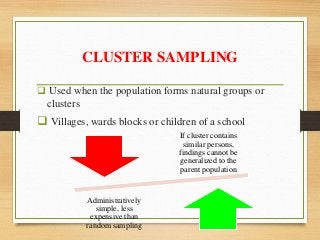
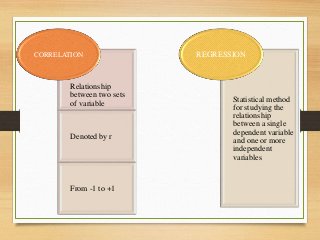
- Important historical figures include Hippocrates, Galen, Sydenham, and John Snow, considered the "Father of Epidemiology" for his cholera studies. Measurement tools include rates, ratios, and proportions to compare disease frequency.
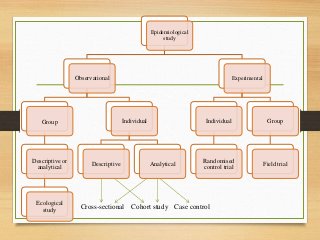
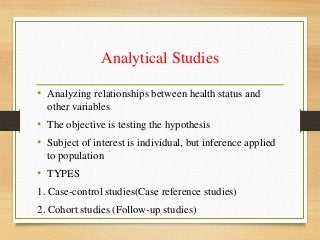
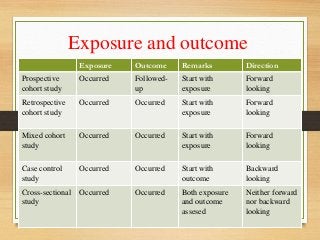
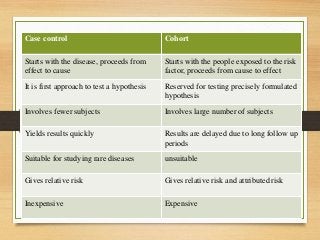
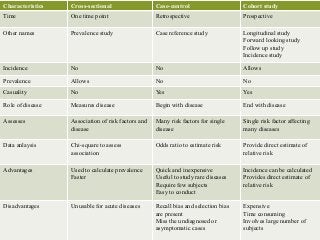
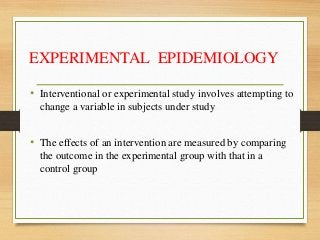
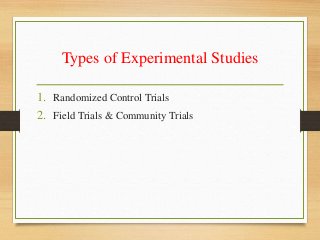
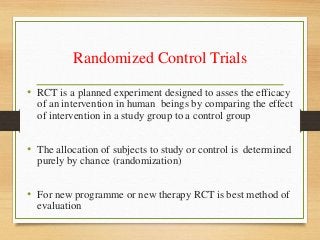
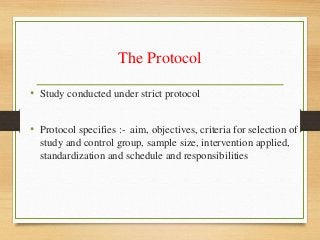
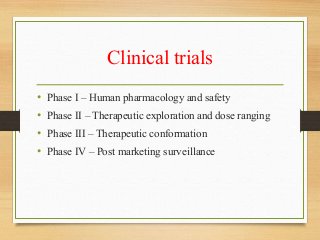
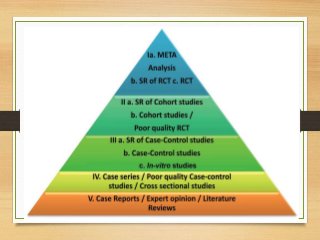
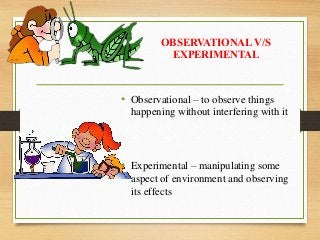
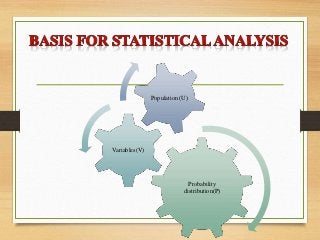
- Major epidemiological study designs are observational (descriptive, analytical) and experimental (


![Tools of dental_public_health[1]](https://cdn.slidesharecdn.com/ss_thumbnails/toolsofdentalpublichealth1-151108134342-lva1-app6891-thumbnail.jpg?width=640&height=640&fit=bounds)


![Epidemiological Mehods [Autosaved].pptx](https://cdn.slidesharecdn.com/ss_thumbnails/epidemiologicalmehodsautosaved-220801131722-24a0478e-thumbnail.jpg?width=640&height=640&fit=bounds)


