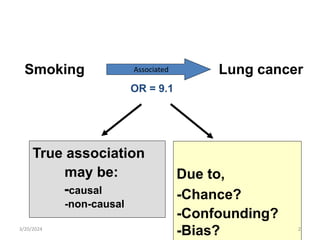
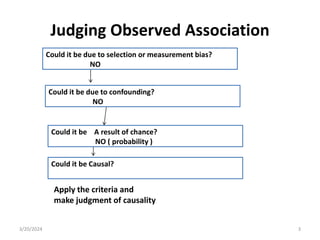
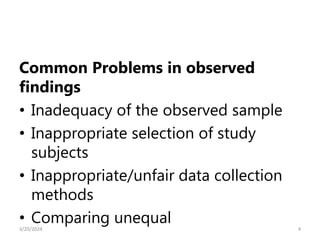
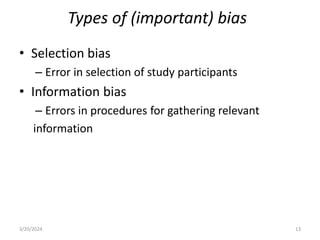
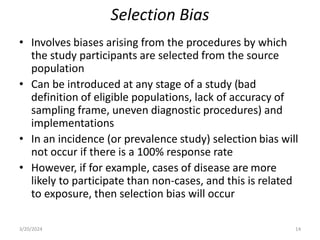
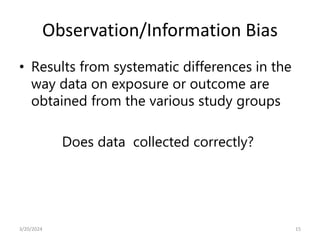
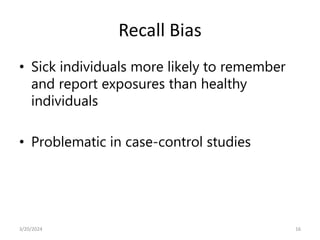
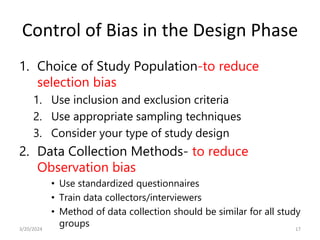
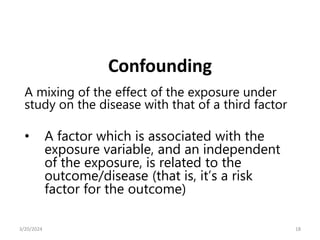
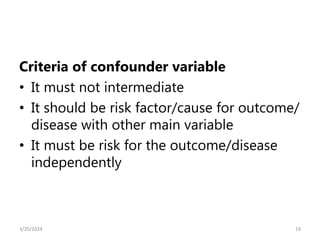
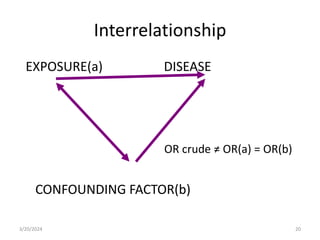
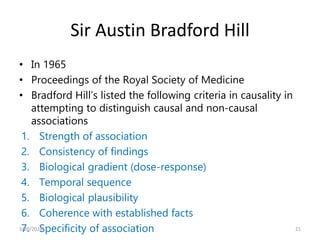
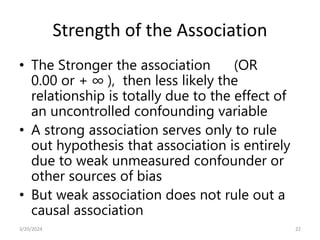
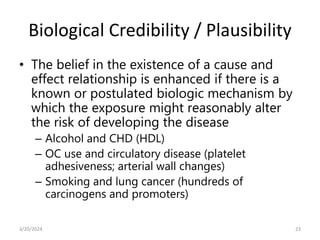
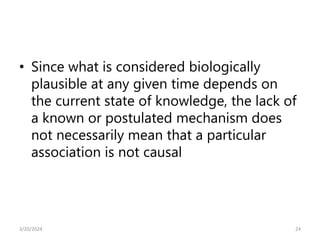
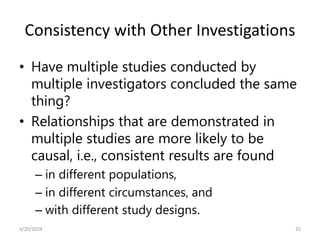
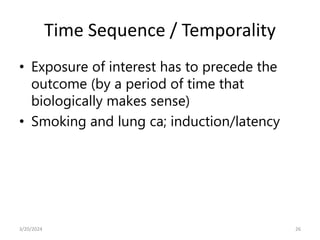
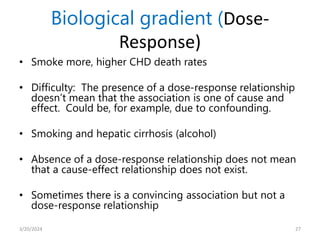
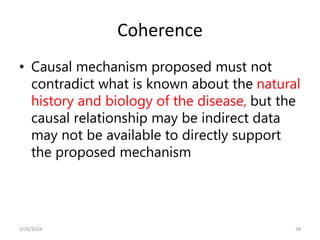
2. Smoking Lung cancer
Associated
OR = 9.1
Due to,
-Chance?
-Confounding?
-Bias?
True association
may be:
-causal
-non-causal
2
3/20/2024
3. Judging Observed Association
Apply the criteria and
make judgment of causality
3
Could it be due to selection or measurement bias?
NO
Could it be due to confounding?
NO
Could it be A result of chance?
NO ( probability )
Could it be Causal?
3/20/2024
4. Common Problems in observed
findings
• Inadequacy of the observed sample
• Inappropriate selection of study
subjects
• Inappropriate/unfair data collection
methods
• Comparing unequal 4
3/20/2024
5. Accuracy
• Accuracy = Validity + Precision
.Validity= is the finding a reflection of the
truth?
. Precision= is the finding due to sampling
variation?
. reliability = is the finding an indication of
the same result of different rater ?
5
3/20/2024
7. Precision
• Precision in measurement and estimation
corresponds to the reduction of random error.
• Mostly related to sampling variation or
sampling error.
Solution:
• Increase sample size
• Improving the efficiency of measurement.
7
3/20/2024
8. Validity
• Internal: are we measuring what we intend to
measure
Do we have alternative explanations for the
observed findings:
• Chance
• Bias
• Confounding
• External (generalizability) : can we make
inferences beyond the subjects of the study
8
3/20/2024
9. Chance/random error
• Chance can often be an alternative explanation
to observed findings must always be
considered.
• Evaluation of chance is a domain of statistics
involving:
1. Hypothesis Testing (Test of Statistical
Significance)
2. Estimation of Confidence Interval
• But , Statistical significance do not provide
information on bias and uncontrolled
confounding. 9
3/20/2024
10. P-value ≤ 0.05 Chance is unlikely
explanation
• ∴ Reject the null hypothesis
• ∴ There is Statistically significant difference
• Accept alternative hypothesis
Confidence Interval
• Provide information that p-value gives.
– If null value is included in a 95% confidence
interval, by definition the corresponding P-
value is >0.05. so , it is not significant
10
3/20/2024
11. Definition of bias
Any systematic error in an epidemiological
study, that results in an incorrect estimate of the
association between exposure and risk of disease
•An alternative explanation for an observed
association is the possibility that some aspect of
the design or conduct of a study has introduced
a bias into the results.
11
3/20/2024
12. Bias
• Unlike “chance” and “confounding,” which can be
evaluated quantitatively, the effects of bias are far
more difficult to evaluate and may even be
impossible to take into account in the analysis.
General class of Bias
Selection Observation
bias (Information)
bias
12
3/20/2024
13. Types of (important) bias
• Selection bias
– Error in selection of study participants
• Information bias
– Errors in procedures for gathering relevant
information
3/20/2024 13
14. Selection Bias
• Involves biases arising from the procedures by which
the study participants are selected from the source
population
• Can be introduced at any stage of a study (bad
definition of eligible populations, lack of accuracy of
sampling frame, uneven diagnostic procedures) and
implementations
• In an incidence (or prevalence study) selection bias will
not occur if there is a 100% response rate
• However, if for example, cases of disease are more
likely to participate than non-cases, and this is related
to exposure, then selection bias will occur
3/20/2024 14
15. Observation/Information Bias
• Results from systematic differences in the
way data on exposure or outcome are
obtained from the various study groups
Does data collected correctly?
15
3/20/2024
16. Recall Bias
• Sick individuals more likely to remember
and report exposures than healthy
individuals
• Problematic in case-control studies
16
3/20/2024
17. Control of Bias in the Design Phase
1. Choice of Study Population-to reduce
selection bias
1. Use inclusion and exclusion criteria
2. Use appropriate sampling techniques
3. Consider your type of study design
2. Data Collection Methods- to reduce
Observation bias
• Use standardized questionnaires
• Train data collectors/interviewers
• Method of data collection should be similar for all study
groups 17
3/20/2024
18. A mixing of the effect of the exposure under
study on the disease with that of a third factor
• A factor which is associated with the
exposure variable, and an independent
of the exposure, is related to the
outcome/disease (that is, it’s a risk
factor for the outcome)
Confounding
18
3/20/2024
19. Criteria of confounder variable
• It must not intermediate
• It should be risk factor/cause for outcome/
disease with other main variable
• It must be risk for the outcome/disease
independently
19
3/20/2024
21. Sir Austin Bradford Hill
• In 1965
• Proceedings of the Royal Society of Medicine
• Bradford Hill’s listed the following criteria in causality in
attempting to distinguish causal and non-causal
associations
1. Strength of association
2. Consistency of findings
3. Biological gradient (dose-response)
4. Temporal sequence
5. Biological plausibility
6. Coherence with established facts
7. Specificity of association 21
3/20/2024
22. Strength of the Association
• The Stronger the association (OR
0.00 or + ∞ ), then less likely the
relationship is totally due to the effect of
an uncontrolled confounding variable
• A strong association serves only to rule
out hypothesis that association is entirely
due to weak unmeasured confounder or
other sources of bias
• But weak association does not rule out a
causal association
22
3/20/2024
23. Biological Credibility / Plausibility
• The belief in the existence of a cause and
effect relationship is enhanced if there is a
known or postulated biologic mechanism by
which the exposure might reasonably alter
the risk of developing the disease
– Alcohol and CHD (HDL)
– OC use and circulatory disease (platelet
adhesiveness; arterial wall changes)
– Smoking and lung cancer (hundreds of
carcinogens and promoters)
23
3/20/2024
24. • Since what is considered biologically
plausible at any given time depends on
the current state of knowledge, the lack of
a known or postulated mechanism does
not necessarily mean that a particular
association is not causal
24
3/20/2024
25. Consistency with Other Investigations
• Have multiple studies conducted by
multiple investigators concluded the same
thing?
• Relationships that are demonstrated in
multiple studies are more likely to be
causal, i.e., consistent results are found
– in different populations,
– in different circumstances, and
– with different study designs.
25
3/20/2024
26. Time Sequence / Temporality
• Exposure of interest has to precede the
outcome (by a period of time that
biologically makes sense)
• Smoking and lung ca; induction/latency
26
3/20/2024
27. Biological gradient (Dose-
Response)
• Smoke more, higher CHD death rates
• Difficulty: The presence of a dose-response relationship
doesn’t mean that the association is one of cause and
effect. Could be, for example, due to confounding.
• Smoking and hepatic cirrhosis (alcohol)
• Absence of a dose-response relationship does not mean
that a cause-effect relationship does not exist.
• Sometimes there is a convincing association but not a
dose-response relationship
27
3/20/2024
28. Coherence
• Causal mechanism proposed must not
contradict what is known about the natural
history and biology of the disease, but the
causal relationship may be indirect data
may not be available to directly support
the proposed mechanism
28
3/20/2024