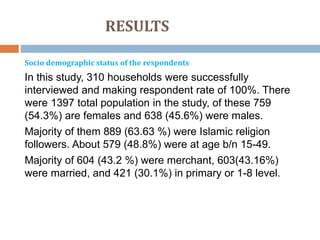
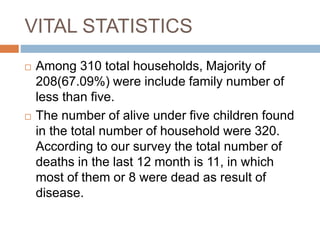
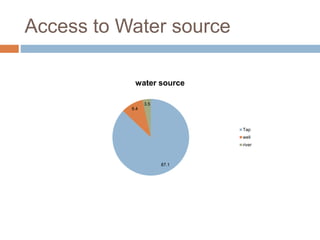
This document summarizes a community health assessment conducted in Butajira, Ethiopia from July 1-29, 2022. The assessment aimed to identify, prioritize, and intervene on health issues affecting the local community. A total of 1,397 individuals across 310 households participated in the study. Key findings included the socio-demographic characteristics of respondents, vital statistics on births and deaths, environmental conditions, water and sanitation access, and maternal and child health indicators. The results will be used to inform local health planning and identify areas for further research and intervention.

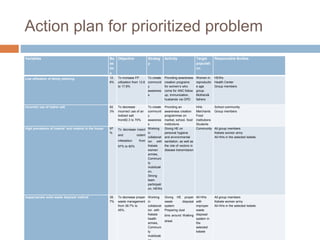
![Sample Size determination
The sample size was determined by using a formula
for estimating a single population proportion assuming
confidence level of 95%, 5% marginal error with
proportion of 73.9% (proportion of modern
contraceptive users among family planning users in
hosanna town southern Ethiopia)[31] and 5%
allowance for non-respondent rate.
Where,
P =73.9%
d=marginal error of 5%=0.05.
Z=confidence interval of 95% and Zα/2 is the value of
the standard normal distribution corresponding to a
significance level of alpha (α) 0.05, which is 1.96.](https://image.slidesharecdn.com/powerpointttpbutajira-231221124340-56675b23/85/Power-point-TTP-Butajira-pptx-16-320.jpg)


![PERI-PROSTHETIC FRACTURE NAIL-PLATE CONSTRUCT [NPC].pptx](https://cdn.slidesharecdn.com/ss_thumbnails/drarunkumardrmohamedashrafperiprostheticfrasturenail-plateconstructnpc-260209164459-7e9d15a1-thumbnail.jpg?width=640&height=640&fit=bounds)


![ONFH[AVN HIP] -TRIPLE REGIME -A NOVAL SURGICAL CONCEPT .pptx](https://cdn.slidesharecdn.com/ss_thumbnails/onfhavnhip2026koaconcalicutdrgokuldevdrmashraf-260210064517-213ec005-thumbnail.jpg?width=640&height=640&fit=bounds)
