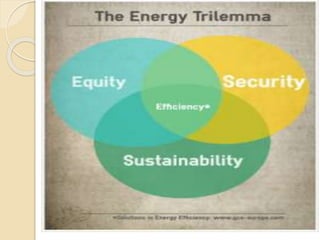
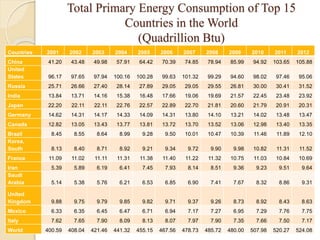
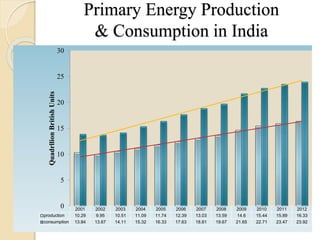
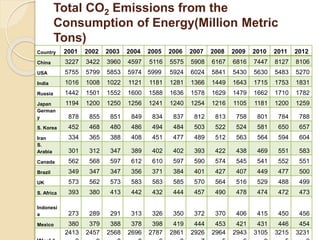
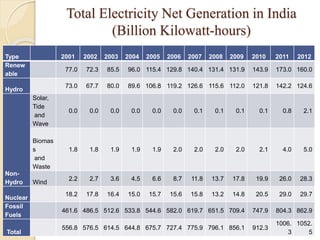
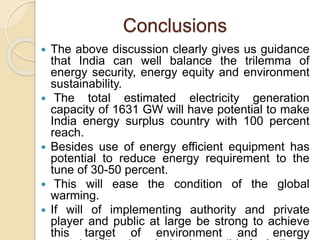
Environment and Energy Sustainability:
Mission Possible for India
By:
Dr. Manoj Kumar
Associate Professor, GCCBA, Chandigarh
Sustainability: Definition
 Sustainability could be defined as an
ability or capacity of something to be
maintained or to sustain itself. It’s
about taking what we need to live now,
without jeopardising the potential for
people in the future to meet their
needs (Land Learn NSW)
We all want this to Happen
 "China will overtake the US to become
the world's largest economy by 2020,
which in turn will be overtaken by India
in 2050," according to Wealth Report
2012 by Knight Frank & Citi Private
Bank.
Objectives of the Study
 The paper tries to address following
objectives the country need to address for its
environment and energy sustainability:
 To know the total primary energy
consumption of India and some other
countries in the world.
 To know the current position and future
trend of CO2 emission in India and some
selected countries of the world.
 To know the present position of electricity
production mix and its future trends in India.
 To suggest measure for environment and
energy sustainability in India.
Total Primary Energy Consumption of Top 15
Countries in the World
(Quadrillion Btu)
Countries 2001 2002 2003 2004 2005 2006 2007 2008 2009 2010 2011 2012
China 41.20 43.48 49.98 57.91 64.42 70.39 74.85 78.94 85.99 94.92 103.65 105.88
United
States 96.17 97.65 97.94 100.16 100.28 99.63 101.32 99.29 94.60 98.02 97.46 95.06
Russia 25.71 26.66 27.40 28.14 27.89 29.05 29.05 29.55 26.81 30.00 30.41 31.52
India 13.84 13.71 14.16 15.38 16.48 17.66 19.06 19.69 21.57 22.45 23.48 23.92
Japan 22.20 22.11 22.11 22.76 22.57 22.89 22.70 21.81 20.60 21.79 20.91 20.31
Germany 14.62 14.31 14.17 14.33 14.09 14.31 13.80 14.10 13.21 14.02 13.48 13.47
Canada 12.82 13.05 13.43 13.77 13.81 13.72 13.70 13.52 13.06 12.98 13.40 13.35
Brazil 8.45 8.55 8.64 8.99 9.28 9.50 10.01 10.47 10.39 11.46 11.89 12.10
Korea,
South 8.13 8.40 8.71 8.92 9.21 9.34 9.72 9.90 9.98 10.82 11.31 11.52
France 11.09 11.02 11.11 11.31 11.38 11.40 11.22 11.32 10.75 11.03 10.84 10.69
Iran 5.39 5.89 6.19 6.41 7.45 7.93 8.14 8.51 9.36 9.23 9.51 9.64
Saudi
Arabia 5.14 5.38 5.76 6.21 6.53 6.85 6.90 7.41 7.67 8.32 8.86 9.31
United
Kingdom 9.88 9.75 9.79 9.85 9.82 9.71 9.37 9.26 8.73 8.92 8.43 8.63
Mexico 6.33 6.35 6.45 6.47 6.71 6.94 7.17 7.27 6.95 7.29 7.76 7.75
Italy 7.62 7.65 7.90 8.09 8.13 8.07 7.97 7.90 7.35 7.66 7.50 7.17
World 400.59 408.04 421.46 441.32 455.15 467.56 478.73 485.72 480.00 507.98 520.27 524.08
Primary Energy Production
& Consumption in India
2001 2002 2003 2004 2005 2006 2007 2008 2009 2010 2011 2012
production 10.29 9.95 10.51 11.09 11.74 12.39 13.03 13.59 14.6 15.44 15.89 16.33
consumption 13.84 13.67 14.11 15.32 16.33 17.63 18.81 19.67 21.65 22.71 23.47 23.92
0
5
10
15
20
25
30QuadrllionBritishUnits
Total CO2 Emissions from the
Consumption of Energy(Million Metric
Tons)
Country 2001 2002 2003 2004 2005 2006 2007 2008 2009 2010 2011 2012
China 3227 3422 3960 4597 5116 5575 5908 6167 6816 7447 8127 8106
USA 5755 5799 5853 5974 5999 5924 6024 5841 5430 5630 5483 5270
India 1016 1008 1022 1121 1181 1281 1366 1449 1643 1715 1753 1831
Russia 1442 1501 1552 1600 1588 1636 1578 1629 1479 1662 1710 1782
Japan 1194 1200 1250 1256 1241 1240 1254 1216 1105 1181 1200 1259
German
y 878 855 851 849 834 837 812 813 758 801 784 788
S. Korea 452 468 480 486 494 484 503 522 524 581 650 657
Iran 334 365 388 408 451 477 489 512 563 564 594 604
S.
Arabia 301 312 347 389 402 402 393 422 438 469 551 583
Canada 562 568 597 612 610 597 590 574 545 541 552 551
Brazil 349 347 347 356 371 384 401 427 407 449 477 500
UK 573 562 573 583 583 585 570 564 516 529 488 499
S. Africa 393 380 413 442 432 444 457 490 478 474 472 473
Indonesi
a 273 289 291 313 326 350 372 370 406 415 450 456
Mexico 380 379 388 378 398 419 444 453 421 431 446 454
2413 2457 2568 2696 2787 2861 2926 2964 2943 3105 3215 3231
Total Electricity Net Generation in India
(Billion Kilowatt-hours)
Type 2001 2002 2003 2004 2005 2006 2007 2008 2009 2010 2011 2012
Renew
able
77.0 72.3 85.5 96.0 115.4 129.8 140.4 131.4 131.9 143.9 173.0 160.0
Hydro
73.0 67.7 80.0 89.6 106.8 119.2 126.6 115.6 112.0 121.8 142.2 124.6
Non-
Hydro
Solar,
Tide
and
Wave
0.0 0.0 0.0 0.0 0.0 0.0 0.1 0.1 0.1 0.1 0.8 2.1
Biomas
s
and
Waste
1.8 1.8 1.9 1.9 1.9 2.0 2.0 2.0 2.0 2.1 4.0 5.0
Wind
2.2 2.7 3.6 4.5 6.6 8.7 11.8 13.7 17.8 19.9 26.0 28.3
Nuclear
18.2 17.8 16.4 15.0 15.7 15.6 15.8 13.2 14.8 20.5 29.0 29.7
Fossil
Fuels
461.6 486.5 512.6 533.8 544.6 582.0 619.7 651.5 709.4 747.9 804.3 862.9
Total
556.8 576.5 614.5 644.8 675.7 727.4 775.9 796.1 856.1 912.3
1006.
3
1052.
5
Coal Based Thermal Power Generation
 Despite its abundant reserves of about 286 billion tons, the world’s fifth-largest
according to BP PLC, coal production in India has failed to keep pace with demand from
utilities for several years now, leading to chronic power shortages that have crimped
economic growth. (The Hindustan Times, 2013).
 India needs to develop its own coal blocks as well as invest heavily in the coal mines
in Australia, Mongolia, Indonesia and Russia to get coal for its industries in the times to
come.
 Indian companies are doing it to avoid the situation of coal shortage by cancellations
of allotment of coal blocks.
 India is expected to add more than 1,03,000 MW clean coal technology-based power
generation capacity during the 2016-2025 period, says a report by Global Data
Consulting (Guneet, 2015).
 Country’s clean coal installations are at nascent stage, many recent ultra-mega power
projects have adopted “super critical technology” that is more efficient technology,
therefore help arrest GHG emission.
 Some of the old thermal power plants have to be decommissioned due to expiry of
their useful life.
 We need to continue with the same pace to increase thermal power generation
capacity with improvement in technology.
Solar Power Generation Capacity
 India is blessed with good solar insolation throughout the year in most of its
parts. Regions receiving Global insolation of 5KWh/m2 per day and above can
generate at least 77W/m2 (on actual onsite basis) at 16% efficiency level.
Hence, even 0.1% of the land area of the identified solar hotspot (1897.55 Km2)
could deliver nearly 146 GW of SPV based electricity (379 Billion units)
considering 2600 hours of sunshine annually. This power capacity would
enhance considerably with improvement in the efficiency of SPV technology
(T.V.Ramachandra, 2011).
 Besides rooftop SPV both grid-connected and isolated have potential to
generate 127 GW if only 10m2 SPV is installed on 50% of 330 million houses
in India. Though, it will take time to have social acceptability yet we can save
reduce GHG emission substantially. With such a tremendous scale of SPV
installation the technology will become very cheap as we have no dearth of
silicon in our country that is used in manufacturing of SPV cells.
What We are Doing
 Government of India, Ministry of Power has set a target of generating 1,75,000
MW from renewable energy sources by 2022.
 Out of this, lion's share of 1,00,000 MW will come from solar power, 60,000
MW from wind, 10,000 MW from biomass and the remaining 5,000 MW from
small hydro projects (The Economic Times, 2015).
 If this target can be achieved then we can think of adding 700GW of new
renewable electricity generation facilities from 2022-50 with the same pace.
 If with proper R&D we could increase the efficiency to 50% the total power
generation will increase to the tune of 6500-7000 Billion units per annum from
renewable source only.
 Big hydropower projects has potential of adding 40000 MW of new capacity by
2050.
 Hydroelectric power is said to be the cheapest source of power as well as zero
GHG emission after installations.
Our Sagar-Manthan
 Energy potential of our seas and oceans well exceeds our present
energy needs.
 India has long coastline with estuaries and gulfs where tides are
strong enough to move turbine for electric power generation.
 A variety of different technologies are currently under
development throughout the world to harness this energy in all its
forms including waves (40000 MW), tides (9000 MW) and thermal
gradients (180000 MW).
 Development is currently limited but the sector has potential to
grow.
 If 50% of this initial potential can be developed by 2050 it can
contribute to the tune 114500 MW of electricity generation capacity.
Conclusions
 The above discussion clearly gives us guidance
that India can well balance the trilemma of
energy security, energy equity and environment
sustainability.
 The total estimated electricity generation
capacity of 1631 GW will have potential to make
India energy surplus country with 100 percent
reach.
 Besides use of energy efficient equipment has
potential to reduce energy requirement to the
tune of 30-50 percent.
 This will ease the condition of the global
warming.
 If will of implementing authority and private
player and public at large be strong to achieve
this target of environment and energy
Environment and energy sustainability

Environment and energy sustainability

  • 1.
    Environment and EnergySustainability: Mission Possible for India By: Dr. Manoj Kumar Associate Professor, GCCBA, Chandigarh
  • 2.
    Sustainability: Definition  Sustainabilitycould be defined as an ability or capacity of something to be maintained or to sustain itself. It’s about taking what we need to live now, without jeopardising the potential for people in the future to meet their needs (Land Learn NSW)
  • 3.
    We all wantthis to Happen  "China will overtake the US to become the world's largest economy by 2020, which in turn will be overtaken by India in 2050," according to Wealth Report 2012 by Knight Frank & Citi Private Bank.
  • 4.
    Objectives of theStudy  The paper tries to address following objectives the country need to address for its environment and energy sustainability:  To know the total primary energy consumption of India and some other countries in the world.  To know the current position and future trend of CO2 emission in India and some selected countries of the world.  To know the present position of electricity production mix and its future trends in India.  To suggest measure for environment and energy sustainability in India.
  • 6.
    Total Primary EnergyConsumption of Top 15 Countries in the World (Quadrillion Btu) Countries 2001 2002 2003 2004 2005 2006 2007 2008 2009 2010 2011 2012 China 41.20 43.48 49.98 57.91 64.42 70.39 74.85 78.94 85.99 94.92 103.65 105.88 United States 96.17 97.65 97.94 100.16 100.28 99.63 101.32 99.29 94.60 98.02 97.46 95.06 Russia 25.71 26.66 27.40 28.14 27.89 29.05 29.05 29.55 26.81 30.00 30.41 31.52 India 13.84 13.71 14.16 15.38 16.48 17.66 19.06 19.69 21.57 22.45 23.48 23.92 Japan 22.20 22.11 22.11 22.76 22.57 22.89 22.70 21.81 20.60 21.79 20.91 20.31 Germany 14.62 14.31 14.17 14.33 14.09 14.31 13.80 14.10 13.21 14.02 13.48 13.47 Canada 12.82 13.05 13.43 13.77 13.81 13.72 13.70 13.52 13.06 12.98 13.40 13.35 Brazil 8.45 8.55 8.64 8.99 9.28 9.50 10.01 10.47 10.39 11.46 11.89 12.10 Korea, South 8.13 8.40 8.71 8.92 9.21 9.34 9.72 9.90 9.98 10.82 11.31 11.52 France 11.09 11.02 11.11 11.31 11.38 11.40 11.22 11.32 10.75 11.03 10.84 10.69 Iran 5.39 5.89 6.19 6.41 7.45 7.93 8.14 8.51 9.36 9.23 9.51 9.64 Saudi Arabia 5.14 5.38 5.76 6.21 6.53 6.85 6.90 7.41 7.67 8.32 8.86 9.31 United Kingdom 9.88 9.75 9.79 9.85 9.82 9.71 9.37 9.26 8.73 8.92 8.43 8.63 Mexico 6.33 6.35 6.45 6.47 6.71 6.94 7.17 7.27 6.95 7.29 7.76 7.75 Italy 7.62 7.65 7.90 8.09 8.13 8.07 7.97 7.90 7.35 7.66 7.50 7.17 World 400.59 408.04 421.46 441.32 455.15 467.56 478.73 485.72 480.00 507.98 520.27 524.08
  • 7.
    Primary Energy Production &Consumption in India 2001 2002 2003 2004 2005 2006 2007 2008 2009 2010 2011 2012 production 10.29 9.95 10.51 11.09 11.74 12.39 13.03 13.59 14.6 15.44 15.89 16.33 consumption 13.84 13.67 14.11 15.32 16.33 17.63 18.81 19.67 21.65 22.71 23.47 23.92 0 5 10 15 20 25 30QuadrllionBritishUnits
  • 8.
    Total CO2 Emissionsfrom the Consumption of Energy(Million Metric Tons) Country 2001 2002 2003 2004 2005 2006 2007 2008 2009 2010 2011 2012 China 3227 3422 3960 4597 5116 5575 5908 6167 6816 7447 8127 8106 USA 5755 5799 5853 5974 5999 5924 6024 5841 5430 5630 5483 5270 India 1016 1008 1022 1121 1181 1281 1366 1449 1643 1715 1753 1831 Russia 1442 1501 1552 1600 1588 1636 1578 1629 1479 1662 1710 1782 Japan 1194 1200 1250 1256 1241 1240 1254 1216 1105 1181 1200 1259 German y 878 855 851 849 834 837 812 813 758 801 784 788 S. Korea 452 468 480 486 494 484 503 522 524 581 650 657 Iran 334 365 388 408 451 477 489 512 563 564 594 604 S. Arabia 301 312 347 389 402 402 393 422 438 469 551 583 Canada 562 568 597 612 610 597 590 574 545 541 552 551 Brazil 349 347 347 356 371 384 401 427 407 449 477 500 UK 573 562 573 583 583 585 570 564 516 529 488 499 S. Africa 393 380 413 442 432 444 457 490 478 474 472 473 Indonesi a 273 289 291 313 326 350 372 370 406 415 450 456 Mexico 380 379 388 378 398 419 444 453 421 431 446 454 2413 2457 2568 2696 2787 2861 2926 2964 2943 3105 3215 3231
  • 9.
    Total Electricity NetGeneration in India (Billion Kilowatt-hours) Type 2001 2002 2003 2004 2005 2006 2007 2008 2009 2010 2011 2012 Renew able 77.0 72.3 85.5 96.0 115.4 129.8 140.4 131.4 131.9 143.9 173.0 160.0 Hydro 73.0 67.7 80.0 89.6 106.8 119.2 126.6 115.6 112.0 121.8 142.2 124.6 Non- Hydro Solar, Tide and Wave 0.0 0.0 0.0 0.0 0.0 0.0 0.1 0.1 0.1 0.1 0.8 2.1 Biomas s and Waste 1.8 1.8 1.9 1.9 1.9 2.0 2.0 2.0 2.0 2.1 4.0 5.0 Wind 2.2 2.7 3.6 4.5 6.6 8.7 11.8 13.7 17.8 19.9 26.0 28.3 Nuclear 18.2 17.8 16.4 15.0 15.7 15.6 15.8 13.2 14.8 20.5 29.0 29.7 Fossil Fuels 461.6 486.5 512.6 533.8 544.6 582.0 619.7 651.5 709.4 747.9 804.3 862.9 Total 556.8 576.5 614.5 644.8 675.7 727.4 775.9 796.1 856.1 912.3 1006. 3 1052. 5
  • 11.
    Coal Based ThermalPower Generation  Despite its abundant reserves of about 286 billion tons, the world’s fifth-largest according to BP PLC, coal production in India has failed to keep pace with demand from utilities for several years now, leading to chronic power shortages that have crimped economic growth. (The Hindustan Times, 2013).  India needs to develop its own coal blocks as well as invest heavily in the coal mines in Australia, Mongolia, Indonesia and Russia to get coal for its industries in the times to come.  Indian companies are doing it to avoid the situation of coal shortage by cancellations of allotment of coal blocks.  India is expected to add more than 1,03,000 MW clean coal technology-based power generation capacity during the 2016-2025 period, says a report by Global Data Consulting (Guneet, 2015).  Country’s clean coal installations are at nascent stage, many recent ultra-mega power projects have adopted “super critical technology” that is more efficient technology, therefore help arrest GHG emission.  Some of the old thermal power plants have to be decommissioned due to expiry of their useful life.  We need to continue with the same pace to increase thermal power generation capacity with improvement in technology.
  • 12.
    Solar Power GenerationCapacity  India is blessed with good solar insolation throughout the year in most of its parts. Regions receiving Global insolation of 5KWh/m2 per day and above can generate at least 77W/m2 (on actual onsite basis) at 16% efficiency level. Hence, even 0.1% of the land area of the identified solar hotspot (1897.55 Km2) could deliver nearly 146 GW of SPV based electricity (379 Billion units) considering 2600 hours of sunshine annually. This power capacity would enhance considerably with improvement in the efficiency of SPV technology (T.V.Ramachandra, 2011).  Besides rooftop SPV both grid-connected and isolated have potential to generate 127 GW if only 10m2 SPV is installed on 50% of 330 million houses in India. Though, it will take time to have social acceptability yet we can save reduce GHG emission substantially. With such a tremendous scale of SPV installation the technology will become very cheap as we have no dearth of silicon in our country that is used in manufacturing of SPV cells.
  • 13.
    What We areDoing  Government of India, Ministry of Power has set a target of generating 1,75,000 MW from renewable energy sources by 2022.  Out of this, lion's share of 1,00,000 MW will come from solar power, 60,000 MW from wind, 10,000 MW from biomass and the remaining 5,000 MW from small hydro projects (The Economic Times, 2015).  If this target can be achieved then we can think of adding 700GW of new renewable electricity generation facilities from 2022-50 with the same pace.  If with proper R&D we could increase the efficiency to 50% the total power generation will increase to the tune of 6500-7000 Billion units per annum from renewable source only.  Big hydropower projects has potential of adding 40000 MW of new capacity by 2050.  Hydroelectric power is said to be the cheapest source of power as well as zero GHG emission after installations.
  • 14.
    Our Sagar-Manthan  Energypotential of our seas and oceans well exceeds our present energy needs.  India has long coastline with estuaries and gulfs where tides are strong enough to move turbine for electric power generation.  A variety of different technologies are currently under development throughout the world to harness this energy in all its forms including waves (40000 MW), tides (9000 MW) and thermal gradients (180000 MW).  Development is currently limited but the sector has potential to grow.  If 50% of this initial potential can be developed by 2050 it can contribute to the tune 114500 MW of electricity generation capacity.
  • 16.
    Conclusions  The abovediscussion clearly gives us guidance that India can well balance the trilemma of energy security, energy equity and environment sustainability.  The total estimated electricity generation capacity of 1631 GW will have potential to make India energy surplus country with 100 percent reach.  Besides use of energy efficient equipment has potential to reduce energy requirement to the tune of 30-50 percent.  This will ease the condition of the global warming.  If will of implementing authority and private player and public at large be strong to achieve this target of environment and energy