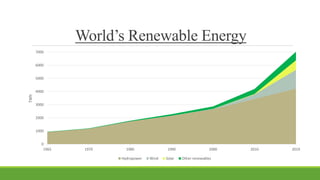
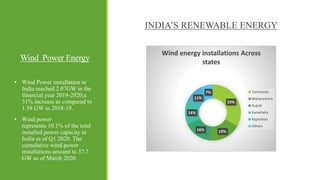
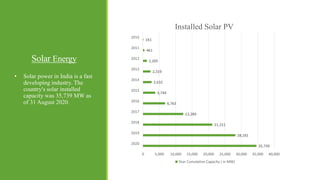
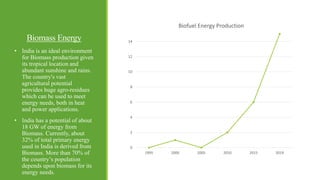
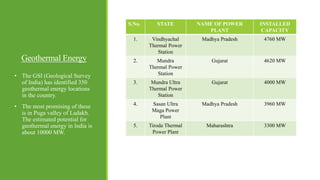
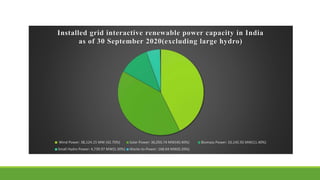
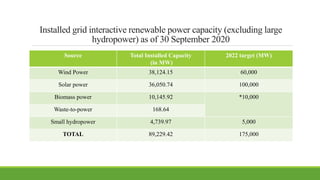
ARYA INSTITUTE OF ENGINEERING TECHNOLOGY &
MANAGEMENT
PRESENTATION ON “RENEWABLE ENERGY & PROSPECTS
IN INDIA”
S U B M I T T E D TO : S U B M I T T E D B Y:
M R . A N K I T A G A RWA L M A M TA M E E N A
H E A D O F D E PA RT M E N T 1 7 E A O E E 0 2 1
( E L E C T R I C A L E N G I N E E R I N G ) V I Y E A R , V I I S E M ( E E )
CONTENTS:-
 Introduction
 Mainstream Renewable Technologies
1. Wind Power Energy
2. Hydropower
3. Solar Energy
4. Biomass Energy
5. Geo thermal Energy
 World’s Renewable Energy
 India’s Renewable Energy
INTRODUCTION
 Energy that comes from the sources which are continuous replenished such as sunlight, wind, rain,
tides, waves and geo thermal energy.
 About 28% of Global Energy comes from the renewable resources.
Why Renewable Energy?
Renewable Energy won’t run out.
Maintenance requirements are lower.
Renewable energy has numerous health and environmental benefits.
Storage capabilities.
MAIN STREAM RENEWABLE TECHNOLOGIES
Wind Power Energy:-
• Wind turbines convert the kinetic energy of
wind in the mechanical power. A generator
can convert the mechanical power into the
electricity.
•Turbines are generally in the range of 2-3 MW.
 HYDROPOWER:-
•Hydropower is power derived from the energy
of falling or fast running water, which may be
harnessed for the useful purposes.
•Hydropower provides the almost 97% of all
electricity generated by the renewable energy
sources.
•Hydropower is clean. It doesn’t produce
greenhouse gasses & other air pollution.
Hydropower leaves behind no waste.
 SOLAR ENERGY:-
•Solar energy is radiant light and heat from the
sun that is harnessed using a range of
technologies such as solar heating,
photovoltaics, solar thermal energy etc.
•Solar energy is most abundant energy source
on the earth and solar power plants can last 40
years and more.
 BIOMASS ENERGY:-
• Biomass is a modern name of ancient
technology of burning plants or animal material
for energy production.
BIOMASS
SOURCES
Agricultural
crops &
residues
Animal
residues
Municipal
solid waste
Industrial
Residues
Forestry
crops &
residues
Sewage
 GEO THERMAL ENERGY:-
•Geothermal energy is the thermal energy
generated & stored in the earth.
•Earth’s geothermal energy originates from the
original formation of planet & from radioactive
decay of minerals.
Generator
Cooling
Tower
Injection
well
Reservoir
Hot water
Steam
Turbine
World’s Renewable Energy
0
1000
2000
3000
4000
5000
6000
7000
1965 1970 1980 1990 2000 2010 2019
TWh
Hydropower Wind Solar Other renewables
Power Generation in the world
WIND POWER GENERATION
0
50
100
150
200
250
300
350
400
1985 1990 1995 2000 2005 2010 2015 2019
TWh
India United States China
HYDROPOWER GENERATION
0
200
400
600
800
1000
1200
1400
1985 1990 1995 2000 2005 2010 2015 2019
TWh
China India United States
Solar Power Generation Biofuel Energy Generation
0
50
100
150
200
1985 1990 1995 2000 2005 2010 2015 2019
TWh
China India United States
0
100
200
300
400
1990 1995 2000 2005 2010 2015 2019
TWh
China India United states
Wind Power Energy
INDIA’S RENEWABLE ENERGY
• Wind Power installation in
India reached 2.07GW in the
financial year 2019-2020,a
31% increase as compared to
1.58 GW in 2018-19.
• Wind power
represents 10.1% of the total
installed power capacity in
India as of Q1 2020. The
cumulative wind power
installations amount to 37.7
GW as of March 2020.
33%
19%
16%
14%
11%
7%
Wind energy installations Across
states
Tamilnadu
Maharashtra
Gujrat
Kanartaka
Rajasthan
Others
Hydropower Energy
S.NO. STATE NAME OF POWER
PLANT
PLANNED
CAPACITY
1. Uttarakhand Tehri Hydropower
Plant
2400 MW
2. Maharashtra Koyna Hydroelectric
Project
1960 MW
3. Andhra Pradesh Srisailam Dam 1670 MW
4. Himachal Pradesh Nathpa Jhakri Dam 1530 MW
5. Gujarat Sardar Sarovar Dam 1450 MW
• As of 31 March 2020, India's
installed utility-scale
hydroelectric capacity was
46,000 MW, or 12.3% of its
total utility power generation
capacity.
• In the2019–20 , the total
hydroelectric power
generated in India was
156 TWh (excluding small
hydro) with an
average capacity factor of
38.71%.
Solar Energy
35,739
28,181
21,151
12,289
6,763
3,744
2,632
2,319
1,205
461
161
0 5,000 10,000 15,000 20,000 25,000 30,000 35,000 40,000
2020
2019
2018
2017
2016
2015
2014
2013
2012
2011
2010
Installed Solar PV
Year Cumulative Capacity ( in MW)
• Solar power in India is a fast
developing industry. The
country's solar installed
capacity was 35,739 MW as
of 31 August 2020.
Biomass Energy
• India is an ideal environment
for Biomass production given
its tropical location and
abundant sunshine and rains.
The country's vast
agricultural potential
provides huge agro-residues
which can be used to meet
energy needs, both in heat
and power applications.
• India has a potential of about
18 GW of energy from
Biomass. Currently, about
32% of total primary energy
used in India is derived from
Biomass. More than 70% of
the country’s population
depends upon biomass for its
energy needs.
0
2
4
6
8
10
12
14
1995 2000 2005 2010 2015 2019
Biofuel Energy Production
Geothermal Energy
S.No. STATE NAME OF POWER
PLANT
INSTALLED
CAPACITY
1. Vindhyachal
Thermal Power
Station
Madhya Pradesh 4760 MW
2. Mundra
Thermal Power
Station
Gujarat 4620 MW
3. Mundra Ultra
Thermal Power
Station
Gujarat 4000 MW
4. Sasan Ultra
Maga Power
Plant
Madhya Pradesh 3960 MW
5. Tiroda Thermal
Power Plant
Maharashtra 3300 MW
• The GSI (Geological Survey
of India) has identified 350
geothermal energy locations
in the country.
• The most promising of these
is in Puga valley of Ladakh.
The estimated potential for
geothermal energy in India is
about 10000 MW.
Installed grid interactive renewable power capacity in India
as of 30 September 2020(excluding large hydro)
Wind Power: 38,124.15 MW (42.70%) Solar Power: 36,050.74 MW(40.40%) Biomass Power: 10,145.92 MW(11.40%)
Small Hydro Power: 4,739.97 MW(5.30%) Waste-to-Power: 168.64 MW(0.20%)
Prospect of India’s Renewable Energy
India is running one of the largest and most ambitious renewable capacity expansion programs in the world.
In 2019 at UN climate summit, India announced that it will be more than doubling its renewable energy
target from 175GW by 2022 to 450GW of renewable energy by the same year.
These targets would place India among the world leaders in renewable energy use and place India at the
center of its "Sunshine Countries" International Solar Alliance project promoting the growth and
development of solar power internationally to over 120 countries.
The government target of installing 20 GW of solar power by 2022 but it was achieved four years ahead of
schedule in January 2018, through both solar parks as well as roof-top solar panels.
The 2022 electrical power targets include achieving 227GW (earlier 175 GW) of energy from renewable
sources - nearly 113 GW through solar power, 66 GW from wind power, 10 GW from biomass power, 5GW
from small hydro and 31GW from floating solar and offshore wind power.
Installed grid interactive renewable power capacity (excluding large
hydropower) as of 30 September 2020
Source Total Installed Capacity
(in MW)
2022 target (MW)
Wind Power 38,124.15 60,000
Solar power 36,050.74 100,000
Biomass power 10,145.92 *10,000
Waste-to-power 168.64
Small hydropower 4,739.97 5,000
TOTAL 89,229.42 175,000
THANK YOU

Renewable Energy & Prospects in India

  • 1.
    ARYA INSTITUTE OFENGINEERING TECHNOLOGY & MANAGEMENT PRESENTATION ON “RENEWABLE ENERGY & PROSPECTS IN INDIA” S U B M I T T E D TO : S U B M I T T E D B Y: M R . A N K I T A G A RWA L M A M TA M E E N A H E A D O F D E PA RT M E N T 1 7 E A O E E 0 2 1 ( E L E C T R I C A L E N G I N E E R I N G ) V I Y E A R , V I I S E M ( E E )
  • 2.
    CONTENTS:-  Introduction  MainstreamRenewable Technologies 1. Wind Power Energy 2. Hydropower 3. Solar Energy 4. Biomass Energy 5. Geo thermal Energy  World’s Renewable Energy  India’s Renewable Energy
  • 3.
    INTRODUCTION  Energy thatcomes from the sources which are continuous replenished such as sunlight, wind, rain, tides, waves and geo thermal energy.  About 28% of Global Energy comes from the renewable resources. Why Renewable Energy? Renewable Energy won’t run out. Maintenance requirements are lower. Renewable energy has numerous health and environmental benefits. Storage capabilities.
  • 4.
    MAIN STREAM RENEWABLETECHNOLOGIES Wind Power Energy:- • Wind turbines convert the kinetic energy of wind in the mechanical power. A generator can convert the mechanical power into the electricity. •Turbines are generally in the range of 2-3 MW.
  • 5.
     HYDROPOWER:- •Hydropower ispower derived from the energy of falling or fast running water, which may be harnessed for the useful purposes. •Hydropower provides the almost 97% of all electricity generated by the renewable energy sources. •Hydropower is clean. It doesn’t produce greenhouse gasses & other air pollution. Hydropower leaves behind no waste.
  • 6.
     SOLAR ENERGY:- •Solarenergy is radiant light and heat from the sun that is harnessed using a range of technologies such as solar heating, photovoltaics, solar thermal energy etc. •Solar energy is most abundant energy source on the earth and solar power plants can last 40 years and more.
  • 7.
     BIOMASS ENERGY:- •Biomass is a modern name of ancient technology of burning plants or animal material for energy production. BIOMASS SOURCES Agricultural crops & residues Animal residues Municipal solid waste Industrial Residues Forestry crops & residues Sewage
  • 8.
     GEO THERMALENERGY:- •Geothermal energy is the thermal energy generated & stored in the earth. •Earth’s geothermal energy originates from the original formation of planet & from radioactive decay of minerals. Generator Cooling Tower Injection well Reservoir Hot water Steam Turbine
  • 9.
    World’s Renewable Energy 0 1000 2000 3000 4000 5000 6000 7000 19651970 1980 1990 2000 2010 2019 TWh Hydropower Wind Solar Other renewables
  • 10.
    Power Generation inthe world WIND POWER GENERATION 0 50 100 150 200 250 300 350 400 1985 1990 1995 2000 2005 2010 2015 2019 TWh India United States China HYDROPOWER GENERATION 0 200 400 600 800 1000 1200 1400 1985 1990 1995 2000 2005 2010 2015 2019 TWh China India United States
  • 11.
    Solar Power GenerationBiofuel Energy Generation 0 50 100 150 200 1985 1990 1995 2000 2005 2010 2015 2019 TWh China India United States 0 100 200 300 400 1990 1995 2000 2005 2010 2015 2019 TWh China India United states
  • 12.
    Wind Power Energy INDIA’SRENEWABLE ENERGY • Wind Power installation in India reached 2.07GW in the financial year 2019-2020,a 31% increase as compared to 1.58 GW in 2018-19. • Wind power represents 10.1% of the total installed power capacity in India as of Q1 2020. The cumulative wind power installations amount to 37.7 GW as of March 2020. 33% 19% 16% 14% 11% 7% Wind energy installations Across states Tamilnadu Maharashtra Gujrat Kanartaka Rajasthan Others
  • 13.
    Hydropower Energy S.NO. STATENAME OF POWER PLANT PLANNED CAPACITY 1. Uttarakhand Tehri Hydropower Plant 2400 MW 2. Maharashtra Koyna Hydroelectric Project 1960 MW 3. Andhra Pradesh Srisailam Dam 1670 MW 4. Himachal Pradesh Nathpa Jhakri Dam 1530 MW 5. Gujarat Sardar Sarovar Dam 1450 MW • As of 31 March 2020, India's installed utility-scale hydroelectric capacity was 46,000 MW, or 12.3% of its total utility power generation capacity. • In the2019–20 , the total hydroelectric power generated in India was 156 TWh (excluding small hydro) with an average capacity factor of 38.71%.
  • 14.
    Solar Energy 35,739 28,181 21,151 12,289 6,763 3,744 2,632 2,319 1,205 461 161 0 5,00010,000 15,000 20,000 25,000 30,000 35,000 40,000 2020 2019 2018 2017 2016 2015 2014 2013 2012 2011 2010 Installed Solar PV Year Cumulative Capacity ( in MW) • Solar power in India is a fast developing industry. The country's solar installed capacity was 35,739 MW as of 31 August 2020.
  • 15.
    Biomass Energy • Indiais an ideal environment for Biomass production given its tropical location and abundant sunshine and rains. The country's vast agricultural potential provides huge agro-residues which can be used to meet energy needs, both in heat and power applications. • India has a potential of about 18 GW of energy from Biomass. Currently, about 32% of total primary energy used in India is derived from Biomass. More than 70% of the country’s population depends upon biomass for its energy needs. 0 2 4 6 8 10 12 14 1995 2000 2005 2010 2015 2019 Biofuel Energy Production
  • 16.
    Geothermal Energy S.No. STATENAME OF POWER PLANT INSTALLED CAPACITY 1. Vindhyachal Thermal Power Station Madhya Pradesh 4760 MW 2. Mundra Thermal Power Station Gujarat 4620 MW 3. Mundra Ultra Thermal Power Station Gujarat 4000 MW 4. Sasan Ultra Maga Power Plant Madhya Pradesh 3960 MW 5. Tiroda Thermal Power Plant Maharashtra 3300 MW • The GSI (Geological Survey of India) has identified 350 geothermal energy locations in the country. • The most promising of these is in Puga valley of Ladakh. The estimated potential for geothermal energy in India is about 10000 MW.
  • 17.
    Installed grid interactiverenewable power capacity in India as of 30 September 2020(excluding large hydro) Wind Power: 38,124.15 MW (42.70%) Solar Power: 36,050.74 MW(40.40%) Biomass Power: 10,145.92 MW(11.40%) Small Hydro Power: 4,739.97 MW(5.30%) Waste-to-Power: 168.64 MW(0.20%)
  • 18.
    Prospect of India’sRenewable Energy India is running one of the largest and most ambitious renewable capacity expansion programs in the world. In 2019 at UN climate summit, India announced that it will be more than doubling its renewable energy target from 175GW by 2022 to 450GW of renewable energy by the same year. These targets would place India among the world leaders in renewable energy use and place India at the center of its "Sunshine Countries" International Solar Alliance project promoting the growth and development of solar power internationally to over 120 countries. The government target of installing 20 GW of solar power by 2022 but it was achieved four years ahead of schedule in January 2018, through both solar parks as well as roof-top solar panels. The 2022 electrical power targets include achieving 227GW (earlier 175 GW) of energy from renewable sources - nearly 113 GW through solar power, 66 GW from wind power, 10 GW from biomass power, 5GW from small hydro and 31GW from floating solar and offshore wind power.
  • 19.
    Installed grid interactiverenewable power capacity (excluding large hydropower) as of 30 September 2020 Source Total Installed Capacity (in MW) 2022 target (MW) Wind Power 38,124.15 60,000 Solar power 36,050.74 100,000 Biomass power 10,145.92 *10,000 Waste-to-power 168.64 Small hydropower 4,739.97 5,000 TOTAL 89,229.42 175,000
  • 20.