Downloaded 119 times
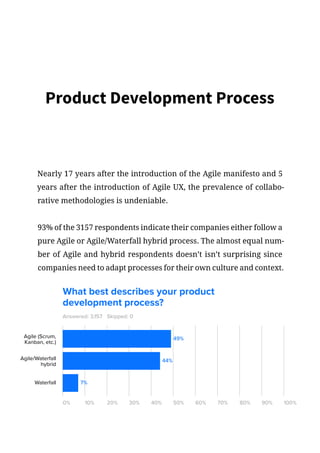

The document is an industry report on enterprise UX from 2017 to 2018. Some of the key findings from the report include: - Most enterprise designers are self-taught and have at least 3 years of experience. The majority work in-house at large companies. - Common challenges for enterprise UX teams include improving consistency, testing designs with users, and collaborating across teams. These challenges tend to increase with company size. - While legacy waterfall processes still exist, most organizations now use Agile or a hybrid process and incorporate practices like design systems and prototyping. - Over 90% of respondents indicate their companies follow Agile, waterfall, or a hybrid process for product development.


![[Srijan Wednesday Webinars] Opportunities and Challenges in Enterprise UX Design](https://cdn.slidesharecdn.com/ss_thumbnails/opportunitiesandchallengesinenterpriseuxdesign-161006091903-thumbnail.jpg?width=640&height=640&fit=bounds)