Downloaded 33 times
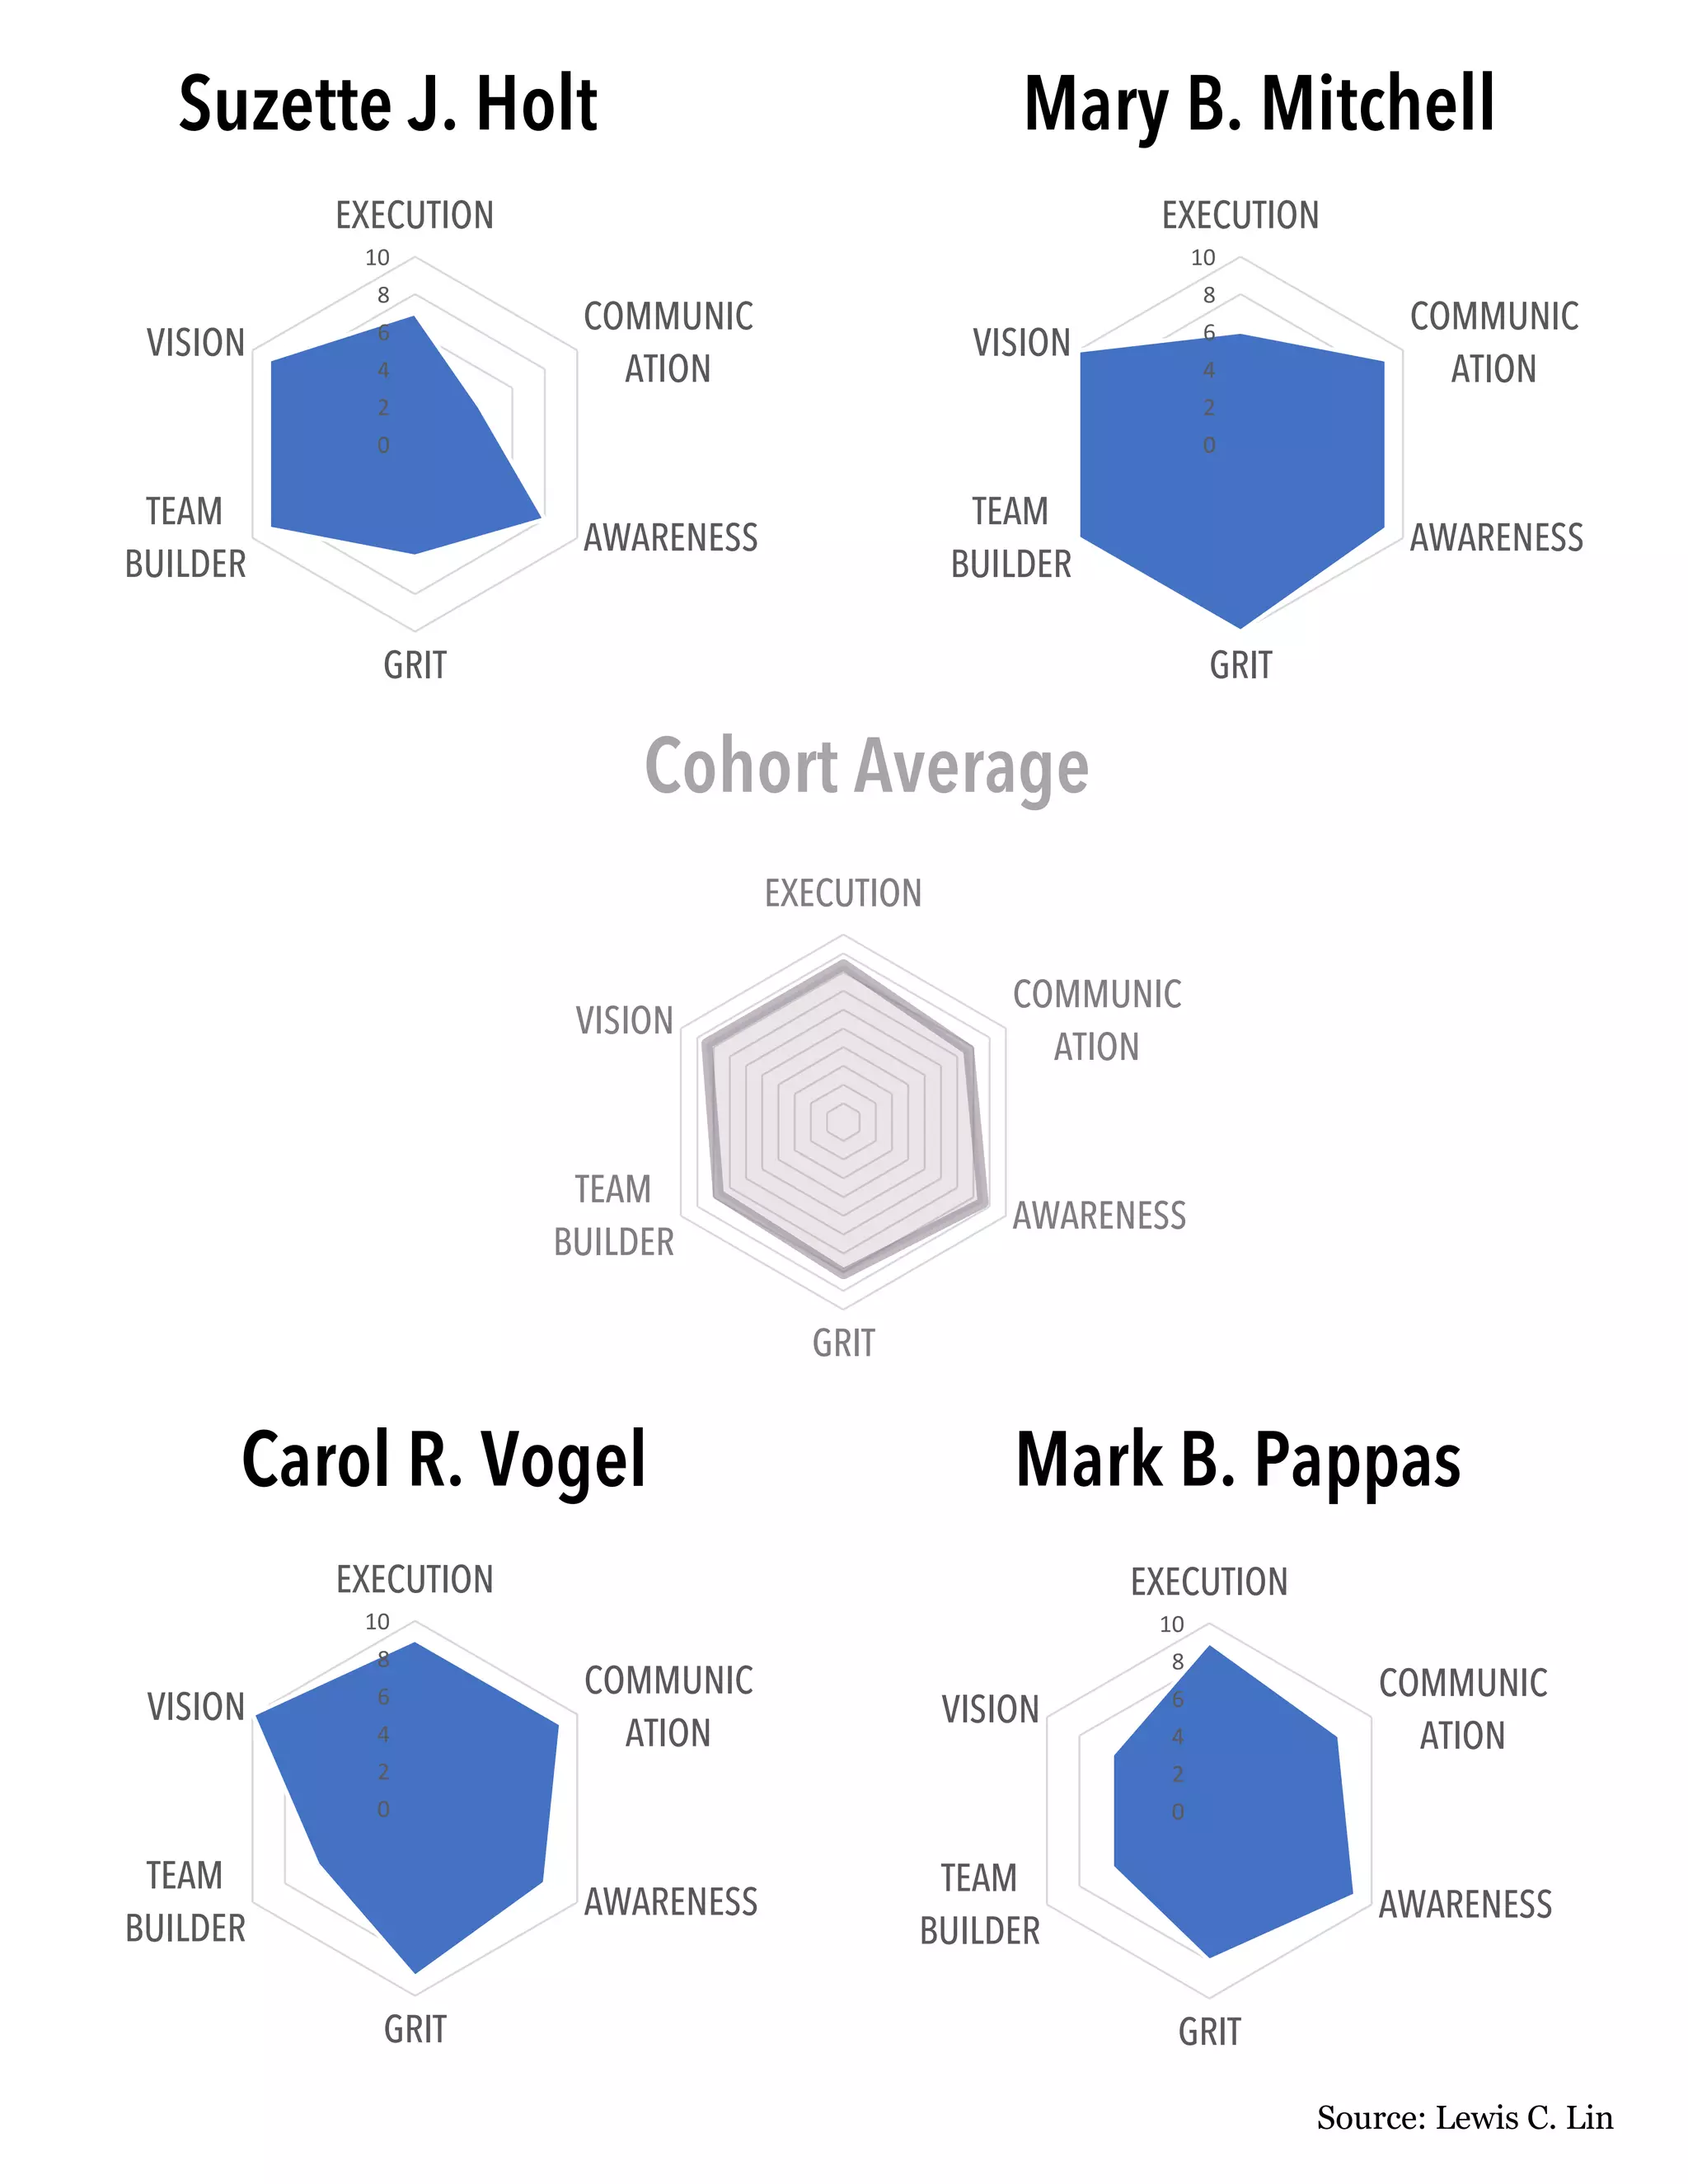
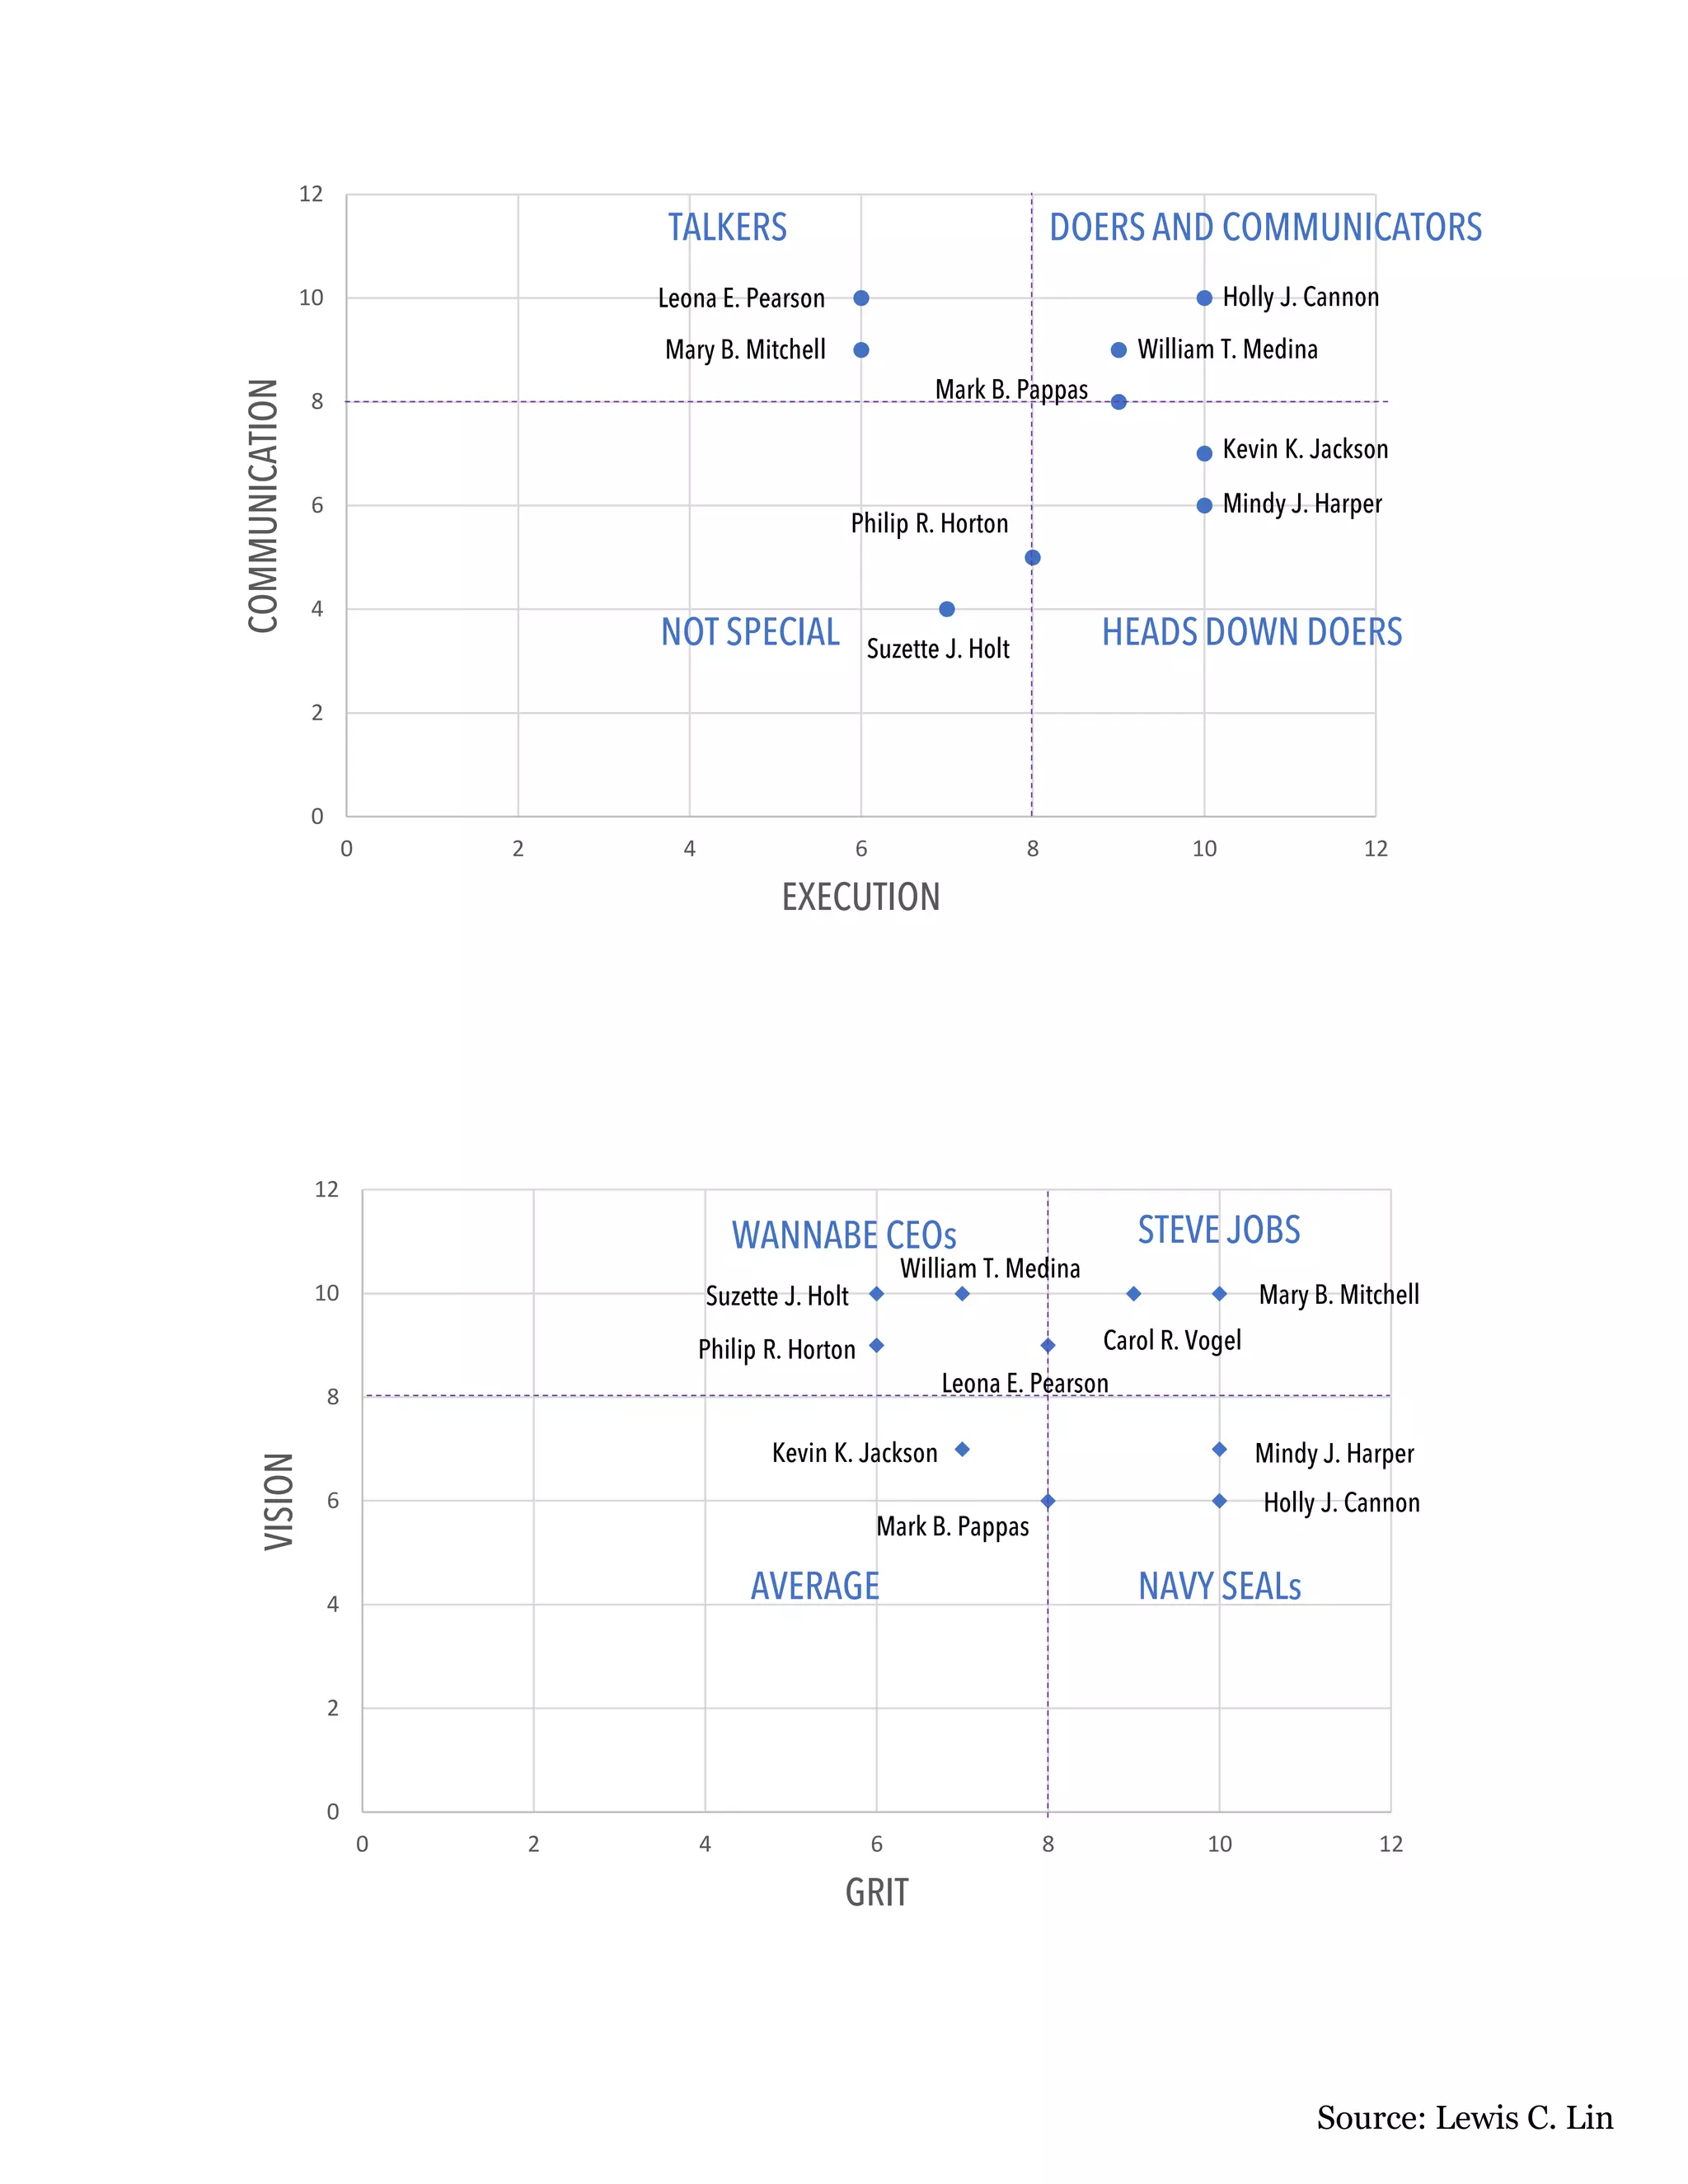

The document displays a series of charts that compare individuals and the cohort average on traits like execution, communication, awareness, grit, team building, and vision. The first chart shows where individuals fall on each trait compared to the cohort average. Another chart contrasts communicators and doers versus talkers and heads down doers. The final charts plot various individuals' scores on communication vs execution and vision vs grit, comparing them to examples like Steve Jobs and Navy SEALs.