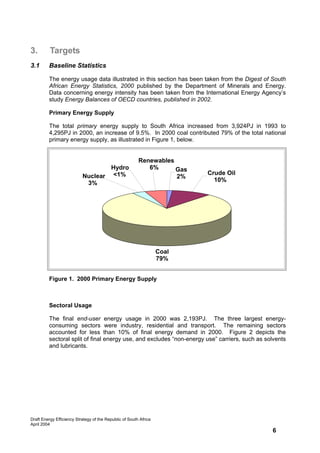
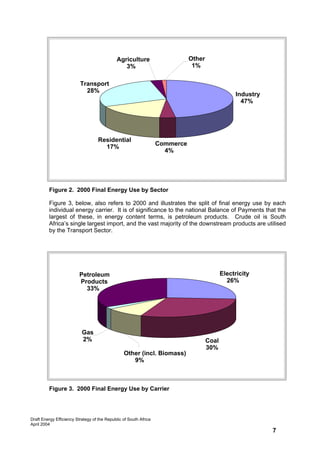
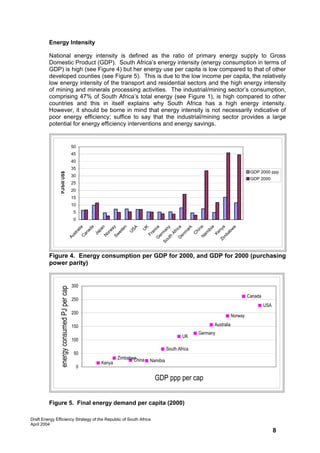
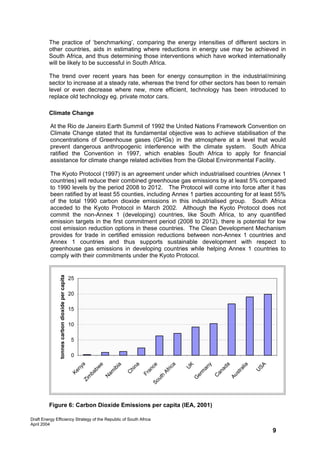
SlideShare a Scribd company logo
1 of 44
Download to read offline
Draft Energy Efficiency Strategy of the Republic of South Africa


             Department of Minerals and Energy
                          April 2004
Foreword
          In South Africa we take energy for granted, with the consequence that our energy
          consumption is higher than it should be. Indeed, our country’s economy is largely
          based on minerals extraction and processing which is by its nature very energy-
          intensive. Whilst our historically low electricity price has contributed towards a
          competitive position, it has also meant that there has been little incentive to save
          electricity.

          So in many respects we start with a clean slate with little energy efficiency measures
          having taken place, with the exception of many years of work by universities and
          other research institutions that have pointed the way. The White Paper on Energy
          Policy (1998) recognized that standards and appliance labeling should be the first
          measures to put in place in implementing energy efficiency. Indeed such
          prescriptive-type measures provide the framework on which any energy efficiency
          Strategy is based. At the same time consumers of energy also need to perceive the
          cost-benefits they can derive from energy efficiency measures and it is here that
          demonstrations and case studies are essential. In South Africa Government is
          taking the lead by using Public Buildings as an example. Cabinet has approved the
          implementation of a flagship programme of energy efficient measures in National
          Government Buildings in the imminent future. Recent initiatives in Government
          offices, where efficient lighting and new energy management measures have been
          introduced, have revealed significant savings in electricity costs to date. Retrofitting
          where higher consumption appliances are currently used such as air-
          conditioning/heating systems, should realise even greater savings. The allied
          Commercial Building Sector is an area for potential improvement given the rapid
          increase in office construction.

          The Industrial and Mining Sectors are the heaviest users of energy, accounting for
          more than two-thirds of our national electricity usage. Here lies the potential for the
          largest savings by replacing old technologies with new, and by employing best
          energy management practice. The Transport Sector uses three-quarters of South
          Africa’s petroleum products, making it an obvious place to implement measures to
          improve efficiency. Standards for energy efficient cars, vehicles with lower
          emissions, the introduction of licensing differentials according to engine efficiency
          (fee bate), and roadworthy tests would be among the first measures to implement.
          The Residential sector has great potential for energy savings given the National
          Housing Programme, since building design is the major factor determining the
          energy use of a household.

          Perhaps the most neglected area for implementation is the promotion of public
          awareness about the costs and benefits of energy efficiency. Major energy savings
          can only be achieved through changes in people’s behaviour, and that depends on
          informing them about what options exist. The World Summit on Sustainable
          Development (2002) sensitised the nation about the impact that energy use has on
          the World’s weather systems. In this era of climate change South Africa needs to
          take more urgent measures to reduce energy usage than in the past. It is hoped
          that this Energy Efficiency Strategy will provide a blueprint for this venture.


          PUMZILE MLAMO-NGCUKA
          Minister of Minerals and Energy


Draft Energy Efficiency Strategy of the Republic of South Africa
April 2004
                                                                                             i
Executive Summary
         This is the first Energy Efficiency Strategy for South Africa. It is the first consolidated
         Governmental document geared towards the development and implementation of
         energy efficiency practices in this country. The Strategy takes its mandate from the
         White Paper on Energy Policy, published in 1998, and links energy sector
         development with national socio-economic development plans. In addition, it
         provides clear and practical guidelines for the implementation of efficient practices
         within our economy, including the setting of governance structures for activity
         development, promotion and coordination.

         This Strategy allows for the immediate implementation of low-cost and no-cost
         interventions, as well as those higher-cost measures with short payback periods.
         These will be followed by medium-term and longer-term investment opportunities in
         energy efficiency. The Strategy acknowledges that there exists significant potential
         for energy efficiency improvements across all sectors of our national economy.

         The vision of the Strategy is to contribute towards affordable energy for all, and to
         minimize the effects of energy usage upon human health and the environment. This
         will be achieved by encouraging sustainable energy development and energy use
         through efficient practices. The three cornerstones of sustainable development are
         embraced within the strategic goals of this document, these being environmental,
         social and economic sustainability.

         The Strategy sets a national target for energy efficiency improvement of 12% by
         2014. This target is expressed in relation to the forecast national energy demand at
         that time, and therefore allows for current expectations of economic growth. It is
         accepted that this target will be challenging, but at the same time it is considered to
         be readily achievable through the means described within the following pages.

         Energy efficiency improvements will be achieved largely via enabling instruments
         and interventions. These will include inter alia economic and legislative means,
         efficiency labels and performance standards, energy management activities and
         energy audits, as well as the promotion of efficient practices.

         The Strategy will cover all energy-using sectors and will be implemented through
         Sectoral Implementation Plans as outlined within. Systems will be put into place in
         order to periodically monitor progress against the target that will be reviewed at the
         end of each phase.


Draft Energy Efficiency Strategy of the Republic of South Africa
April 2004
                                                                                              ii
Definitions and Terminology
          Appliance Labeling                       Design and provision of consumer information by
                                                   labels      that   advise   on   the   minimum   energy
                                                   performance of appliances
          CaBEERE                                  Capacity Building in Energy Efficiency and Renewable
                                                   Energy Project
          CDM                                      Clean Development Mechanism
          CEF                                      Central Energy Fund
          CFL                                      Compact Fluorescent Lamp
          CO2                                      Carbon Dioxide
          CSIR                                     Council for Scientific & Industrial Research
          CV                                       Calorific Value
          DME                                      Department of Minerals and Energy
          DNA                                      Designated National Authority
          DoH                                      Department of Housing
          DTI                                      Department of Trade and Industry
          DSM                                      Demand Side Management
          EE                                       Energy Efficiency
          Energy Intensity                         Energy use per unit of output or activity
          ESCO                                     Energy Service Company
          GW                                       Gigawatt (109 Watts) unit of electric power
          HVAC                                     Heating, Ventilation and Air Conditioning
          IEP                                      Integrated Energy Plan
          NER                                      National Electricity Regulator
          NOx                                      Oxides of Nitrogen
          PetroSA                                  Petroleum, Oil and Gas Corporation of South Africa
          PJ                                       Petajoule (1015 Joules) unit of energy
          RDP                                      Reconstruction and Development Programme
          REDs                                     Regional Electricity Distributors
          SABS                                     South African Bureau of Standards
          SAEDES                                   South Africa Energy and Demand Efficiency Standard
          SO2                                      Sulphur Dioxide
          UNIDO                                    United Nations Industrial Development Organisation
          VSD                                      Variable Speed Drives


Draft Energy Efficiency Strategy of the Republic of South Africa
April 2004
                                                                                                     iii
Table of Contents
1. Introduction ........................................................................1
1.1     Why do we need an Energy Efficiency Strategy?------------------------ 1
1.2     The Status Quo ---------------------------------------------------------------------- 1
1.3     The Strategic Process------------------------------------------------------------- 2

2. Vision and Goals................................................................4
3. Targets ................................................................................6
3.1     Baseline Statistics------------------------------------------------------------------ 6
3.2     Barriers------------------------------------------------------------------------------- 10
3.3     Targets ------------------------------------------------------------------------------- 11
3.4     Outcomes --------------------------------------------------------------------------- 15
3.5     Monitoring & Measurement --------------------------------------------------- 15

4. Implementing Instruments..............................................16
4.1     Support Mechanisms------------------------------------------------------------ 16
4.2     Mandate and Governance------------------------------------------------------ 18
4.3     Finance Instruments------------------------------------------------------------- 19
4.4     Stakeholders ----------------------------------------------------------------------- 22

5. Sector Programmes.........................................................24
5.1     Industrial Sector Programme ------------------------------------------------- 26
5.2     Power Generation Sector Programme------------------------------------- 28
5.3     Commercial and Public Buildings Sector Programme--------------- 29
5.4     Residential Sector Programme ---------------------------------------------- 31
5.5     Transport Sector Programme ------------------------------------------------ 33

6.       Cross-cutting Issues .....................................................35
6.1     Integrated Energy Planning --------------------------------------------------- 35
6.2     Renewable Energy --------------------------------------------------------------- 35
6.3     Environment and Health-------------------------------------------------------- 36
6.4     The Clean Fuels Programme-------------------------------------------------- 36

7.       References .....................................................................38


Draft Energy Efficiency Strategy of the Republic of South Africa
April 2004
                                                                                                     iv
List of Figures

Figure 1.          2000 Primary Energy Supply -----------------------------------------------------6
Figure 2.          2000 Final Energy Use by Sector -----------------------------------------------7
Figure 3.          2000 Final Energy Use by Carrier -----------------------------------------------7
Figure 4.          Energy Consumption per GDP for 2000 and GDP for 2000(ppp) -----8
Figure 5.          Final Energy Demand per Capita (2000) --------------------------------------8
Figure 6.          Carbon Dioxide Emissions per Capita ----------------------------------------9
Figure 7.          Final Energy Demand – Target Outcome to 2014 ------------------------10
Figure 8.          Stakeholder Responsibilities ---------------------------------------------------24
Figure 9.          Sectoral Stakeholder Responsibilities --------------------------------------25


List of Tables

Table 1.            Projected Outcomes by 2014 ---------------------------------------------------15
Table 2.            Industrial Sector Programme ---------------------------------------------------28
Table 3.            Commercial and Public Buildings Sector Programme -----------------31
Table 4.            Residential Sector Programme -------------------------------------------------33
Table 5.            Transport Sector Programme ---------------------------------------------------35


Draft Energy Efficiency Strategy of the Republic of South Africa
April 2004
                                                                                                 v
1.        Introduction
1.1      Why do we need an Energy Efficiency Strategy?

         Worldwide, nations are beginning to face up to the challenge of sustainable energy – in
         other words to alter the way that energy is utilised so that social, environmental and
         economic aims of sustainable development are supported.

         South Africa is a developing nation with significant heavy industry, which is by its nature
         energy intensive. This energy intensive economy largely relies on indigenous coal
         reserves for its driving force. At first sight there would appear to be an apparent paradox
         between using less energy and developing a healthy and prosperous nation based on
         energy intensive activities. This is not the case. In recent years energy efficiency has
         significantly gained in stature and has become recognised as one of the most cost-
         effective ways of meeting the demands of sustainable development.

         The benefits of energy efficiency upon the environment are self-evident. These benefits
         are of particular relevance, as South Africa remains one of the highest emitters of the
         Greenhouse gas CO2 per capita in the world. At a local level the problems of SO2 and
         smoke emissions have been the focus of concern for many communities living adjacent to
         heavily industrialised areas. Energy efficiency can address both the macroscopic and
         microscopic aspects of atmospheric pollution.

         The economic benefits of improving energy efficiency have been well documented since
         the first Oil Crisis in the early 1970’ s. Many forward-thinking industrial and commercial
         concerns have already adopted energy efficiency as a key policy towards maximising
         profits. The national electricity utility, Eskom, has itself embarked upon a DSM
         programme to defer investment in new plant.

         Such positive contributions to both our physical and economic environments will inevitably
         benefit our social wellbeing also; the alleviation of fuel poverty, job creation, improvements
         to human health, better working conditions - the list goes on. All of these factors will
         significantly contribute towards the aims of sustainable social development.

         It is for theses reasons that South Africa needs an Energy Efficiency Strategy.

1.2      The Status Quo

         The existing energy policy of South Africa is captured within the White Paper on Energy
         Policy (1998). The policy aims to provide the nation with wider access to energy services,
         by various means, whilst ensuring that the environmental impacts of energy conversion
         and use are minimised as far as possible. This is of relevance to Africa as a whole, as
         South Africa uses some 40% of the total electricity consumed within the continent.

         South Africa is endowed with rich deposits of minerals and fossil fuel in the form of coal. It
         is no surprise, therefore, that the economic development of our country has historically
         been focused upon the extraction and processing of these resources. This has led to the
         development of a national economy heavily dependent upon energy as its driving-force,
         and has resulted in the core of our industries being those concerned with energy-intensive
         activities, such as iron and steel production and other raw materials processing.
         Furthermore, coal has inevitably emerged as the major source of primary energy to meet
         the demands of industry and the country as a whole. In 2000 the total primary energy
         supply to the nation was nearly 4,300 Petajoules, of which 79% was attributable to coal.


Draft Energy Efficiency Strategy of the Republic of South Africa
April 2004
                                                                                                 1
Our abundant coal reserves have partially contributed towards an economic environment
         wherein the unit price of electricity is amongst the cheapest in the world. One of the
         undesirable side effects of this has been that energy efficiency has been demoted to make
         way for “priority” considerations, such as plant expansions and increases in production
         throughput. Indeed, by international standards the South African economy uses a
         relatively high amount of energy per unit of national economic output, or GDP.

         In recent years the issue of energy efficiency has attracted more interest in South Africa,
         and a number of initiatives and projects have proven the merits of enhanced energy
         performance.      The 2002 World Summit on Sustainable Development, held in
         Johannesburg, recognised energy efficiency as a key tool to enhance clean energy
         development and to mitigate the negative effects of energy use upon the environment. A
         further development is Eskom’s Demand Side Management programme, which is aimed at
         reducing the national peak power demand, thereby deferring the immediate need for
         additional power generation capacity.

         In short, energy efficiency is fast gaining ground as a cost-effective means to approach all
         aspects of sustainability. It is generally accepted that South Africa holds numerous
         opportunities for energy savings, together with pollution mitigation measures of
         international significance. This Strategy offers a consolidated approach in order to
         capture these opportunities in the best interests of our nation.

1.3      The Strategic Process

         The White Paper on Energy Policy, published in 1998 states:

            “Significant potential exists for energy efficiency improvements in South Africa. In
            developing policies to achieve greater efficiency of energy use, government is mindful of
            the need to overcome shortcomings in energy markets. Government would create
            energy efficiency consciousness and would encourage energy efficiency in commerce
            and industry, will establish energy efficiency norms and standards for commercial
            buildings and industrial equipment and voluntary guidelines for the thermal performance
            of housing. A domestic appliance-labeling program will be introduced and publicity
            campaigns will be undertaken to ensure that appliance purchasers are aware of the
            purpose of the labels. Targets for industrial and commercial energy efficiency
            improvements will be set and monitored.”

         The White Paper gives a mandate to the DME to promote Energy Efficiency through
         various means. Although Government's present capacity to undertake energy efficiency
         programmes is limited, the DME will finalise and consolidate considerations to ensure
         appropriate leadership in the sector.

          The Strategy sets a national target for energy savings, of at least 12%, to be achieved by
          2014. This target is expressed in relation to the forecast national energy demand at that
          time, based on the ‘business as usual’ baseline scenario for South Africa modelled as part
          of the National Integrated Energy Plan (2003), which uses energy consumption data for
          the year 2000. The target also assumes that the Energy Efficiency interventions outlined
          in this Strategy are undertaken; these measures being primarily focussed on low cost
          interventions that can be achieved with minimal investments.

          Energy efficiency improvements will be achieved through enabling instruments and
          interventions including economic and legislative means, information activities, energy
          labels, energy performance standards, energy audits, energy management and the
          promotion of efficient technologies.


Draft Energy Efficiency Strategy of the Republic of South Africa
April 2004
                                                                                               2
The Strategy will cover all economic sectors, and be implemented through Sector
          Programmes. Systems will be put in place to monitor and evaluate progress in energy
          efficiency improvements and a periodic strategic review of the implementation will be
          undertaken.


Draft Energy Efficiency Strategy of the Republic of South Africa
April 2004
                                                                                          3
2.        Vision and Goals
         Vision


                To encourage sustainable energy sector development and energy use
                                    through efficient practices

                                                                   thereby

              Minimising the undesirable impacts of energy usage upon health and the
                                           environment,

                                                                    and

                         Contributing towards secure and affordable energy for all.


         Goals

         The Strategy’s eight goals are outlined below. The order in which the goals appear does
         not relate to any particular priority, although they are grouped in terms of social,
         environmental and economic sustainability.


                                                     Social Sustainability

           Goal 1: Improve the health of the nation
                • Energy efficiency reduces the atmospheric emission of harmful
                    substances such as oxides of Sulphur, oxides of Nitrogen, and
                    smoke. Such substances are known to have an adverse effect on
                    health and are frequently a primary cause of common respiratory
                    ailments.

           Goal 2: Job creation
                • Studies show that jobs will be created by the spin-off effects of
                   energy efficiency implementation. Improvements in commercial
                   economic performance, and uplifting the energy efficiency sector
                   itself, will inevitably lead to nationwide employment opportunities.

           Goal 3: Alleviate energy poverty
                • Energy efficient homes not only improve occupant health and
                   wellbeing, but also enable the adequate provision of energy
                   services to the community at an affordable cost.


Draft Energy Efficiency Strategy of the Republic of South Africa
April 2004
                                                                                           4
Environmental Sustainability

           Goal 4: Reduce environmental pollution
                • Energy efficiency will reduce the local environmental impacts of its
                   production and use. These impacts include the atmospheric
                   emission of harmful and odorous gases.

           Goal 5: Reduce CO2 emissions
                • Energy efficiency is one of the most cost-effective methods of
                   reducing Greenhouse Gas emissions, and thereby combating
                   Climate Change. Addressing Climate Change opens the door to
                   utilising novel financing mechanisms, such as the CDM, to reduce
                   CO2 emissions.


                                                  Economic Sustainability

           Goal 6: Improve industrial competitiveness
                • It has been demonstrated that one of the most cost-effective ways
                    of maximizing commercial profitability is the adoption of appropriate
                    energy efficiency measures. Nationwide, this will improve South
                    Africa’s export performance and improve the value that her
                    economy derives from indigenous energy resources.

           Goal 7: Enhance Energy Security
                • Energy conservation will reduce the necessary volume of imported
                   primary energy sources, crude oil in particular. This will enhance
                   the robustness of South Africa’s energy security and will increase
                   the country’s resilience against external energy supply disruptions
                   and price fluctuations.

           Goal 8: Defer the necessity for additional power generation capacity
                • It is estimated that the country’s existing power generation capacity
                   will be insufficient to meet the rising national maximum demand by
                   2007-2012. Energy efficiency is integral to Eskom’s Demand Side
                   Management programme insofar as it contributes 34% towards the
                   2015 demand reduction target of 7.3GW.


Draft Energy Efficiency Strategy of the Republic of South Africa
April 2004
                                                                                            5
3.        Targets
3.1      Baseline Statistics

         The energy usage data illustrated in this section has been taken from the Digest of South
         African Energy Statistics, 2000 published by the Department of Minerals and Energy.
         Data concerning energy intensity has been taken from the International Energy Agency’s
         study Energy Balances of OECD countries, published in 2002.

         Primary Energy Supply

         The total primary energy supply to South Africa increased from 3,924PJ in 1993 to
         4,295PJ in 2000, an increase of 9.5%. In 2000 coal contributed 79% of the total national
         primary energy supply, as illustrated in Figure 1, below.


                                                         Renewables
                                   Hydro                    6%      Gas
                                                                          Crude Oil
                           Nuclear <1%                              2%
                                                                            10%
                            3%


                                                                   Coal
                                                                   79%


         Figure 1. 2000 Primary Energy Supply


         Sectoral Usage

         The final end-user energy usage in 2000 was 2,193PJ. The three largest energy-
         consuming sectors were industry, residential and transport. The remaining sectors
         accounted for less than 10% of final energy demand in 2000. Figure 2 depicts the
         sectoral split of final energy use, and excludes “non-energy use” carriers, such as solvents
         and lubricants.


Draft Energy Efficiency Strategy of the Republic of South Africa
April 2004
                                                                                               6
Agriculture                      Other
                                                3%                             1%

                          Transport
                            28%
                                                                                                  Industry
                                                                                                    47%


                                    Residential
                                                                   Commerce
                                      17%
                                                                     4%


         Figure 2. 2000 Final Energy Use by Sector

         Figure 3, below, also refers to 2000 and illustrates the split of final energy use by each
         individual energy carrier. It is of significance to the national Balance of Payments that the
         largest of these, in energy content terms, is petroleum products. Crude oil is South
         Africa’s single largest import, and the vast majority of the downstream products are utilised
         by the Transport Sector.


                          Petroleum                                                          Electricity
                          Products                                                             26%
                            33%


                           Gas
                           2%                                                         Coal
                                                                                      30%
                                                 Other (incl. Biomass)
                                                    9%


         Figure 3. 2000 Final Energy Use by Carrier


Draft Energy Efficiency Strategy of the Republic of South Africa
April 2004
                                                                                                             7
Energy Intensity

         National energy intensity is defined as the ratio of primary energy supply to Gross
         Domestic Product (GDP). South Africa’s energy intensity (energy consumption in terms of
         GDP) is high (see Figure 4) but her energy use per capita is low compared to that of other
         developed counties (see Figure 5). This is due to the low income per capita, the relatively
         low energy intensity of the transport and residential sectors and the high energy intensity
         of mining and minerals processing activities. The industrial/mining sector’s consumption,
         comprising 47% of South Africa’s total energy (see Figure 1), is high compared to other
         countries and this in itself explains why South Africa has a high energy intensity.
         However, it should be borne in mind that energy intensity is not necessarily indicative of
         poor energy efficiency; suffice to say that the industrial/mining sector provides a large
         potential for energy efficiency interventions and energy savings.


                                            50
                                            45
                                            40
                                            35
                                                                                                                                 GDP 2000 ppp
                 PJ/bill US$


                                            30
                                                                                                                                 GDP 2000
                                            25
                                            20
                                            15
                                            10
                                            5
                                            0
                                                 Sw y
                                                       en


                                                                                   na
                                                         a


                                                                                   ce


                                                                                     a

                                                                                     e
                                                         n


                                                                                     y
                                                                                     K


                                                                                     k
                                                                                     a


                                                                                    ia
                                                                  SA
                                                       lia


                                                       a


                                                                                 an


                                                                                  ar
                                                      ad


                                                                                 ny

                                                                                bw
                                                      pa


                                                                                 ric
                                                                                  U


                                                                                 ib
                                                      w
                                           ra


                                                                               an
                                                    ed


                                                                                hi
                                                                 U


                                                                               m


                                                                             am

                                                                              Ke
                                                                               m

                                                                              Af
                                                  an

                                                   Ja

                                                   or


                                                                             ba
                                                                              C
                                        st


                                                                             Fr


                                                                            en
                                                                            er
                                                 N
                                     Au

                                                 C


                                                                            h


                                                                          m
                                                                           N
                                                                          D
                                                                          G

                                                                         ut


                                                                        Zi
                                                                       So


         Figure 4. Energy consumption per GDP for 2000, and GDP for 2000 (purchasing
         power parity)


                                            300
               energy consumed PJ per cap


                                                                                                                                Canada
                                            250
                                                                                                                                         USA
                                            200
                                                                                                                       Norway

                                            150                                                            Australia
                                                                                                     Germany
                                                                                              UK
                                            100
                                                                                      South Africa
                                             50
                                                             Zimbabwe
                                                                    China
                                                     Kenya                  Namibia
                                                 0

                                                                              GDP ppp per cap


         Figure 5. Final energy demand per capita (2000)

Draft Energy Efficiency Strategy of the Republic of South Africa
April 2004
                                                                                                                                               8
The practice of ‘benchmarking’, comparing the energy intensities of different sectors in
         other countries, aids in estimating where reductions in energy use may be achieved in
         South Africa, and thus determining those interventions which have worked internationally
         will be likely to be successful in South Africa.

         The trend over recent years has been for energy consumption in the industrial/mining
         sector to increase at a steady rate, whereas the trend for other sectors has been to remain
         level or even decrease where new, more efficient, technology has been introduced to
         replace old technology eg. private motor cars.

         Climate Change

          At the Rio de Janeiro Earth Summit of 1992 the United Nations Framework Convention on
          Climate Change stated that its fundamental objective was to achieve stabilisation of the
          concentrations of Greenhouse gases (GHGs) in the atmosphere at a level that would
          prevent dangerous anthropogenic interference with the climate system. South Africa
          ratified the Convention in 1997, which enables South Africa to apply for financial
          assistance for climate change related activities from the Global Environmental Facility.

          The Kyoto Protocol (1997) is an agreement under which industrialised countries (Annex 1
          countries) will reduce their combined greenhouse gas emissions by at least 5% compared
          to 1990 levels by the period 2008 to 2012. The Protocol will come into force after it has
          been ratified by at least 55 counties, including Annex 1 parties accounting for at least 55%
          of the total 1990 carbon dioxide emissions in this industrialised group. South Africa
          acceded to the Kyoto Protocol in March 2002. Although the Kyoto Protocol does not
          commit the non-Annex 1 (developing) countries, like South Africa, to any quantified
          emission targets in the first commitment period (2008 to 2012), there is potential for low
          cost emission reduction options in these countries. The Clean Development Mechanism
          provides for trade in certified emission reductions between non-Annex 1 countries and
          Annex 1 countries and thus supports sustainable development with respect to
          greenhouse gas emissions in developing countries while helping Annex 1 countries to
          comply with their commitments under the Kyoto Protocol.
               tonnes carbon dioxide per capita


                                                  25

                                                  20

                                                  15

                                                  10

                                                  5

                                                  0
                                                             a


                                                                                      a


                                                                                                                a
                                                                                                   y
                                                                    na


                                                                                          K


                                                                                                              lia


                                                                                                                    SA
                                                             e


                                                                                     ce
                                                            ia


                                                                                                 an
                                                          ny


                                                                                   ric


                                                                                                             ad
                                                          bw


                                                                                          U
                                                          ib


                                                                                                            ra
                                                                                 an
                                                                 hi


                                                                                                                    U
                                                       am
                                                       Ke


                                                                                Af


                                                                                                 m


                                                                                                         an
                                                       ba


                                                                                                          st
                                                                 C


                                                                               Fr


                                                                                               er


                                                                                                       Au
                                                                                                        C
                                                                              h
                                                    m


                                                     N


                                                                                              G
                                                                            ut
                                                  Zi


                                                                         So


         Figure 6: Carbon Dioxide Emissions per capita (IEA, 2001)

Draft Energy Efficiency Strategy of the Republic of South Africa
April 2004
                                                                                                                         9
As South Africa is by far the largest emitter of GHGs in Africa and one of the most carbon
          emission-intensive countries in the world as shown in figure 6, due to the energy intensive
          economy and high dependence on coal for primary energy, certain energy efficiency
          initiatives have potential for financial support under the Clean Development Mechanism.

3.2      Barriers

         One of the fundamental steps necessary to enable successful implementation of any
         Strategy is the need to understand the barriers confronting it, and how to overcome those.

         Several of the more traditional barriers are self-evident, and are described briefly below.
         In addition to these, however, is a barrier relating to the state of the country itself; the
         argument being that energy efficiency should be a relatively low priority when compared
         with other pressing national issues such as quality of life and education. It is important to
         bear in mind that energy plays an integral part in the solution of these problems, and that
         without clean and affordable energy such issues will be difficult to resolve.

         Energy Pricing

         This is a perceived barrier that stems from South Africa’s historically low unit price of coal
         and electricity, although there has been a gradual and incremental rise in energy prices
         over recent years. This barrier still holds strong amongst the mind-set of many
         commercial and industrial organisations, that argue that medium and high-cost
         interventions cannot be justified due to the lengthy paybacks involved.

         Energy efficiency makes sound economic sense. Although the unit price of energy may
         be low, for the time being, the overall cost to our energy-intensive industries is high. If
         energy efficiency is approached correctly and with the right emphasis, payback on
         investment is frequently less than three years. Education and awareness programmes
         are some of the first steps to take towards overcoming this barrier.

         Lack of knowledge and understanding of Energy Efficiency

         Energy efficiency opportunities are frequently overlooked due to the simple fact that
         industry and other consumers are unaware that they exist. It is the intention of the
         Strategy to enhance awareness in such matters and to bring knowledge and
         understanding into the various sectors. This will be achieved through awareness
         campaigns, demonstration programmes, audits and education, and publicising corporate
         commitment programmes, and public building sector energy efficiency implementation
         initiatives.

         Institutional barriers, and resistance to change

         Institutional barriers often stem from a fear that outsiders will identify previously
         overlooked opportunities, thereby uncovering apparent incompetence. There is also a
         frequently encountered misconception, particularly within industry, that energy efficiency
         will disrupt production processes and that changes should not be made unless absolutely
         necessary.

         It is important to understand that to a large extent these are emotional barriers. An
         approach is required, therefore, that is not only professional and technically competent,
         but also sensitive to such issues.
         Lack of investment confidence


Draft Energy Efficiency Strategy of the Republic of South Africa
April 2004
                                                                                                10
Achieving optimum energy performance sometimes involves the installation of costly plant
         and equipment, and investors may be reluctant to tie-up financial resources in long-term
         projects. Recent history has seen a degree of uncertainty, both nationally and
         internationally, due to the fluctuations in the strength of our currency. This is an ongoing
         problem, and investors should be encouraged to cost all externalities when considering
         energy efficiency investment opportunities. Furthermore, appropriate risk-weightings
         should be attributed to fossil fuel prices when considering plant lifetime running costs. The
         notion of introducing incentives on energy efficient appliances and equipment will be
         considered during the lifetime of this Strategy.

         The practice of “bounded rationality”

         Decision making with limited management resources requires the use of imperfect, or
         incomplete, information and less than fully rational procedures. This is significant as the
         majority of energy consumers currently have imperfect information regarding the range
         and performance of energy efficient products. This fact inevitably results in poor decision-
         making when purchasing goods or specifying equipment.

         It is an intention of the Strategy to enhance the decision-makers’ awareness of issues
         such as running costs, environmental costs, etc. This will be achieved via the adoption of
         appropriate standards, awareness and education, and by the use of instruments such as
         appliance labeling.

3.3      Targets

         To date, only a handful of countries worldwide have set comprehensive targets for energy
         efficiency improvements. These countries include Slovenia, Japan, The Netherlands and
         New Zealand. The World Energy Assessment, published by the UN and the World
         Energy Council, suggests that specific energy usage in industrialised countries could be
         cost-effectively reduced by 35% over a period of 20 years, if accompanied by effective
         policies. In the United States, the Electric Power Research Institute (EPRI) has proposed
         an energy efficiency improvement target of 2% per annum.

         This Strategy provides for the implementation of sector programmes in a three-phase
         approach, timed as follows:
         •       Phase 1: June 2004 to May 2007;
         •       Phase 2: June 2007 to May 2010;
         •       Phase 3: June 2010 to May 2014.

         The broad principle of this phased approach is to initiate actions with rapid returns during
         the early phases. However, it is likely that interventions such as technical standards will
         also be addressed at an early stage to enable the long-term benefits to be maximised.

         This Strategy proposes the following energy efficiency target for South Africa:


                               A Final Energy Demand Reduction of 12% by 2014

         The target stated above is expressed as a percentage reduction against the projected
         national energy usage in 2014. The projected usage is forecast at the present increase in
         economic development and without any additional efficiency interventions. The forecast is
         derived from the Long range Energy Alternatives Planning tool (LEAP) utilised for

Draft Energy Efficiency Strategy of the Republic of South Africa
April 2004
                                                                                               11
developing the National Integrated Energy Plan for South Africa. The baseline scenario is
         similar to the base case scenario of the IEP (‘business-as-usual’) in which the following
         assumptions are made:
               •    Population growth: 2000=44 million, 2014=52,6 million (1,3% per annum)
               •    GDP growth: 2,8% average per annum growth over period
               •    Economic growth: 2,8% over period
               •    Fuel switching limited apart from general increase in electricity consumption in
                    residential sector

         It should be stressed that this target is by no means a mandatory requirement, but rather a
         guideline to aspire to.

         The national target is illustrated further in Figure 7, where final energy demand is shown
         as a total of all sectors and is expressed in Petajoules. The Projected Demand to 2014 is
         as forecast at an annual growth rate of 2,8% per annum. The Target Outcome to 2014 is
         shown assuming that the national target is achieved, and that savings are implemented
         uniformly across the three phases of the Strategy. In actuality it is likely that savings will
         begin to materialise towards the latter stages of Phase 1 and into Phase 2.


                    3500
                                                                          Projected Demand to 2014
                    3000

                    2500
                                                                                Target Outcome to 2014
                    2000
               PJ


                    1500

                    1000

                     500

                       0
                        92
                        93
                        94
                        95
                        96
                        97
                        98
                        99
                        00
                        01
                        02
                        03
                        04
                        05
                        06
                        07
                        08
                        09
                        10
                        11
                        12
                        13
                      19
                      19
                      19
                      19
                      19
                      19
                      19
                      19
                      20
                      20
                      20
                      20
                      20
                      20
                      20
                      20
                      20
                      20
                      20
                      20
                      20
                      20


                                                                   Year


          Figure 7:        Final Energy Demand – Target Outcome to 2014

         The national target is calculated using the individual targets for each economic sector, and
         by weighting these according the sectoral contribution to final demand, as previously
         shown in Figure 2.

         Sectoral targets are based upon the different growth rate elasticities for each sector
         (Energy Efficiency Savings Projections, CaBEERE 2003). Here GDP growth elasticity in
         Industry varies from .25% pa for the pulp and paper industry to 1.87% pa for non-ferrous
         metals, whereas gold mining has a negative growth elasticity of -1.7% pa. Elasticities for

Draft Energy Efficiency Strategy of the Republic of South Africa
April 2004
                                                                                                     12
the other sectors are Commercial Buildings 1.08% pa, Agriculture .45% pa and Transport
         1% pa. The Residential Sector has a 1 to 1 relationship with population growth. The
         Power Sector forecast by Eskom is based on the 2.8% pa GDP growth assumption, so, it
         too, has a 1% pa growth elasticity.


         Review of Targets

         A review of the national and sectoral targets will be undertaken at the end of each phase.
         This review will be carried out by the DME with the objective of assessing progress
         towards targeted outcomes and to address any areas where additional input may be
         required from stakeholders.

         It is important that the targets are seen to be both challenging and achievable. In most
         cases the sectoral targets comprise a conservative estimate of the likely impact of
         technical interventions, coupled with the additional impact of energy management
         initiatives and behavioral changes.

         Industry Sector

                            A Target Final Energy Demand Reduction of 15% by 2014

         The industrial sector is the largest user of energy in South Africa. A relatively high
         theoretical potential for energy saving exists, in the magnitude of 50% of current
         consumption in comparison with international best practice, on a sector-by-sector basis.
         Notwithstanding this, research has shown that a savings potential of at least 11% is
         readily achievable using low-cost to medium-cost technical interventions
         (http://www.actionenergy.org.uk/Action+Energy/AE+Resources/Default.htm). Furthermore,
         an additional 5% - 15% energy saving would be achievable via proven low-cost
         techniques of energy management and good housekeeping. It is considered, therefore,
         that the prescribed target of 15% is realistic and achievable.

         Power Generation Sector

         The issue of targeting energy efficiency improvements within this sector is currently the
         subject of dialogue between the DME and Eskom. It is likely that a sectoral target will be
         developed for the power generation and supply sector following further consultation
         processes. At this stage, however, a realistic target needs to be derived from a detailed
         investigation by Eskom and is therefore omitted here, as is its contribution to the overall
         national target.

         Commercial and Public Building Sector


                            A Target Final Energy Demand Reduction of 15% by 2014

         Although this sector contributes a relatively minor percentage to national energy usage,
         savings here are known to be significant. Research and experience have shown that
         savings through low-cost and medium-cost technical interventions can exceed 25%. In
         order to allow for partial sectoral penetration of technical measures, however, a figure of
         11% has been calculated using detailed modeling analysis. Additionally, a further 4% is
Draft Energy Efficiency Strategy of the Republic of South Africa
April 2004
                                                                                             13
thought to be realistically achievable through managerial intervention and behavioral
         changes.


         Residential Sector


                            A Target Final Energy Demand Reduction of 10% by 2014

         This sector used 360.5 PJ in 2000 in the form of coal (11%), petroleum products (7%),
         biomass (53%) and electricity (29%). The transition towards the use of higher CV fuels
         and a reduction in the use of thermal energy consumption will be driven by energy
         efficiency standards in housing, generally higher standards of living accompanying
         economic growth of 2.8% pa, and the electification programme. The measures outlined
         in the interventions section (see 5.4 Residential Sector Programme); mandatory
         standards, appliance labeling, efficient lighting and standards for non-electric appliances
         such as energy efficient coal stoves, wood stoves and liquid fuel stoves, should be
         comprehensive enough to achieve the goals proposed. However, the sector is very
         diverse, and many energy saving decisions lie at the individual household level, requiring
         an initial investment. Therefore an ongoing public awareness drive will be necessary to
         achieve a saving of 10% by the year 2014, based on a projection from the present
         consumption.

         Transport Sector


                             A Target Final Energy Demand Reduction of 9% by 2014

         Transport is the second largest sectoral consumer of energy and is expected to grow
         considerably in the medium-term. Measures to address energy efficiency will not
         necessarily be easy to implement, as has been the experience internationally where motor
         vehicles have become the main means of transport. The projected savings will, therefore,
         only begin to impact during Phase 2 when planned interventions have been implemented
         fully. The majority of the measures will be regulatory in nature, but in order to be effective
         will rely heavily upon behavioral changes. Such changes are, by experience, the most
         intractable elements to influence.

         A target of 9% has, therefore, been established as a realistic but challenging objective for
         2014. This target has assumed the introduction of a labeling system for vehicle energy
         consumption accompanied by legislation on the ‘fee bate system’, technology upgrade
         leading to more efficient vehicles/turnover in the vehicle park, but has excluded taxi-
         recapitalisation. As the impacts of taxi-recapitalisation may only be evident in the later
         phases of this Strategy the target would be reviewed in Phase 3. The impact of measures
         such as moving road to rail and spatial planning are also difficult to assess at this stage
         and remain interventions with impacts in the long-term.


Draft Energy Efficiency Strategy of the Republic of South Africa
April 2004
                                                                                                14
3.4      Outcomes

         Table 1 summarises outcomes by the eight goal areas of the Strategy, assuming that all
         targets are met. It should be noted that not all goal outcomes are quantifiable at this
         stage, so qualitative commentary is provided against some outcomes.

                                           Table 1. Projected Outcomes by 2014
                        Goal Area                                                     Outcomes
           Goal 1                                    •    Health benefits realised through reduced atmospheric pollution and
           Improve the health of the nation               improved living conditions, in particular a reduction in respiratory-related
                                                          illnesses;
           Goal 2                                    •    Long-term employment opportunities increased by reducing costs in
           Creation of Jobs                               commerce and industry;
                                                     •    Employment opportunities increased within the energy efficiency sector
                                                          and related activities.
           Goal 3                                    •    Access to affordable energy services improved by promoting low energy
           Energy Poverty Alleviation                     alternatives in the marketplace;
                                                     •    Lower energy costs for households by improving domestic energy
                                                          efficiency.
           Goal 4                                    •    Atmospheric pollutant levels reduced by a reduction in fossil fuel
           Reduce local Pollution                         combustion at power stations;
                                                     •    Local atmospheric pollutant levels reduced by a reduction in fossil fuel
                                                          combustion within industry and commerce;
                                                     •    Transport-related atmospheric pollutant levels reduced by a reduction in
                                                          combustion of petroleum products in motor vehicles.
           Goal 5                                    •    National CO2 emissions reduced by improving energy efficiency across all
           Reduce CO2 Emissions                           economic sectors;
           Goal 6                                    •    Improved industrial and commercial profitability by controlling and
           Improve Industrial Competitiveness             minimising energy overheads;
                                                     •    Improved international acceptability of South African products by
                                                          minimising the environmental impacts of their manufacture.
           Goal 7                                    •    Increased national resilience against oil price fluctuations by reducing the
           Increase Energy Security                       country’s dependence upon imported crude oil supplies;
                                                     •    Increased resilience against internal supply disruptions by reducing load
                                                          demands placed upon power distribution systems.
           Goal 8                                    •    Construction of additional power generation plant deferred as far as
           Defer Additional Generation Capacity           practicable by contributing towards Eskom’s 7.3GW peak load reduction
                                                          target for 2015.


3.5         Monitoring & Measurement

         The White Paper on Energy Policy states that:

            “Government will ensure that the necessary resources are made available to establish
            structures, systems and legislation to facilitate the specification, collection, storage,
            maintenance and supply of energy data, and energy-related data, according to the
            requirements of integrated energy planning and international standards.”

         Government must be able to measure the effectiveness and efficiency of measures
         implemented and initiatives put in place for the promotion of energy efficiency, as
         prescribed by Energy Policy, and must sustain this capacity.

         There is a need to establish a system for continuous updating and registration of figures
         related to energy efficiency; in particular, indicators for efficiency measurement. A
         formalised system for collecting, managing data and calculating indicators is necessary for
         monitoring the implementation and success of activities initiated as part of the strategies
         for energy efficiency.     It is DME’s responsibility to establish such a monitoring and

Draft Energy Efficiency Strategy of the Republic of South Africa
April 2004
                                                                                                                              15
verification system and ensure that it is implemented. This is also a compliance measure
         that fulfils requirements by the Draft Energy Bill (section 17 (1) (2)) on the collection of
         energy information.

         The success of such a system will inevitably depend upon using a multi-stakeholder
         approach, and the relevant players are outlined in Section 4.4, Figure 9.

4.        Implementing Instruments
         The Strategy makes use of a range of generic implementing instruments which are
         applied as appropriate to meet specific needs within each Sector Programme. The
         relative maturity of the marketplace will determine which instrument is used where, and
         how. For example, where interventions are seen as novel and may require some
         development, the appropriate instruments may include trials and incentives. By contrast,
         where interventions are already somewhat developed awareness may be the driving
         need.

4.1      Support Mechanisms

         The following paragraphs illustrate and describe the main supporting mechanisms and
         instruments used with each sectoral programme. Such mechanisms are intended to be
         independent of financial and policy instruments.

         Efficiency Standards

         Efficiency standards have been successfully applied overseas and have brought about
         significant improvements in efficiencies. South Africa has a well-developed system of
         standards and codes of practice that, in some cases, may be amended to include
         efficiency aspects without the need to established completely new standards. The Draft
         Energy Bill gives the Minister of Minerals and Energy substantial authority to make
         standards compulsory.

         Mandatory energy efficiency standards will be an important and integral part of the
         Strategy.

         Appliance Labeling

         Energy labeling of appliances is an internationally tried and tested tool to build awareness
         and raising capacity about energy consumption.

         A number of studies, the latest completed as recently 2003, have looked into the feasibility
         of introducing labeling for some household appliances in South Africa. Potential savings
         with labeling or higher efficiency standards are estimated at 3 PJ in 2012.

         The adoption of European Union standards for labeling can be considered, as this has
         already been tested and is widely approved. Furthermore, the success of the EU
         standards in conveying the message of efficiency to a diverse target-group, comprising a
         variety of cultural backgrounds, would be of particularly benefit to South Africa.Mandatory
         appliance labeling for household appliances forms an important element of the Strategy
         and will be promoted and implemented.

         Certification and Accreditation

         The Strategy makes use of several instruments where inspectors or auditors will be
         expected to carry out certain technical functions, or studies. These functions will
         necessarily require a minimum level of technical competence on behalf of the party
Draft Energy Efficiency Strategy of the Republic of South Africa
April 2004
                                                                                              16
concerned. Examples include the certification of energy auditors for buildings and the
         accreditation of inspectors for Efficiency Standards. The outline requirements of relevant
         accreditation procedures will be specified by the DME, professional associations and the
         certification made by SABS.

         It is the intention of the Strategy to help develop such accreditation procedures and to
         enable appropriate certification to be awarded to the relevant aspirants.

         Education, Information and Awareness

         Information and generic awareness are key elements to achieve success in terms of
         changing South Africa into a more energy efficient society. Once laws and regulations are
         established, architects will need guidance (from standards etc) on how to design houses
         according to the new regulations, and plumbers should also have be informed about the
         need to insulate geysers.

         Awareness-raising starts with pre-schooling education and runs through all learning fields
         into the adult education system, under the auspices of the National Qualification
         Framework (NQF) up to level 8. The DME will engage with the institutions responsible for
         education and support, and facilitate the inclusion of appropriate education on energy
         efficiency in the curriculum.

         The DME will strive to ensure that:

         •        Energy Efficiency is taught and examined at all levels in all appropriate subjects, in
                  particular engineering and architecture;

         •        Energy Efficiency is a competence requirement under the NQF training programmes
                  for skilled workers in the relevant construction and buildings services trades

         Research and Technology

         Technological options represent significant potential for energy efficiency improvements
         and, in many instances, are well researched and already developed. However, the
         majority of these technologies are not manufactured locally and require importation. The
         latter point will represent a challenge for the Government, particularly as the drive to
         promote energy efficiency gains momentum.

         The National Energy Research Institute will be funded to carry out a dedicated programme
         of R&D for energy efficiency.

         The Strategy will support appropriate research and the possible adaptation of
         internationally available technologies and processes.

         Regulation

         The historically low unit price of energy, coupled with limited awareness on energy
         savings potential, may result in only modest success arising from voluntary measures and
         other non-legislative instruments. For this reason, regulatory means will be applied to
         achieve further improvements where necessary. Efficiency Standards will have limited
         impact unless made mandatory, and energy audits should be accompanied by an
         obligation to implement, for example, all no-cost recommendations identified. The NER
         will contribute to or develop regulatory measures for guiding reporting and compliance.

         Energy Audits

Draft Energy Efficiency Strategy of the Republic of South Africa
April 2004
                                                                                                 17
Energy audits have internationally been used across all sectors to identify efficiency
         measures that can be implemented in a cost-effective manner. However, to be effective it
         has often required both the audits as well as the implementation of measures to be
         compulsory or to be supported by subsidies.

         The Strategy will promote energy audits as a means of improving efficiency. Studies will
         be undertaken to design ways in which audits will achieve the greatest impact.


         Energy Management Systems

         Energy management enables the formalisation of monitoring, evaluating and targeting
         energy consumption as well as providing sector-specific benchmarking information.
         Within industrial and commercial applications, the concept of energy management must
         also embody other key areas, including Training, Motivation & Awareness, Green
         Accounts (where companies audit the environmental performance of their operation, as
         well as its economic performance), Energy Policy and formalised Monitoring & Targeting
         (M&T). The importance of effective M&T cannot be over-emphasised, as it provides the
         yardstick against which savings are targeted and improvements are measured. Without
         the key information that M&T provides, attempts to save energy within an organisation can
         be frustrating, futile and de-motivating.

         The implementation plan for the Industrial Sector will execute a special project designed to
         develop a monitoring and targeting system in collaboration with the database function at
         the DME.

         The Strategy will support the proliferation of energy management and the establishment of
         necessary information, including the introduction of Monitoring & Targeting and "Green
         accounts".

         Fee Bates

         Fee bates, as envisaged, will be directed toward motor vehicles. The basic principle is
         that levies imposed when licensing less efficient vehicles will be used to cross-subsidise
         the license fees on more efficient vehicles.

         The exact details and methodologies of these schemes are currently being researched,
         and will be implemented in conjunction with Government’s Motor Industry Development
         Plan.

4.2      Policy, Mandate and Governance

         The mandate to govern and undertake energy efficiency initiatives is derived from the
         following documents:

         •       The South African Constitution;
         •       The White Paper on Energy Policy, 1998;
         •       The Municipal Systems Act No. 32 of 2000;
         •       The Electricity Act No. 41 of 1987 (as amended);
         •       The Draft Energy Bill;
         •       The Standards Act;
         •       The Draft Electricity Regulation Bill
Draft Energy Efficiency Strategy of the Republic of South Africa
April 2004
                                                                                              18
The DME will prepare appropriate legislation and regulations for the Governance and
         Implementation of this Energy Efficiency Strategy. The regulations will take into account
         the capacity of the Government to enforce implementation.

         The mandate given by the White Paper on Energy Policy says that the DME should
         promote Energy Efficiency through various means as well as consider the establishment
         of an agency to be instrumental for the Coordination, Leadership and sector capacity
         development for the implementation of Efficiency. Government's present capacity to
         undertake energy efficiency programmes is limited.          Other countries in similar
         circumstances have found the establishment of an agency to be an effective means of
         providing the necessary leadership and capacity to implement programmes.

         The DME will, during the early stages of implementation, finalise and consolidate
         considerations to ensure appropriate leadership in the sector.

4.3      Finance Instruments
         The formulation and implementation of this Strategy is geared towards self-finance,
         positive savings and job creation. The majority of Energy Efficiency improvements will
         materialise through the implementation of standards, regulation and management tools,
         which at the end of the day leads to short pay back periods for the individual enterprises,
         house owners and government.

         Costs related to preparing, for example, regulations may be sourced out of existing
         Government budgets supported by additional external donor funding.

         Costs related to investments in equipment or refurbishing of production flows, houses, etc.
         are to be born by the direct beneficiaries, which is reasonable to expect due to the short
         payback periods. Where payback periods are less favourable, the option to partake in
         other enabling mechanisms should be encouraged. Such mechanisms include the Clean
         Development Mechanism (CDM), developed under the 1997 Kyoto Protocol.

         For Government the real costs to implement this Strategy relate to the massive
         information and coordination requirements – such costs are to some degree flexible and
         therefore, kept at the implementation level rather than the Strategy level.

         At this stage of South Africa’s development it is difficult to justify government subsidies for
         Energy Efficiency when there are many other pressing needs nationwide. However, over
         time fiscal reform may be possible, and eventually other types of incentives may become
         available.
         As an example, the successful implementation of energy efficiency in the electricity sector
         leads to reduction in costs to end users due to deferred generation investments.
         Therefore subsidising energy efficiency to acceleration implementation will prove
         beneficial to all users of electricity. This is the justification of the current subsising of
         energy efficiency projects through the Eskom DSM Fund.


         Financing the Public Sector Implementation Plan

         Presently it appears that some cost effective capital measures in the Public Building
         Sector remain unimplemented because there are no specific budgets to cater for them.
         However, according to National Treasury within the existing Medium-Term Expenditure
         Framework it is possible to transfer operating cost budget items to capital cost budgets on
         the proviso that this is accomplished within the normal cycle of three years. This will
         probably require energy efficiency investments to be spread over several years.
Draft Energy Efficiency Strategy of the Republic of South Africa
April 2004
                                                                                                 19
This presents another enabling instrument for cost effective capital measures with short to
         medium term payback periods. Should this delivery mode prove workable in the Public
         Buildings Sector, there would then be motivation to extend the concept to all State-owned
         enterprises, Provincial and Local Government authorities.
         The introduction of shared savings will also act as an incentive to various departments.
         The intention here is that those departments who implement energy efficient measures will
         be able to utilise part of the savings thereby achieved (the other part of the savings going
         to the implementing company), as with energy service companies in the private sector
         (see next section). National Treasury is in agreement with this approach.

         Energy Service Companies

         The business of an Energy Service Company (ESCO) is to sell energy services. Energy
         management being one of the most common activities with saved energy as the main
         product. The ESCO meets client needs to reduce costs, improve energy efficiency,
         manage risk and enhance competitive edge. The ESCO will typically offer this through a
         package, which includes a comprehensive energy audit service, financing mechanism,
         equipment procurement, and installation and commissioning, operation monitoring and
         performance guarantees.

         Saved energy cost is typically used to meet the implementation cost of saving energy.
         There are several payments options that include lump sum payment or once off payment
         and performance contracting paid through shared savings where a percentage of the cost
         savings are split between owner and the ESCO. This approach can be used to implement
         resource management measures, such as energy management in industrial and
         commercial and even in the residential sectors. The strength of the approach is in the
         delivery of results i.e. actual energy cost savings by the ESCO enabling the customer to
         focus on their core business.
         Although the ESCO concept is not new, it is not yet fully developed in South Africa.
         Players do exist in the marketplace, but they are relatively few and many of them have
         limited experience. As a result a confidence gap exists in the market where customers
         are sceptical and reluctant to use this service delivery mode. This is exacerbated by an
         absence of a well-established performance standard and service provider certification and
         accreditation.
         Despite this, it is accepted that the ESCO model does have an important role to play in the
         delivery of energy management services in South Africa. Indeed Eskom’s own Demand
         Side Management programme uses the ESCO concept as it’s key delivery mechanism.
         There is, therefore, merit in supporting and strengthening this service delivery mode given
         the potential to achieve energy savings at minimum cost to the Fiscus.

         Clean Development Mechanism

         The Kyoto Protocol was adopted at the third Conference of the Parties in 1997. The
         Protocol provides that developed nations accept commitments to limit, or reduce, the
         emission of greenhouse gases according to differentiated targets. For the signatory
         parties, termed Annex 1 countries, this represents an overall reduction of 5% by the period
         2008 to 2012 in relation to their combined emissions of greenhouse gases in 1990. South
         Africa ratified the UNFCCC in August 1997 and acceded to the Kyoto Protocol in March
         2002 as a non-Annex 1 signatory.

         Achieving such goals will result in significant costs to the economies of each Annex 1
         country, and a number of mechanisms were developed to assist these countries to comply
         with their respective targets. One of these mechanisms is the Clean Development

Draft Energy Efficiency Strategy of the Republic of South Africa
April 2004
                                                                                              20
Mechanism, or CDM. The basic principle of the CDM is simple: developed countries can
         invest in low-cost abatement opportunities in developing countries and receive credits for
         the resulting emissions reduction. Such credits would then count towards their own
         abatement targets.

         The CDM can positively contribute towards the sustainability objectives of a developing
         nation by:

         •       Transferring technology and financial resources;
         •       Developing sustainable methods of energy production;
         •       Increasing awareness of energy efficiency and environmental issues;
         •       Alleviating poverty through income and employment generation;
         •       Helping define investment priorities in projects that meet sustainability goals.

         The CDM encourages developing countries to participate by promising that their own
         development priorities will be addressed as part of the package. This recognises that only
         through long-term development will all countries be able to play a role in protecting the
         environment.

         To date, the Kyoto Protocol has not yet been fully ratified and still awaits major signatories
         such as the USA and Russia. There is a risk, therefore, that the enforcement of the
         Protocol may not materialise and that some of the targets set out in this Strategy would
         then need to be reviewed.

         Demand Side Management

         At current energy usage levels and national economic development projections, it is
         estimated that without any interventions to reduce peak electricity demand, there will be a
         need to invest in new power generating capacity by around 2007. As the construction of
         additional generation plant is an extremely costly and lengthy process, Eskom has
         embarked upon a Demand Side Management (DSM) programme in order to defer such an
         investment. The intention is to use a combination of energy efficiency measures, load
         management and negotiated interruptible supplies to move the 2007 deadline back to
         somewhere between 2015 and 2025.

         The DSM provision in Eskom’s current Integrated Energy Plan is for a peak load reduction
         target of 1.37GW by 2015. In addition, ther is an interruptible supply agreement target of
         1.511GW by 2007 and 0.409GW by 2015. This target is likely to change dynamically over
         time in response to the actual requirement for DSM in South Africa. It is also likely to
         change in response to the effectiveness of interruptible supply agreements. Presently,
         however, the load reduction target is comprised of the following elements:
         •       0.81GW from load shifting;
         •       0.56GW from energy efficiency measures.

         Eskom has adopted the ESCO methodology as the key tool to implement the DSM
         process. Energy efficiency and load management projects are implemented and
         managed via a third-party (the ESCO) and savings resulting from the intervention are
         shared between the host site, Eskom and the ESCO in approximately equal proportions.
         Capital funds are currently gathered through supply tariffs and administered by Eskom.
         (The current funding mechanism is under review and discussion between Eskom and
         NER).

Draft Energy Efficiency Strategy of the Republic of South Africa
April 2004
                                                                                                    21
It is acknowledged that this methodology is inherently subject to the constraints and
         barriers previously outlined for ESCOs in the section above. Despite this there are 80
         ESCOs already registered and six projects have been implemented yielding a demand
         reduction of around 1MW. Approximately 30 additional projects, with a combined potential
         saving of some 140MW, have been identified. In addition, approximately 300MW worth of
         potential projects are currently in the investigation stage (as at end of February 2004).

         Energy Pricing

         Following on from the specific policy objectives of the White Paper on Energy Policy
         (1998), energy pricing will be based on an assessment of the full economic, social and
         environmental costs and benefits of policies, plans, programmes and activities of energy
         production and utilisation. That is to say, a process of moving from cross-subsidies
         towards cost-reflective prices will generally be adopted.


4.4      Stakeholders

         The South African energy arena is characterised by a number of diverse role players each
         with a mandate within the fields of energy supply, conversion, efficiency and regulation.
         Only through well co-ordinated initiatives and promotion to activate the different role
         players will South Africa be able to effectively promote energy efficiency.

         The DME will prompt the different stakeholders to take a leading role in their areas of
         responsibility. The means will be information, regulation, promotion, facilitation of an
         enabling capacity development framework, as well as the coordination of knowledge
         and actions where necessary.

         Figure 8 shows how the key stakeholders will be involved in the strategic processes
         described in this document.          Stakeholder relationships are shown against each
         implementing instrument, or focal area, in terms of primary stakeholders and secondary
         stakeholders. Primary stakeholders may be broadly defined as those whose main
         functionality deals directly with the associated focus area. Secondary stakeholders may
         be described as those whose responsibilities partly overlap with a particular focus area, or
         where their involvement would be of an ad hoc nature.

         Figure 9 compares the major roles of the primary stakeholders across the sectoral
         initiatives proposed. These roles are defined in terms of strategic responsibility,
         implementation, regulation and monitoring. The figure also indicates which stakeholders
         will be responsible for the Monitoring and Verification (M&V) of sectoral initiatives, as
         indicated in Section 3.5.


Draft Energy Efficiency Strategy of the Republic of South Africa
April 2004
                                                                                              22
Figure 8. Stakeholder Responsibilities
              Primary Stakeholder
                                                                                                                           Stakeholder Group
              Secondary Stakeholder


                                                                                               DTI, DoH, NDoT
                                                  NER


                                                                                    SARS, NT


                                                                                                                Non-central Govt.


                                                                                                                                                                        CEF


                                                                                                                                                                                                                               Industry Assocs
                                                        Eskom & Utilities


                                                                                                                                                         Energy Users


                                                                                                                                                                              ESCOs
                                                                            SABS


                                                                                                                                    Education Services


                                                                                                                                                                                      Financial Sector


                                                                                                                                                                                                         CDM Services


                                                                                                                                                                                                                        NGOs


                                                                                                                                                                                                                                                 DME
                  Efficiency Standards


                  Appliance Labeling


                  Certification & Accreditation
Instruments


                  Education & Awareness


                  Research & Technology


                  Regulation


                  Energy Audits


                  Energy Management


                  Fee Bates


Policy, Mandate and
Governance
Finance
Figure 9. Sectoral Stakeholder Responsibilities
        Strategy

        Implementation
                                                                                              Stakeholder
        Regulation


                                                  Eskom


                                                                                       NDoT


                                                                                              DPLG


                                                                                                     Motor Industry


                                                                                                                               Local Authorities
                                            NER


                                                                                 DTI


                                                                                                                      NAAMSA


                                                                                                                                                   DoH


                                                                                                                                                         End-users
                                                                          SARS


                                                                                                                                                                     SABS


                                                                                                                                                                            DOPW
                                                            REDs / IPPS


                                                                                                                                                                                   DME
        Monitoring

        Regulator/M&V


                Industry
Non-Transport


                Commerce


                Public Buildings


                Residential


                Power Generation


                General


                Taxi Recapitalisation
Transport


                Fee Bate


                Road-to-Rail                                                           ALL


                Spatial Planning


                Road Traffic Mgt Strategy                                              ALL


                Motor Industry Devt Plan                                         ALL

                                                                                                                                                                                   24
Energy efficiency strategy

More Related Content

What's hot

Energy Webinar Slides Mar 9 Public
Energy Webinar Slides Mar 9 PublicEnergy Webinar Slides Mar 9 Public
Energy Webinar Slides Mar 9 Publicmcleodb
 
Handbook - Malaysia Solar FiT feed-in-tariff - renewable energy - EcoSensa
Handbook - Malaysia Solar FiT feed-in-tariff - renewable energy - EcoSensaHandbook - Malaysia Solar FiT feed-in-tariff - renewable energy - EcoSensa
Handbook - Malaysia Solar FiT feed-in-tariff - renewable energy - EcoSensashrimphead
 
Pulse Energy Webinar - Strategies for Reducing Energy Use on Campus
Pulse Energy Webinar - Strategies for Reducing Energy Use on CampusPulse Energy Webinar - Strategies for Reducing Energy Use on Campus
Pulse Energy Webinar - Strategies for Reducing Energy Use on CampusPulse Energy
 
Standard Offer and Feed-in Tariff Development Lessons Learned
Standard Offer and Feed-in Tariff Development Lessons LearnedStandard Offer and Feed-in Tariff Development Lessons Learned
Standard Offer and Feed-in Tariff Development Lessons Learnedjohndalton
 
Going green with renewable energy and energy efficiency
Going green with renewable energy and energy efficiencyGoing green with renewable energy and energy efficiency
Going green with renewable energy and energy efficiencyGreen Constitutes Sdn Bhd
 
Renewable Energy Technologies for Poverty Alleviation: South Africa
Renewable Energy Technologies for Poverty Alleviation: South Africa  Renewable Energy Technologies for Poverty Alleviation: South Africa
Renewable Energy Technologies for Poverty Alleviation: South Africa QZ1
 
Ashrae Sustainability The Road To Net Zero Gcg
Ashrae Sustainability  The Road To Net Zero GcgAshrae Sustainability  The Road To Net Zero Gcg
Ashrae Sustainability The Road To Net Zero GcgHayley Pallister
 
Renewable Energies Potential in Jamaica
Renewable Energies Potential in Jamaica  Renewable Energies Potential in Jamaica
Renewable Energies Potential in Jamaica QZ1
 
CCXG Oct 2019 Energy Policy and NDCs in Latin America and the Carribean
CCXG Oct 2019 Energy Policy and NDCs in Latin America and the CarribeanCCXG Oct 2019 Energy Policy and NDCs in Latin America and the Carribean
CCXG Oct 2019 Energy Policy and NDCs in Latin America and the CarribeanOECD Environment
 
GC energy & environmental newsletter April 2012
GC energy & environmental newsletter   April 2012GC energy & environmental newsletter   April 2012
GC energy & environmental newsletter April 2012generalcarbon
 
South Africa: Biodiesel and Renewable Energy Technologies For Poverty Allevia...
South Africa: Biodiesel and Renewable Energy Technologies For Poverty Allevia...South Africa: Biodiesel and Renewable Energy Technologies For Poverty Allevia...
South Africa: Biodiesel and Renewable Energy Technologies For Poverty Allevia...QZ1
 
Stephen Palmer, MWH
Stephen Palmer, MWHStephen Palmer, MWH
Stephen Palmer, MWHevzngw
 
Ibm smarter asset management for renewable energy final
Ibm smarter asset management for renewable energy finalIbm smarter asset management for renewable energy final
Ibm smarter asset management for renewable energy finalbenhanley77
 
IRENA REthinking Energy: Renewable Energy and Climate Change
IRENA REthinking Energy: Renewable Energy and Climate ChangeIRENA REthinking Energy: Renewable Energy and Climate Change
IRENA REthinking Energy: Renewable Energy and Climate ChangeSaidh KESSACI
 
Acceleration the utilization of Renewable Energy
Acceleration the utilization of Renewable Energy Acceleration the utilization of Renewable Energy
Acceleration the utilization of Renewable Energy Sampe Purba
 
Greenhouse Gas Performance Standards and Energy Efficiency: Minnesota and the...
Greenhouse Gas Performance Standards and Energy Efficiency: Minnesota and the...Greenhouse Gas Performance Standards and Energy Efficiency: Minnesota and the...
Greenhouse Gas Performance Standards and Energy Efficiency: Minnesota and the...Center for Energy and Environment
 

What's hot (20)

Energy Webinar Slides Mar 9 Public
Energy Webinar Slides Mar 9 PublicEnergy Webinar Slides Mar 9 Public
Energy Webinar Slides Mar 9 Public
 
Handbook - Malaysia Solar FiT feed-in-tariff - renewable energy - EcoSensa
Handbook - Malaysia Solar FiT feed-in-tariff - renewable energy - EcoSensaHandbook - Malaysia Solar FiT feed-in-tariff - renewable energy - EcoSensa
Handbook - Malaysia Solar FiT feed-in-tariff - renewable energy - EcoSensa
 
Syria
SyriaSyria
Syria
 
Pulse Energy Webinar - Strategies for Reducing Energy Use on Campus
Pulse Energy Webinar - Strategies for Reducing Energy Use on CampusPulse Energy Webinar - Strategies for Reducing Energy Use on Campus
Pulse Energy Webinar - Strategies for Reducing Energy Use on Campus
 
Standard Offer and Feed-in Tariff Development Lessons Learned
Standard Offer and Feed-in Tariff Development Lessons LearnedStandard Offer and Feed-in Tariff Development Lessons Learned
Standard Offer and Feed-in Tariff Development Lessons Learned
 
Going green with renewable energy and energy efficiency
Going green with renewable energy and energy efficiencyGoing green with renewable energy and energy efficiency
Going green with renewable energy and energy efficiency
 
Renewable Energy Technologies for Poverty Alleviation: South Africa
Renewable Energy Technologies for Poverty Alleviation: South Africa  Renewable Energy Technologies for Poverty Alleviation: South Africa
Renewable Energy Technologies for Poverty Alleviation: South Africa
 
Ashrae Sustainability The Road To Net Zero Gcg
Ashrae Sustainability  The Road To Net Zero GcgAshrae Sustainability  The Road To Net Zero Gcg
Ashrae Sustainability The Road To Net Zero Gcg
 
Renewable Energies Potential in Jamaica
Renewable Energies Potential in Jamaica  Renewable Energies Potential in Jamaica
Renewable Energies Potential in Jamaica
 
CCXG Oct 2019 Energy Policy and NDCs in Latin America and the Carribean
CCXG Oct 2019 Energy Policy and NDCs in Latin America and the CarribeanCCXG Oct 2019 Energy Policy and NDCs in Latin America and the Carribean
CCXG Oct 2019 Energy Policy and NDCs in Latin America and the Carribean
 
GC energy & environmental newsletter April 2012
GC energy & environmental newsletter   April 2012GC energy & environmental newsletter   April 2012
GC energy & environmental newsletter April 2012
 
Energy Revolution
Energy RevolutionEnergy Revolution
Energy Revolution
 
South Africa: Biodiesel and Renewable Energy Technologies For Poverty Allevia...
South Africa: Biodiesel and Renewable Energy Technologies For Poverty Allevia...South Africa: Biodiesel and Renewable Energy Technologies For Poverty Allevia...
South Africa: Biodiesel and Renewable Energy Technologies For Poverty Allevia...
 
Stephen Palmer, MWH
Stephen Palmer, MWHStephen Palmer, MWH
Stephen Palmer, MWH
 
Ibm smarter asset management for renewable energy final
Ibm smarter asset management for renewable energy finalIbm smarter asset management for renewable energy final
Ibm smarter asset management for renewable energy final
 
IRENA REthinking Energy: Renewable Energy and Climate Change
IRENA REthinking Energy: Renewable Energy and Climate ChangeIRENA REthinking Energy: Renewable Energy and Climate Change
IRENA REthinking Energy: Renewable Energy and Climate Change
 
Acceleration the utilization of Renewable Energy
Acceleration the utilization of Renewable Energy Acceleration the utilization of Renewable Energy
Acceleration the utilization of Renewable Energy
 
Greenhouse Gas Performance Standards and Energy Efficiency: Minnesota and the...
Greenhouse Gas Performance Standards and Energy Efficiency: Minnesota and the...Greenhouse Gas Performance Standards and Energy Efficiency: Minnesota and the...
Greenhouse Gas Performance Standards and Energy Efficiency: Minnesota and the...
 
GS Economy
GS EconomyGS Economy
GS Economy
 
Clean Energy Economy
Clean Energy EconomyClean Energy Economy
Clean Energy Economy
 

Viewers also liked

Energy Conservation Through Green Buildings
Energy Conservation Through Green BuildingsEnergy Conservation Through Green Buildings
Energy Conservation Through Green BuildingsAkshay D Nicator
 
5 tips for Going Green at the Office
5 tips for Going Green at the Office5 tips for Going Green at the Office
5 tips for Going Green at the OfficeSerenity Dental
 
Concepts of green office
Concepts of green officeConcepts of green office
Concepts of green officeMD. AHIDUZZAMAN
 
5 Ways to Go Green in Your Office
5 Ways to Go Green in Your Office5 Ways to Go Green in Your Office
5 Ways to Go Green in Your OfficefireproofINFO
 
The Big Green Crowdsourced Guide
The Big Green Crowdsourced GuideThe Big Green Crowdsourced Guide
The Big Green Crowdsourced GuideAvery UK
 
Office Green Initiative
Office Green Initiative Office Green Initiative
Office Green Initiative andrewrubell
 
Tips To Green The Office & School Plus Canadian Tips
Tips To Green The Office & School Plus Canadian TipsTips To Green The Office & School Plus Canadian Tips
Tips To Green The Office & School Plus Canadian TipsKaayla Canfield
 
presentation on lifi devices
presentation on lifi devices presentation on lifi devices
presentation on lifi devices ibad nauman
 
Energy Efficiency and Conservation Strategy- Patrick Weller, Pacific West Ene...
Energy Efficiency and Conservation Strategy- Patrick Weller, Pacific West Ene...Energy Efficiency and Conservation Strategy- Patrick Weller, Pacific West Ene...
Energy Efficiency and Conservation Strategy- Patrick Weller, Pacific West Ene...Contract Cities
 
Going Paperless: How and Why your office should be green
Going Paperless: How and Why your office should be greenGoing Paperless: How and Why your office should be green
Going Paperless: How and Why your office should be green5i Solutions Inc
 
Green Office Building Services
Green Office Building ServicesGreen Office Building Services
Green Office Building ServicesBartosz Wojenka
 
Energy conservation in industry
Energy conservation in industryEnergy conservation in industry
Energy conservation in industrySameer Kumar Rout
 

Viewers also liked (20)

Energy Conservation Through Green Buildings
Energy Conservation Through Green BuildingsEnergy Conservation Through Green Buildings
Energy Conservation Through Green Buildings
 
Energy conservation ppt
Energy conservation pptEnergy conservation ppt
Energy conservation ppt
 
5 tips for Going Green at the Office
5 tips for Going Green at the Office5 tips for Going Green at the Office
5 tips for Going Green at the Office
 
Concepts of green office
Concepts of green officeConcepts of green office
Concepts of green office
 
5 Ways to Go Green in Your Office
5 Ways to Go Green in Your Office5 Ways to Go Green in Your Office
5 Ways to Go Green in Your Office
 
The Big Green Crowdsourced Guide
The Big Green Crowdsourced GuideThe Big Green Crowdsourced Guide
The Big Green Crowdsourced Guide
 
Office Green Initiative
Office Green Initiative Office Green Initiative
Office Green Initiative
 
Green Office Guide Pdf
Green Office Guide PdfGreen Office Guide Pdf
Green Office Guide Pdf
 
Tips To Green The Office & School Plus Canadian Tips
Tips To Green The Office & School Plus Canadian TipsTips To Green The Office & School Plus Canadian Tips
Tips To Green The Office & School Plus Canadian Tips
 
A Green Office
A Green OfficeA Green Office
A Green Office
 
Green office tips
Green office tipsGreen office tips
Green office tips
 
presentation on lifi devices
presentation on lifi devices presentation on lifi devices
presentation on lifi devices
 
Energy Efficiency and Conservation Strategy- Patrick Weller, Pacific West Ene...
Energy Efficiency and Conservation Strategy- Patrick Weller, Pacific West Ene...Energy Efficiency and Conservation Strategy- Patrick Weller, Pacific West Ene...
Energy Efficiency and Conservation Strategy- Patrick Weller, Pacific West Ene...
 
M.Tech Presentation(Design, Growth & Fabrication of Solar Cell)
M.Tech Presentation(Design, Growth & Fabrication of Solar Cell)M.Tech Presentation(Design, Growth & Fabrication of Solar Cell)
M.Tech Presentation(Design, Growth & Fabrication of Solar Cell)
 
Going Paperless: How and Why your office should be green
Going Paperless: How and Why your office should be greenGoing Paperless: How and Why your office should be green
Going Paperless: How and Why your office should be green
 
Green Office Building Services
Green Office Building ServicesGreen Office Building Services
Green Office Building Services
 
Nano-electronics
Nano-electronicsNano-electronics
Nano-electronics
 
Quantum Dots
Quantum DotsQuantum Dots
Quantum Dots
 
Energy conservation in industry
Energy conservation in industryEnergy conservation in industry
Energy conservation in industry
 
Quantum dots ppt
Quantum dots pptQuantum dots ppt
Quantum dots ppt
 

Similar to Energy efficiency strategy

ENERGY EFFICIENCY POLICY REVIEW & RECOMMENDATIONS TO EE SUMMIT ABUJA NOV 18 ...
ENERGY EFFICIENCY POLICY REVIEW & RECOMMENDATIONS TO EE SUMMIT ABUJA NOV  18 ...ENERGY EFFICIENCY POLICY REVIEW & RECOMMENDATIONS TO EE SUMMIT ABUJA NOV  18 ...
ENERGY EFFICIENCY POLICY REVIEW & RECOMMENDATIONS TO EE SUMMIT ABUJA NOV 18 ...Benjamin Ogbalor
 
Environment Friendly Technology
Environment Friendly TechnologyEnvironment Friendly Technology
Environment Friendly TechnologyProbodh Mallick
 
Fact sheet on the cem's appliance efficiency initiative (sead)
Fact sheet on the cem's appliance efficiency initiative (sead)Fact sheet on the cem's appliance efficiency initiative (sead)
Fact sheet on the cem's appliance efficiency initiative (sead)Christina Parmionova
 
MIDA networking session on clean technologies-21.2.2013
MIDA networking session on clean technologies-21.2.2013MIDA networking session on clean technologies-21.2.2013
MIDA networking session on clean technologies-21.2.2013ZAINI ABDUL WAHAB
 
Reducing energy intensity of the Indian economy, Saurabh Diddi, Bureau of Ene...
Reducing energy intensity of the Indian economy, Saurabh Diddi, Bureau of Ene...Reducing energy intensity of the Indian economy, Saurabh Diddi, Bureau of Ene...
Reducing energy intensity of the Indian economy, Saurabh Diddi, Bureau of Ene...ESD UNU-IAS
 
Energy policy and development in zambia
Energy policy and development in zambiaEnergy policy and development in zambia
Energy policy and development in zambiaBusiness Finland
 
Session3 re situation_in_palestine
Session3 re situation_in_palestineSession3 re situation_in_palestine
Session3 re situation_in_palestineRCREEE
 
Renewable Energy Policy Mechanisms and Investment Opportunities - Mylene Capo...
Renewable Energy Policy Mechanisms and Investment Opportunities - Mylene Capo...Renewable Energy Policy Mechanisms and Investment Opportunities - Mylene Capo...
Renewable Energy Policy Mechanisms and Investment Opportunities - Mylene Capo...OECD Environment
 
Energy conservation Act 2001.pptx
Energy conservation Act 2001.pptxEnergy conservation Act 2001.pptx
Energy conservation Act 2001.pptxssuserca5764
 
Ee inidcators for_rcreee_member_states neeap workshop 2011
Ee inidcators for_rcreee_member_states neeap workshop 2011Ee inidcators for_rcreee_member_states neeap workshop 2011
Ee inidcators for_rcreee_member_states neeap workshop 2011RCREEE
 
Energy generation report. final 10 oct 14pptx...Philippine Energy Plan 2012 -...
Energy generation report. final 10 oct 14pptx...Philippine Energy Plan 2012 -...Energy generation report. final 10 oct 14pptx...Philippine Energy Plan 2012 -...
Energy generation report. final 10 oct 14pptx...Philippine Energy Plan 2012 -...alex regado
 
Introduction of the project
Introduction of the projectIntroduction of the project
Introduction of the projectRCREEE
 
Towards a more sustainable energy economy
Towards a more sustainable energy economyTowards a more sustainable energy economy
Towards a more sustainable energy economyRCREEE
 
Innovative Policy Measures to Maximise climate benefits during HCFC phase out...
Innovative Policy Measures to Maximise climate benefits during HCFC phase out...Innovative Policy Measures to Maximise climate benefits during HCFC phase out...
Innovative Policy Measures to Maximise climate benefits during HCFC phase out...UNEP OzonAction
 
Introduction to Energy Efficiency Industry for Malaysians
Introduction to Energy Efficiency Industry for MalaysiansIntroduction to Energy Efficiency Industry for Malaysians
Introduction to Energy Efficiency Industry for MalaysiansZAINI ABDUL WAHAB
 
Session3 RE_ situation_in_egypt
Session3 RE_ situation_in_egyptSession3 RE_ situation_in_egypt
Session3 RE_ situation_in_egyptRCREEE
 

Similar to Energy efficiency strategy (20)

ENERGY EFFICIENCY POLICY REVIEW & RECOMMENDATIONS TO EE SUMMIT ABUJA NOV 18 ...
ENERGY EFFICIENCY POLICY REVIEW & RECOMMENDATIONS TO EE SUMMIT ABUJA NOV  18 ...ENERGY EFFICIENCY POLICY REVIEW & RECOMMENDATIONS TO EE SUMMIT ABUJA NOV  18 ...
ENERGY EFFICIENCY POLICY REVIEW & RECOMMENDATIONS TO EE SUMMIT ABUJA NOV 18 ...
 
Environment Friendly Technology
Environment Friendly TechnologyEnvironment Friendly Technology
Environment Friendly Technology
 
Fact sheet on the cem's appliance efficiency initiative (sead)
Fact sheet on the cem's appliance efficiency initiative (sead)Fact sheet on the cem's appliance efficiency initiative (sead)
Fact sheet on the cem's appliance efficiency initiative (sead)
 
MIDA networking session on clean technologies-21.2.2013
MIDA networking session on clean technologies-21.2.2013MIDA networking session on clean technologies-21.2.2013
MIDA networking session on clean technologies-21.2.2013
 
[2] Keynote presentation
[2] Keynote presentation[2] Keynote presentation
[2] Keynote presentation
 
Reducing energy intensity of the Indian economy, Saurabh Diddi, Bureau of Ene...
Reducing energy intensity of the Indian economy, Saurabh Diddi, Bureau of Ene...Reducing energy intensity of the Indian economy, Saurabh Diddi, Bureau of Ene...
Reducing energy intensity of the Indian economy, Saurabh Diddi, Bureau of Ene...
 
Energy policy and development in zambia
Energy policy and development in zambiaEnergy policy and development in zambia
Energy policy and development in zambia
 
Session3 re situation_in_palestine
Session3 re situation_in_palestineSession3 re situation_in_palestine
Session3 re situation_in_palestine
 
Renewable Energy Policy Mechanisms and Investment Opportunities - Mylene Capo...
Renewable Energy Policy Mechanisms and Investment Opportunities - Mylene Capo...Renewable Energy Policy Mechanisms and Investment Opportunities - Mylene Capo...
Renewable Energy Policy Mechanisms and Investment Opportunities - Mylene Capo...
 
Energy conservation Act 2001.pptx
Energy conservation Act 2001.pptxEnergy conservation Act 2001.pptx
Energy conservation Act 2001.pptx
 
Ee inidcators for_rcreee_member_states neeap workshop 2011
Ee inidcators for_rcreee_member_states neeap workshop 2011Ee inidcators for_rcreee_member_states neeap workshop 2011
Ee inidcators for_rcreee_member_states neeap workshop 2011
 
Report Energy Efficiency in India: PAT Scheme - The Way Ahead
Report Energy Efficiency in India: PAT Scheme - The Way AheadReport Energy Efficiency in India: PAT Scheme - The Way Ahead
Report Energy Efficiency in India: PAT Scheme - The Way Ahead
 
Energy generation report. final 10 oct 14pptx...Philippine Energy Plan 2012 -...
Energy generation report. final 10 oct 14pptx...Philippine Energy Plan 2012 -...Energy generation report. final 10 oct 14pptx...Philippine Energy Plan 2012 -...
Energy generation report. final 10 oct 14pptx...Philippine Energy Plan 2012 -...
 
Introduction of the project
Introduction of the projectIntroduction of the project
Introduction of the project
 
Towards a more sustainable energy economy
Towards a more sustainable energy economyTowards a more sustainable energy economy
Towards a more sustainable energy economy
 
Frank Gorke, Massachusetts Department of Energy Resources
Frank Gorke, Massachusetts Department of Energy ResourcesFrank Gorke, Massachusetts Department of Energy Resources
Frank Gorke, Massachusetts Department of Energy Resources
 
Innovative Policy Measures to Maximise climate benefits during HCFC phase out...
Innovative Policy Measures to Maximise climate benefits during HCFC phase out...Innovative Policy Measures to Maximise climate benefits during HCFC phase out...
Innovative Policy Measures to Maximise climate benefits during HCFC phase out...
 
Renewable energy-masterplan-february-2019
Renewable energy-masterplan-february-2019Renewable energy-masterplan-february-2019
Renewable energy-masterplan-february-2019
 
Introduction to Energy Efficiency Industry for Malaysians
Introduction to Energy Efficiency Industry for MalaysiansIntroduction to Energy Efficiency Industry for Malaysians
Introduction to Energy Efficiency Industry for Malaysians
 
Session3 RE_ situation_in_egypt
Session3 RE_ situation_in_egyptSession3 RE_ situation_in_egypt
Session3 RE_ situation_in_egypt
 

More from cenafrica

Schlenker.lobell.2010.erl 2
Schlenker.lobell.2010.erl 2Schlenker.lobell.2010.erl 2
Schlenker.lobell.2010.erl 2cenafrica
 
Lobell etal 2012_nclimate1356
Lobell etal 2012_nclimate1356Lobell etal 2012_nclimate1356
Lobell etal 2012_nclimate1356cenafrica
 
Lobell burke erl_2008-1
Lobell burke erl_2008-1Lobell burke erl_2008-1
Lobell burke erl_2008-1cenafrica
 
Battisti.2009.science
Battisti.2009.scienceBattisti.2009.science
Battisti.2009.sciencecenafrica
 
Schlenker.lobell.2010.erl
Schlenker.lobell.2010.erlSchlenker.lobell.2010.erl
Schlenker.lobell.2010.erlcenafrica
 
Fiddling with soil_carbon_markets
Fiddling with soil_carbon_marketsFiddling with soil_carbon_markets
Fiddling with soil_carbon_marketscenafrica
 
Increasing africa’s-share-of-the-global-carbon-trade-mitigating-population-pr...
Increasing africa’s-share-of-the-global-carbon-trade-mitigating-population-pr...Increasing africa’s-share-of-the-global-carbon-trade-mitigating-population-pr...
Increasing africa’s-share-of-the-global-carbon-trade-mitigating-population-pr...cenafrica
 
Montpellier panel report 2012
Montpellier panel report 2012Montpellier panel report 2012
Montpellier panel report 2012cenafrica
 
Project abstract 2
Project abstract 2Project abstract 2
Project abstract 2cenafrica
 

More from cenafrica (20)

Schlenker.lobell.2010.erl 2
Schlenker.lobell.2010.erl 2Schlenker.lobell.2010.erl 2
Schlenker.lobell.2010.erl 2
 
Lobell etal 2012_nclimate1356
Lobell etal 2012_nclimate1356Lobell etal 2012_nclimate1356
Lobell etal 2012_nclimate1356
 
Lobell burke erl_2008-1
Lobell burke erl_2008-1Lobell burke erl_2008-1
Lobell burke erl_2008-1
 
Battisti.2009.science
Battisti.2009.scienceBattisti.2009.science
Battisti.2009.science
 
Schlenker.lobell.2010.erl
Schlenker.lobell.2010.erlSchlenker.lobell.2010.erl
Schlenker.lobell.2010.erl
 
Oc72
Oc72Oc72
Oc72
 
Fiddling with soil_carbon_markets
Fiddling with soil_carbon_marketsFiddling with soil_carbon_markets
Fiddling with soil_carbon_markets
 
Kyoto
KyotoKyoto
Kyoto
 
Increasing africa’s-share-of-the-global-carbon-trade-mitigating-population-pr...
Increasing africa’s-share-of-the-global-carbon-trade-mitigating-population-pr...Increasing africa’s-share-of-the-global-carbon-trade-mitigating-population-pr...
Increasing africa’s-share-of-the-global-carbon-trade-mitigating-population-pr...
 
Increasing africa’s-share-of-the-global-carbon-trade-mitigating-population-pr...
Increasing africa’s-share-of-the-global-carbon-trade-mitigating-population-pr...Increasing africa’s-share-of-the-global-carbon-trade-mitigating-population-pr...
Increasing africa’s-share-of-the-global-carbon-trade-mitigating-population-pr...
 
Redd
ReddRedd
Redd
 
Redd
ReddRedd
Redd
 
Redd
ReddRedd
Redd
 
Montpellier panel report 2012
Montpellier panel report 2012Montpellier panel report 2012
Montpellier panel report 2012
 
Project abstract 2
Project abstract 2Project abstract 2
Project abstract 2
 
Mtui
MtuiMtui
Mtui
 
Rb15 20
Rb15 20Rb15 20
Rb15 20
 
Fulltext
FulltextFulltext
Fulltext
 
Naro
NaroNaro
Naro
 

Recently uploaded

Connect Wave/ connectwave Pitch Deck Presentation
Connect Wave/ connectwave Pitch Deck PresentationConnect Wave/ connectwave Pitch Deck Presentation
Connect Wave/ connectwave Pitch Deck PresentationSlibray Presentation
 
"ML in Production",Oleksandr Bagan
"ML in Production",Oleksandr Bagan"ML in Production",Oleksandr Bagan
"ML in Production",Oleksandr BaganFwdays
 
My Hashitalk Indonesia April 2024 Presentation
My Hashitalk Indonesia April 2024 PresentationMy Hashitalk Indonesia April 2024 Presentation
My Hashitalk Indonesia April 2024 PresentationRidwan Fadjar
 
Artificial intelligence in the post-deep learning era
Artificial intelligence in the post-deep learning eraArtificial intelligence in the post-deep learning era
Artificial intelligence in the post-deep learning eraDeakin University
 
Vertex AI Gemini Prompt Engineering Tips
Vertex AI Gemini Prompt Engineering TipsVertex AI Gemini Prompt Engineering Tips
Vertex AI Gemini Prompt Engineering TipsMiki Katsuragi
 
Dev Dives: Streamline document processing with UiPath Studio Web
Dev Dives: Streamline document processing with UiPath Studio WebDev Dives: Streamline document processing with UiPath Studio Web
Dev Dives: Streamline document processing with UiPath Studio WebUiPathCommunity
 
Tampa BSides - Chef's Tour of Microsoft Security Adoption Framework (SAF)
Tampa BSides - Chef's Tour of Microsoft Security Adoption Framework (SAF)Tampa BSides - Chef's Tour of Microsoft Security Adoption Framework (SAF)
Tampa BSides - Chef's Tour of Microsoft Security Adoption Framework (SAF)Mark Simos
 
SIP trunking in Janus @ Kamailio World 2024
SIP trunking in Janus @ Kamailio World 2024SIP trunking in Janus @ Kamailio World 2024
SIP trunking in Janus @ Kamailio World 2024Lorenzo Miniero
 
Are Multi-Cloud and Serverless Good or Bad?
Are Multi-Cloud and Serverless Good or Bad?Are Multi-Cloud and Serverless Good or Bad?
Are Multi-Cloud and Serverless Good or Bad?Mattias Andersson
 
Transcript: New from BookNet Canada for 2024: BNC BiblioShare - Tech Forum 2024
Transcript: New from BookNet Canada for 2024: BNC BiblioShare - Tech Forum 2024Transcript: New from BookNet Canada for 2024: BNC BiblioShare - Tech Forum 2024
Transcript: New from BookNet Canada for 2024: BNC BiblioShare - Tech Forum 2024BookNet Canada
 
"Debugging python applications inside k8s environment", Andrii Soldatenko
"Debugging python applications inside k8s environment", Andrii Soldatenko"Debugging python applications inside k8s environment", Andrii Soldatenko
"Debugging python applications inside k8s environment", Andrii SoldatenkoFwdays
 
Nell’iperspazio con Rocket: il Framework Web di Rust!
Nell’iperspazio con Rocket: il Framework Web di Rust!Nell’iperspazio con Rocket: il Framework Web di Rust!
Nell’iperspazio con Rocket: il Framework Web di Rust!Commit University
 
Integration and Automation in Practice: CI/CD in Mule Integration and Automat...
Integration and Automation in Practice: CI/CD in Mule Integration and Automat...Integration and Automation in Practice: CI/CD in Mule Integration and Automat...
Integration and Automation in Practice: CI/CD in Mule Integration and Automat...Patryk Bandurski
 
My INSURER PTE LTD - Insurtech Innovation Award 2024
My INSURER PTE LTD - Insurtech Innovation Award 2024My INSURER PTE LTD - Insurtech Innovation Award 2024
My INSURER PTE LTD - Insurtech Innovation Award 2024The Digital Insurer
 
Gen AI in Business - Global Trends Report 2024.pdf
Gen AI in Business - Global Trends Report 2024.pdfGen AI in Business - Global Trends Report 2024.pdf
Gen AI in Business - Global Trends Report 2024.pdfAddepto
 
CloudStudio User manual (basic edition):
CloudStudio User manual (basic edition):CloudStudio User manual (basic edition):
CloudStudio User manual (basic edition):comworks
 
APIForce Zurich 5 April Automation LPDG
APIForce Zurich 5 April  Automation LPDGAPIForce Zurich 5 April  Automation LPDG
APIForce Zurich 5 April Automation LPDGMarianaLemus7
 
"Federated learning: out of reach no matter how close",Oleksandr Lapshyn
"Federated learning: out of reach no matter how close",Oleksandr Lapshyn"Federated learning: out of reach no matter how close",Oleksandr Lapshyn
"Federated learning: out of reach no matter how close",Oleksandr LapshynFwdays
 
Unblocking The Main Thread Solving ANRs and Frozen Frames
Unblocking The Main Thread Solving ANRs and Frozen FramesUnblocking The Main Thread Solving ANRs and Frozen Frames
Unblocking The Main Thread Solving ANRs and Frozen FramesSinan KOZAK
 
Pigging Solutions in Pet Food Manufacturing
Pigging Solutions in Pet Food ManufacturingPigging Solutions in Pet Food Manufacturing
Pigging Solutions in Pet Food ManufacturingPigging Solutions
 

Recently uploaded (20)

Connect Wave/ connectwave Pitch Deck Presentation
Connect Wave/ connectwave Pitch Deck PresentationConnect Wave/ connectwave Pitch Deck Presentation
Connect Wave/ connectwave Pitch Deck Presentation
 
"ML in Production",Oleksandr Bagan
"ML in Production",Oleksandr Bagan"ML in Production",Oleksandr Bagan
"ML in Production",Oleksandr Bagan
 
My Hashitalk Indonesia April 2024 Presentation
My Hashitalk Indonesia April 2024 PresentationMy Hashitalk Indonesia April 2024 Presentation
My Hashitalk Indonesia April 2024 Presentation
 
Artificial intelligence in the post-deep learning era
Artificial intelligence in the post-deep learning eraArtificial intelligence in the post-deep learning era
Artificial intelligence in the post-deep learning era
 
Vertex AI Gemini Prompt Engineering Tips
Vertex AI Gemini Prompt Engineering TipsVertex AI Gemini Prompt Engineering Tips
Vertex AI Gemini Prompt Engineering Tips
 
Dev Dives: Streamline document processing with UiPath Studio Web
Dev Dives: Streamline document processing with UiPath Studio WebDev Dives: Streamline document processing with UiPath Studio Web
Dev Dives: Streamline document processing with UiPath Studio Web
 
Tampa BSides - Chef's Tour of Microsoft Security Adoption Framework (SAF)
Tampa BSides - Chef's Tour of Microsoft Security Adoption Framework (SAF)Tampa BSides - Chef's Tour of Microsoft Security Adoption Framework (SAF)
Tampa BSides - Chef's Tour of Microsoft Security Adoption Framework (SAF)
 
SIP trunking in Janus @ Kamailio World 2024
SIP trunking in Janus @ Kamailio World 2024SIP trunking in Janus @ Kamailio World 2024
SIP trunking in Janus @ Kamailio World 2024
 
Are Multi-Cloud and Serverless Good or Bad?
Are Multi-Cloud and Serverless Good or Bad?Are Multi-Cloud and Serverless Good or Bad?
Are Multi-Cloud and Serverless Good or Bad?
 
Transcript: New from BookNet Canada for 2024: BNC BiblioShare - Tech Forum 2024
Transcript: New from BookNet Canada for 2024: BNC BiblioShare - Tech Forum 2024Transcript: New from BookNet Canada for 2024: BNC BiblioShare - Tech Forum 2024
Transcript: New from BookNet Canada for 2024: BNC BiblioShare - Tech Forum 2024
 
"Debugging python applications inside k8s environment", Andrii Soldatenko
"Debugging python applications inside k8s environment", Andrii Soldatenko"Debugging python applications inside k8s environment", Andrii Soldatenko
"Debugging python applications inside k8s environment", Andrii Soldatenko
 
Nell’iperspazio con Rocket: il Framework Web di Rust!
Nell’iperspazio con Rocket: il Framework Web di Rust!Nell’iperspazio con Rocket: il Framework Web di Rust!
Nell’iperspazio con Rocket: il Framework Web di Rust!
 
Integration and Automation in Practice: CI/CD in Mule Integration and Automat...
Integration and Automation in Practice: CI/CD in Mule Integration and Automat...Integration and Automation in Practice: CI/CD in Mule Integration and Automat...
Integration and Automation in Practice: CI/CD in Mule Integration and Automat...
 
My INSURER PTE LTD - Insurtech Innovation Award 2024
My INSURER PTE LTD - Insurtech Innovation Award 2024My INSURER PTE LTD - Insurtech Innovation Award 2024
My INSURER PTE LTD - Insurtech Innovation Award 2024
 
Gen AI in Business - Global Trends Report 2024.pdf
Gen AI in Business - Global Trends Report 2024.pdfGen AI in Business - Global Trends Report 2024.pdf
Gen AI in Business - Global Trends Report 2024.pdf
 
CloudStudio User manual (basic edition):
CloudStudio User manual (basic edition):CloudStudio User manual (basic edition):
CloudStudio User manual (basic edition):
 
APIForce Zurich 5 April Automation LPDG
APIForce Zurich 5 April  Automation LPDGAPIForce Zurich 5 April  Automation LPDG
APIForce Zurich 5 April Automation LPDG
 
"Federated learning: out of reach no matter how close",Oleksandr Lapshyn
"Federated learning: out of reach no matter how close",Oleksandr Lapshyn"Federated learning: out of reach no matter how close",Oleksandr Lapshyn
"Federated learning: out of reach no matter how close",Oleksandr Lapshyn
 
Unblocking The Main Thread Solving ANRs and Frozen Frames
Unblocking The Main Thread Solving ANRs and Frozen FramesUnblocking The Main Thread Solving ANRs and Frozen Frames
Unblocking The Main Thread Solving ANRs and Frozen Frames
 
Pigging Solutions in Pet Food Manufacturing
Pigging Solutions in Pet Food ManufacturingPigging Solutions in Pet Food Manufacturing
Pigging Solutions in Pet Food Manufacturing
 

Energy efficiency strategy

  • 1. Draft Energy Efficiency Strategy of the Republic of South Africa Department of Minerals and Energy April 2004
  • 2. Foreword In South Africa we take energy for granted, with the consequence that our energy consumption is higher than it should be. Indeed, our country’s economy is largely based on minerals extraction and processing which is by its nature very energy- intensive. Whilst our historically low electricity price has contributed towards a competitive position, it has also meant that there has been little incentive to save electricity. So in many respects we start with a clean slate with little energy efficiency measures having taken place, with the exception of many years of work by universities and other research institutions that have pointed the way. The White Paper on Energy Policy (1998) recognized that standards and appliance labeling should be the first measures to put in place in implementing energy efficiency. Indeed such prescriptive-type measures provide the framework on which any energy efficiency Strategy is based. At the same time consumers of energy also need to perceive the cost-benefits they can derive from energy efficiency measures and it is here that demonstrations and case studies are essential. In South Africa Government is taking the lead by using Public Buildings as an example. Cabinet has approved the implementation of a flagship programme of energy efficient measures in National Government Buildings in the imminent future. Recent initiatives in Government offices, where efficient lighting and new energy management measures have been introduced, have revealed significant savings in electricity costs to date. Retrofitting where higher consumption appliances are currently used such as air- conditioning/heating systems, should realise even greater savings. The allied Commercial Building Sector is an area for potential improvement given the rapid increase in office construction. The Industrial and Mining Sectors are the heaviest users of energy, accounting for more than two-thirds of our national electricity usage. Here lies the potential for the largest savings by replacing old technologies with new, and by employing best energy management practice. The Transport Sector uses three-quarters of South Africa’s petroleum products, making it an obvious place to implement measures to improve efficiency. Standards for energy efficient cars, vehicles with lower emissions, the introduction of licensing differentials according to engine efficiency (fee bate), and roadworthy tests would be among the first measures to implement. The Residential sector has great potential for energy savings given the National Housing Programme, since building design is the major factor determining the energy use of a household. Perhaps the most neglected area for implementation is the promotion of public awareness about the costs and benefits of energy efficiency. Major energy savings can only be achieved through changes in people’s behaviour, and that depends on informing them about what options exist. The World Summit on Sustainable Development (2002) sensitised the nation about the impact that energy use has on the World’s weather systems. In this era of climate change South Africa needs to take more urgent measures to reduce energy usage than in the past. It is hoped that this Energy Efficiency Strategy will provide a blueprint for this venture. PUMZILE MLAMO-NGCUKA Minister of Minerals and Energy Draft Energy Efficiency Strategy of the Republic of South Africa April 2004 i
  • 3. Executive Summary This is the first Energy Efficiency Strategy for South Africa. It is the first consolidated Governmental document geared towards the development and implementation of energy efficiency practices in this country. The Strategy takes its mandate from the White Paper on Energy Policy, published in 1998, and links energy sector development with national socio-economic development plans. In addition, it provides clear and practical guidelines for the implementation of efficient practices within our economy, including the setting of governance structures for activity development, promotion and coordination. This Strategy allows for the immediate implementation of low-cost and no-cost interventions, as well as those higher-cost measures with short payback periods. These will be followed by medium-term and longer-term investment opportunities in energy efficiency. The Strategy acknowledges that there exists significant potential for energy efficiency improvements across all sectors of our national economy. The vision of the Strategy is to contribute towards affordable energy for all, and to minimize the effects of energy usage upon human health and the environment. This will be achieved by encouraging sustainable energy development and energy use through efficient practices. The three cornerstones of sustainable development are embraced within the strategic goals of this document, these being environmental, social and economic sustainability. The Strategy sets a national target for energy efficiency improvement of 12% by 2014. This target is expressed in relation to the forecast national energy demand at that time, and therefore allows for current expectations of economic growth. It is accepted that this target will be challenging, but at the same time it is considered to be readily achievable through the means described within the following pages. Energy efficiency improvements will be achieved largely via enabling instruments and interventions. These will include inter alia economic and legislative means, efficiency labels and performance standards, energy management activities and energy audits, as well as the promotion of efficient practices. The Strategy will cover all energy-using sectors and will be implemented through Sectoral Implementation Plans as outlined within. Systems will be put into place in order to periodically monitor progress against the target that will be reviewed at the end of each phase. Draft Energy Efficiency Strategy of the Republic of South Africa April 2004 ii
  • 4. Definitions and Terminology Appliance Labeling Design and provision of consumer information by labels that advise on the minimum energy performance of appliances CaBEERE Capacity Building in Energy Efficiency and Renewable Energy Project CDM Clean Development Mechanism CEF Central Energy Fund CFL Compact Fluorescent Lamp CO2 Carbon Dioxide CSIR Council for Scientific & Industrial Research CV Calorific Value DME Department of Minerals and Energy DNA Designated National Authority DoH Department of Housing DTI Department of Trade and Industry DSM Demand Side Management EE Energy Efficiency Energy Intensity Energy use per unit of output or activity ESCO Energy Service Company GW Gigawatt (109 Watts) unit of electric power HVAC Heating, Ventilation and Air Conditioning IEP Integrated Energy Plan NER National Electricity Regulator NOx Oxides of Nitrogen PetroSA Petroleum, Oil and Gas Corporation of South Africa PJ Petajoule (1015 Joules) unit of energy RDP Reconstruction and Development Programme REDs Regional Electricity Distributors SABS South African Bureau of Standards SAEDES South Africa Energy and Demand Efficiency Standard SO2 Sulphur Dioxide UNIDO United Nations Industrial Development Organisation VSD Variable Speed Drives Draft Energy Efficiency Strategy of the Republic of South Africa April 2004 iii
  • 5. Table of Contents 1. Introduction ........................................................................1 1.1 Why do we need an Energy Efficiency Strategy?------------------------ 1 1.2 The Status Quo ---------------------------------------------------------------------- 1 1.3 The Strategic Process------------------------------------------------------------- 2 2. Vision and Goals................................................................4 3. Targets ................................................................................6 3.1 Baseline Statistics------------------------------------------------------------------ 6 3.2 Barriers------------------------------------------------------------------------------- 10 3.3 Targets ------------------------------------------------------------------------------- 11 3.4 Outcomes --------------------------------------------------------------------------- 15 3.5 Monitoring & Measurement --------------------------------------------------- 15 4. Implementing Instruments..............................................16 4.1 Support Mechanisms------------------------------------------------------------ 16 4.2 Mandate and Governance------------------------------------------------------ 18 4.3 Finance Instruments------------------------------------------------------------- 19 4.4 Stakeholders ----------------------------------------------------------------------- 22 5. Sector Programmes.........................................................24 5.1 Industrial Sector Programme ------------------------------------------------- 26 5.2 Power Generation Sector Programme------------------------------------- 28 5.3 Commercial and Public Buildings Sector Programme--------------- 29 5.4 Residential Sector Programme ---------------------------------------------- 31 5.5 Transport Sector Programme ------------------------------------------------ 33 6. Cross-cutting Issues .....................................................35 6.1 Integrated Energy Planning --------------------------------------------------- 35 6.2 Renewable Energy --------------------------------------------------------------- 35 6.3 Environment and Health-------------------------------------------------------- 36 6.4 The Clean Fuels Programme-------------------------------------------------- 36 7. References .....................................................................38 Draft Energy Efficiency Strategy of the Republic of South Africa April 2004 iv
  • 6. List of Figures Figure 1. 2000 Primary Energy Supply -----------------------------------------------------6 Figure 2. 2000 Final Energy Use by Sector -----------------------------------------------7 Figure 3. 2000 Final Energy Use by Carrier -----------------------------------------------7 Figure 4. Energy Consumption per GDP for 2000 and GDP for 2000(ppp) -----8 Figure 5. Final Energy Demand per Capita (2000) --------------------------------------8 Figure 6. Carbon Dioxide Emissions per Capita ----------------------------------------9 Figure 7. Final Energy Demand – Target Outcome to 2014 ------------------------10 Figure 8. Stakeholder Responsibilities ---------------------------------------------------24 Figure 9. Sectoral Stakeholder Responsibilities --------------------------------------25 List of Tables Table 1. Projected Outcomes by 2014 ---------------------------------------------------15 Table 2. Industrial Sector Programme ---------------------------------------------------28 Table 3. Commercial and Public Buildings Sector Programme -----------------31 Table 4. Residential Sector Programme -------------------------------------------------33 Table 5. Transport Sector Programme ---------------------------------------------------35 Draft Energy Efficiency Strategy of the Republic of South Africa April 2004 v
  • 7. 1. Introduction 1.1 Why do we need an Energy Efficiency Strategy? Worldwide, nations are beginning to face up to the challenge of sustainable energy – in other words to alter the way that energy is utilised so that social, environmental and economic aims of sustainable development are supported. South Africa is a developing nation with significant heavy industry, which is by its nature energy intensive. This energy intensive economy largely relies on indigenous coal reserves for its driving force. At first sight there would appear to be an apparent paradox between using less energy and developing a healthy and prosperous nation based on energy intensive activities. This is not the case. In recent years energy efficiency has significantly gained in stature and has become recognised as one of the most cost- effective ways of meeting the demands of sustainable development. The benefits of energy efficiency upon the environment are self-evident. These benefits are of particular relevance, as South Africa remains one of the highest emitters of the Greenhouse gas CO2 per capita in the world. At a local level the problems of SO2 and smoke emissions have been the focus of concern for many communities living adjacent to heavily industrialised areas. Energy efficiency can address both the macroscopic and microscopic aspects of atmospheric pollution. The economic benefits of improving energy efficiency have been well documented since the first Oil Crisis in the early 1970’ s. Many forward-thinking industrial and commercial concerns have already adopted energy efficiency as a key policy towards maximising profits. The national electricity utility, Eskom, has itself embarked upon a DSM programme to defer investment in new plant. Such positive contributions to both our physical and economic environments will inevitably benefit our social wellbeing also; the alleviation of fuel poverty, job creation, improvements to human health, better working conditions - the list goes on. All of these factors will significantly contribute towards the aims of sustainable social development. It is for theses reasons that South Africa needs an Energy Efficiency Strategy. 1.2 The Status Quo The existing energy policy of South Africa is captured within the White Paper on Energy Policy (1998). The policy aims to provide the nation with wider access to energy services, by various means, whilst ensuring that the environmental impacts of energy conversion and use are minimised as far as possible. This is of relevance to Africa as a whole, as South Africa uses some 40% of the total electricity consumed within the continent. South Africa is endowed with rich deposits of minerals and fossil fuel in the form of coal. It is no surprise, therefore, that the economic development of our country has historically been focused upon the extraction and processing of these resources. This has led to the development of a national economy heavily dependent upon energy as its driving-force, and has resulted in the core of our industries being those concerned with energy-intensive activities, such as iron and steel production and other raw materials processing. Furthermore, coal has inevitably emerged as the major source of primary energy to meet the demands of industry and the country as a whole. In 2000 the total primary energy supply to the nation was nearly 4,300 Petajoules, of which 79% was attributable to coal. Draft Energy Efficiency Strategy of the Republic of South Africa April 2004 1
  • 8. Our abundant coal reserves have partially contributed towards an economic environment wherein the unit price of electricity is amongst the cheapest in the world. One of the undesirable side effects of this has been that energy efficiency has been demoted to make way for “priority” considerations, such as plant expansions and increases in production throughput. Indeed, by international standards the South African economy uses a relatively high amount of energy per unit of national economic output, or GDP. In recent years the issue of energy efficiency has attracted more interest in South Africa, and a number of initiatives and projects have proven the merits of enhanced energy performance. The 2002 World Summit on Sustainable Development, held in Johannesburg, recognised energy efficiency as a key tool to enhance clean energy development and to mitigate the negative effects of energy use upon the environment. A further development is Eskom’s Demand Side Management programme, which is aimed at reducing the national peak power demand, thereby deferring the immediate need for additional power generation capacity. In short, energy efficiency is fast gaining ground as a cost-effective means to approach all aspects of sustainability. It is generally accepted that South Africa holds numerous opportunities for energy savings, together with pollution mitigation measures of international significance. This Strategy offers a consolidated approach in order to capture these opportunities in the best interests of our nation. 1.3 The Strategic Process The White Paper on Energy Policy, published in 1998 states: “Significant potential exists for energy efficiency improvements in South Africa. In developing policies to achieve greater efficiency of energy use, government is mindful of the need to overcome shortcomings in energy markets. Government would create energy efficiency consciousness and would encourage energy efficiency in commerce and industry, will establish energy efficiency norms and standards for commercial buildings and industrial equipment and voluntary guidelines for the thermal performance of housing. A domestic appliance-labeling program will be introduced and publicity campaigns will be undertaken to ensure that appliance purchasers are aware of the purpose of the labels. Targets for industrial and commercial energy efficiency improvements will be set and monitored.” The White Paper gives a mandate to the DME to promote Energy Efficiency through various means. Although Government's present capacity to undertake energy efficiency programmes is limited, the DME will finalise and consolidate considerations to ensure appropriate leadership in the sector. The Strategy sets a national target for energy savings, of at least 12%, to be achieved by 2014. This target is expressed in relation to the forecast national energy demand at that time, based on the ‘business as usual’ baseline scenario for South Africa modelled as part of the National Integrated Energy Plan (2003), which uses energy consumption data for the year 2000. The target also assumes that the Energy Efficiency interventions outlined in this Strategy are undertaken; these measures being primarily focussed on low cost interventions that can be achieved with minimal investments. Energy efficiency improvements will be achieved through enabling instruments and interventions including economic and legislative means, information activities, energy labels, energy performance standards, energy audits, energy management and the promotion of efficient technologies. Draft Energy Efficiency Strategy of the Republic of South Africa April 2004 2
  • 9. The Strategy will cover all economic sectors, and be implemented through Sector Programmes. Systems will be put in place to monitor and evaluate progress in energy efficiency improvements and a periodic strategic review of the implementation will be undertaken. Draft Energy Efficiency Strategy of the Republic of South Africa April 2004 3
  • 10. 2. Vision and Goals Vision To encourage sustainable energy sector development and energy use through efficient practices thereby Minimising the undesirable impacts of energy usage upon health and the environment, and Contributing towards secure and affordable energy for all. Goals The Strategy’s eight goals are outlined below. The order in which the goals appear does not relate to any particular priority, although they are grouped in terms of social, environmental and economic sustainability. Social Sustainability Goal 1: Improve the health of the nation • Energy efficiency reduces the atmospheric emission of harmful substances such as oxides of Sulphur, oxides of Nitrogen, and smoke. Such substances are known to have an adverse effect on health and are frequently a primary cause of common respiratory ailments. Goal 2: Job creation • Studies show that jobs will be created by the spin-off effects of energy efficiency implementation. Improvements in commercial economic performance, and uplifting the energy efficiency sector itself, will inevitably lead to nationwide employment opportunities. Goal 3: Alleviate energy poverty • Energy efficient homes not only improve occupant health and wellbeing, but also enable the adequate provision of energy services to the community at an affordable cost. Draft Energy Efficiency Strategy of the Republic of South Africa April 2004 4
  • 11. Environmental Sustainability Goal 4: Reduce environmental pollution • Energy efficiency will reduce the local environmental impacts of its production and use. These impacts include the atmospheric emission of harmful and odorous gases. Goal 5: Reduce CO2 emissions • Energy efficiency is one of the most cost-effective methods of reducing Greenhouse Gas emissions, and thereby combating Climate Change. Addressing Climate Change opens the door to utilising novel financing mechanisms, such as the CDM, to reduce CO2 emissions. Economic Sustainability Goal 6: Improve industrial competitiveness • It has been demonstrated that one of the most cost-effective ways of maximizing commercial profitability is the adoption of appropriate energy efficiency measures. Nationwide, this will improve South Africa’s export performance and improve the value that her economy derives from indigenous energy resources. Goal 7: Enhance Energy Security • Energy conservation will reduce the necessary volume of imported primary energy sources, crude oil in particular. This will enhance the robustness of South Africa’s energy security and will increase the country’s resilience against external energy supply disruptions and price fluctuations. Goal 8: Defer the necessity for additional power generation capacity • It is estimated that the country’s existing power generation capacity will be insufficient to meet the rising national maximum demand by 2007-2012. Energy efficiency is integral to Eskom’s Demand Side Management programme insofar as it contributes 34% towards the 2015 demand reduction target of 7.3GW. Draft Energy Efficiency Strategy of the Republic of South Africa April 2004 5
  • 12. 3. Targets 3.1 Baseline Statistics The energy usage data illustrated in this section has been taken from the Digest of South African Energy Statistics, 2000 published by the Department of Minerals and Energy. Data concerning energy intensity has been taken from the International Energy Agency’s study Energy Balances of OECD countries, published in 2002. Primary Energy Supply The total primary energy supply to South Africa increased from 3,924PJ in 1993 to 4,295PJ in 2000, an increase of 9.5%. In 2000 coal contributed 79% of the total national primary energy supply, as illustrated in Figure 1, below. Renewables Hydro 6% Gas Crude Oil Nuclear <1% 2% 10% 3% Coal 79% Figure 1. 2000 Primary Energy Supply Sectoral Usage The final end-user energy usage in 2000 was 2,193PJ. The three largest energy- consuming sectors were industry, residential and transport. The remaining sectors accounted for less than 10% of final energy demand in 2000. Figure 2 depicts the sectoral split of final energy use, and excludes “non-energy use” carriers, such as solvents and lubricants. Draft Energy Efficiency Strategy of the Republic of South Africa April 2004 6
  • 13. Agriculture Other 3% 1% Transport 28% Industry 47% Residential Commerce 17% 4% Figure 2. 2000 Final Energy Use by Sector Figure 3, below, also refers to 2000 and illustrates the split of final energy use by each individual energy carrier. It is of significance to the national Balance of Payments that the largest of these, in energy content terms, is petroleum products. Crude oil is South Africa’s single largest import, and the vast majority of the downstream products are utilised by the Transport Sector. Petroleum Electricity Products 26% 33% Gas 2% Coal 30% Other (incl. Biomass) 9% Figure 3. 2000 Final Energy Use by Carrier Draft Energy Efficiency Strategy of the Republic of South Africa April 2004 7
  • 14. Energy Intensity National energy intensity is defined as the ratio of primary energy supply to Gross Domestic Product (GDP). South Africa’s energy intensity (energy consumption in terms of GDP) is high (see Figure 4) but her energy use per capita is low compared to that of other developed counties (see Figure 5). This is due to the low income per capita, the relatively low energy intensity of the transport and residential sectors and the high energy intensity of mining and minerals processing activities. The industrial/mining sector’s consumption, comprising 47% of South Africa’s total energy (see Figure 1), is high compared to other countries and this in itself explains why South Africa has a high energy intensity. However, it should be borne in mind that energy intensity is not necessarily indicative of poor energy efficiency; suffice to say that the industrial/mining sector provides a large potential for energy efficiency interventions and energy savings. 50 45 40 35 GDP 2000 ppp PJ/bill US$ 30 GDP 2000 25 20 15 10 5 0 Sw y en na a ce a e n y K k a ia SA lia a an ar ad ny bw pa ric U ib w ra an ed hi U m am Ke m Af an Ja or ba C st Fr en er N Au C h m N D G ut Zi So Figure 4. Energy consumption per GDP for 2000, and GDP for 2000 (purchasing power parity) 300 energy consumed PJ per cap Canada 250 USA 200 Norway 150 Australia Germany UK 100 South Africa 50 Zimbabwe China Kenya Namibia 0 GDP ppp per cap Figure 5. Final energy demand per capita (2000) Draft Energy Efficiency Strategy of the Republic of South Africa April 2004 8
  • 15. The practice of ‘benchmarking’, comparing the energy intensities of different sectors in other countries, aids in estimating where reductions in energy use may be achieved in South Africa, and thus determining those interventions which have worked internationally will be likely to be successful in South Africa. The trend over recent years has been for energy consumption in the industrial/mining sector to increase at a steady rate, whereas the trend for other sectors has been to remain level or even decrease where new, more efficient, technology has been introduced to replace old technology eg. private motor cars. Climate Change At the Rio de Janeiro Earth Summit of 1992 the United Nations Framework Convention on Climate Change stated that its fundamental objective was to achieve stabilisation of the concentrations of Greenhouse gases (GHGs) in the atmosphere at a level that would prevent dangerous anthropogenic interference with the climate system. South Africa ratified the Convention in 1997, which enables South Africa to apply for financial assistance for climate change related activities from the Global Environmental Facility. The Kyoto Protocol (1997) is an agreement under which industrialised countries (Annex 1 countries) will reduce their combined greenhouse gas emissions by at least 5% compared to 1990 levels by the period 2008 to 2012. The Protocol will come into force after it has been ratified by at least 55 counties, including Annex 1 parties accounting for at least 55% of the total 1990 carbon dioxide emissions in this industrialised group. South Africa acceded to the Kyoto Protocol in March 2002. Although the Kyoto Protocol does not commit the non-Annex 1 (developing) countries, like South Africa, to any quantified emission targets in the first commitment period (2008 to 2012), there is potential for low cost emission reduction options in these countries. The Clean Development Mechanism provides for trade in certified emission reductions between non-Annex 1 countries and Annex 1 countries and thus supports sustainable development with respect to greenhouse gas emissions in developing countries while helping Annex 1 countries to comply with their commitments under the Kyoto Protocol. tonnes carbon dioxide per capita 25 20 15 10 5 0 a a a y na K lia SA e ce ia an ny ric ad bw U ib ra an hi U am Ke Af m an ba st C Fr er Au C h m N G ut Zi So Figure 6: Carbon Dioxide Emissions per capita (IEA, 2001) Draft Energy Efficiency Strategy of the Republic of South Africa April 2004 9
  • 16. As South Africa is by far the largest emitter of GHGs in Africa and one of the most carbon emission-intensive countries in the world as shown in figure 6, due to the energy intensive economy and high dependence on coal for primary energy, certain energy efficiency initiatives have potential for financial support under the Clean Development Mechanism. 3.2 Barriers One of the fundamental steps necessary to enable successful implementation of any Strategy is the need to understand the barriers confronting it, and how to overcome those. Several of the more traditional barriers are self-evident, and are described briefly below. In addition to these, however, is a barrier relating to the state of the country itself; the argument being that energy efficiency should be a relatively low priority when compared with other pressing national issues such as quality of life and education. It is important to bear in mind that energy plays an integral part in the solution of these problems, and that without clean and affordable energy such issues will be difficult to resolve. Energy Pricing This is a perceived barrier that stems from South Africa’s historically low unit price of coal and electricity, although there has been a gradual and incremental rise in energy prices over recent years. This barrier still holds strong amongst the mind-set of many commercial and industrial organisations, that argue that medium and high-cost interventions cannot be justified due to the lengthy paybacks involved. Energy efficiency makes sound economic sense. Although the unit price of energy may be low, for the time being, the overall cost to our energy-intensive industries is high. If energy efficiency is approached correctly and with the right emphasis, payback on investment is frequently less than three years. Education and awareness programmes are some of the first steps to take towards overcoming this barrier. Lack of knowledge and understanding of Energy Efficiency Energy efficiency opportunities are frequently overlooked due to the simple fact that industry and other consumers are unaware that they exist. It is the intention of the Strategy to enhance awareness in such matters and to bring knowledge and understanding into the various sectors. This will be achieved through awareness campaigns, demonstration programmes, audits and education, and publicising corporate commitment programmes, and public building sector energy efficiency implementation initiatives. Institutional barriers, and resistance to change Institutional barriers often stem from a fear that outsiders will identify previously overlooked opportunities, thereby uncovering apparent incompetence. There is also a frequently encountered misconception, particularly within industry, that energy efficiency will disrupt production processes and that changes should not be made unless absolutely necessary. It is important to understand that to a large extent these are emotional barriers. An approach is required, therefore, that is not only professional and technically competent, but also sensitive to such issues. Lack of investment confidence Draft Energy Efficiency Strategy of the Republic of South Africa April 2004 10
  • 17. Achieving optimum energy performance sometimes involves the installation of costly plant and equipment, and investors may be reluctant to tie-up financial resources in long-term projects. Recent history has seen a degree of uncertainty, both nationally and internationally, due to the fluctuations in the strength of our currency. This is an ongoing problem, and investors should be encouraged to cost all externalities when considering energy efficiency investment opportunities. Furthermore, appropriate risk-weightings should be attributed to fossil fuel prices when considering plant lifetime running costs. The notion of introducing incentives on energy efficient appliances and equipment will be considered during the lifetime of this Strategy. The practice of “bounded rationality” Decision making with limited management resources requires the use of imperfect, or incomplete, information and less than fully rational procedures. This is significant as the majority of energy consumers currently have imperfect information regarding the range and performance of energy efficient products. This fact inevitably results in poor decision- making when purchasing goods or specifying equipment. It is an intention of the Strategy to enhance the decision-makers’ awareness of issues such as running costs, environmental costs, etc. This will be achieved via the adoption of appropriate standards, awareness and education, and by the use of instruments such as appliance labeling. 3.3 Targets To date, only a handful of countries worldwide have set comprehensive targets for energy efficiency improvements. These countries include Slovenia, Japan, The Netherlands and New Zealand. The World Energy Assessment, published by the UN and the World Energy Council, suggests that specific energy usage in industrialised countries could be cost-effectively reduced by 35% over a period of 20 years, if accompanied by effective policies. In the United States, the Electric Power Research Institute (EPRI) has proposed an energy efficiency improvement target of 2% per annum. This Strategy provides for the implementation of sector programmes in a three-phase approach, timed as follows: • Phase 1: June 2004 to May 2007; • Phase 2: June 2007 to May 2010; • Phase 3: June 2010 to May 2014. The broad principle of this phased approach is to initiate actions with rapid returns during the early phases. However, it is likely that interventions such as technical standards will also be addressed at an early stage to enable the long-term benefits to be maximised. This Strategy proposes the following energy efficiency target for South Africa: A Final Energy Demand Reduction of 12% by 2014 The target stated above is expressed as a percentage reduction against the projected national energy usage in 2014. The projected usage is forecast at the present increase in economic development and without any additional efficiency interventions. The forecast is derived from the Long range Energy Alternatives Planning tool (LEAP) utilised for Draft Energy Efficiency Strategy of the Republic of South Africa April 2004 11
  • 18. developing the National Integrated Energy Plan for South Africa. The baseline scenario is similar to the base case scenario of the IEP (‘business-as-usual’) in which the following assumptions are made: • Population growth: 2000=44 million, 2014=52,6 million (1,3% per annum) • GDP growth: 2,8% average per annum growth over period • Economic growth: 2,8% over period • Fuel switching limited apart from general increase in electricity consumption in residential sector It should be stressed that this target is by no means a mandatory requirement, but rather a guideline to aspire to. The national target is illustrated further in Figure 7, where final energy demand is shown as a total of all sectors and is expressed in Petajoules. The Projected Demand to 2014 is as forecast at an annual growth rate of 2,8% per annum. The Target Outcome to 2014 is shown assuming that the national target is achieved, and that savings are implemented uniformly across the three phases of the Strategy. In actuality it is likely that savings will begin to materialise towards the latter stages of Phase 1 and into Phase 2. 3500 Projected Demand to 2014 3000 2500 Target Outcome to 2014 2000 PJ 1500 1000 500 0 92 93 94 95 96 97 98 99 00 01 02 03 04 05 06 07 08 09 10 11 12 13 19 19 19 19 19 19 19 19 20 20 20 20 20 20 20 20 20 20 20 20 20 20 Year Figure 7: Final Energy Demand – Target Outcome to 2014 The national target is calculated using the individual targets for each economic sector, and by weighting these according the sectoral contribution to final demand, as previously shown in Figure 2. Sectoral targets are based upon the different growth rate elasticities for each sector (Energy Efficiency Savings Projections, CaBEERE 2003). Here GDP growth elasticity in Industry varies from .25% pa for the pulp and paper industry to 1.87% pa for non-ferrous metals, whereas gold mining has a negative growth elasticity of -1.7% pa. Elasticities for Draft Energy Efficiency Strategy of the Republic of South Africa April 2004 12
  • 19. the other sectors are Commercial Buildings 1.08% pa, Agriculture .45% pa and Transport 1% pa. The Residential Sector has a 1 to 1 relationship with population growth. The Power Sector forecast by Eskom is based on the 2.8% pa GDP growth assumption, so, it too, has a 1% pa growth elasticity. Review of Targets A review of the national and sectoral targets will be undertaken at the end of each phase. This review will be carried out by the DME with the objective of assessing progress towards targeted outcomes and to address any areas where additional input may be required from stakeholders. It is important that the targets are seen to be both challenging and achievable. In most cases the sectoral targets comprise a conservative estimate of the likely impact of technical interventions, coupled with the additional impact of energy management initiatives and behavioral changes. Industry Sector A Target Final Energy Demand Reduction of 15% by 2014 The industrial sector is the largest user of energy in South Africa. A relatively high theoretical potential for energy saving exists, in the magnitude of 50% of current consumption in comparison with international best practice, on a sector-by-sector basis. Notwithstanding this, research has shown that a savings potential of at least 11% is readily achievable using low-cost to medium-cost technical interventions (http://www.actionenergy.org.uk/Action+Energy/AE+Resources/Default.htm). Furthermore, an additional 5% - 15% energy saving would be achievable via proven low-cost techniques of energy management and good housekeeping. It is considered, therefore, that the prescribed target of 15% is realistic and achievable. Power Generation Sector The issue of targeting energy efficiency improvements within this sector is currently the subject of dialogue between the DME and Eskom. It is likely that a sectoral target will be developed for the power generation and supply sector following further consultation processes. At this stage, however, a realistic target needs to be derived from a detailed investigation by Eskom and is therefore omitted here, as is its contribution to the overall national target. Commercial and Public Building Sector A Target Final Energy Demand Reduction of 15% by 2014 Although this sector contributes a relatively minor percentage to national energy usage, savings here are known to be significant. Research and experience have shown that savings through low-cost and medium-cost technical interventions can exceed 25%. In order to allow for partial sectoral penetration of technical measures, however, a figure of 11% has been calculated using detailed modeling analysis. Additionally, a further 4% is Draft Energy Efficiency Strategy of the Republic of South Africa April 2004 13
  • 20. thought to be realistically achievable through managerial intervention and behavioral changes. Residential Sector A Target Final Energy Demand Reduction of 10% by 2014 This sector used 360.5 PJ in 2000 in the form of coal (11%), petroleum products (7%), biomass (53%) and electricity (29%). The transition towards the use of higher CV fuels and a reduction in the use of thermal energy consumption will be driven by energy efficiency standards in housing, generally higher standards of living accompanying economic growth of 2.8% pa, and the electification programme. The measures outlined in the interventions section (see 5.4 Residential Sector Programme); mandatory standards, appliance labeling, efficient lighting and standards for non-electric appliances such as energy efficient coal stoves, wood stoves and liquid fuel stoves, should be comprehensive enough to achieve the goals proposed. However, the sector is very diverse, and many energy saving decisions lie at the individual household level, requiring an initial investment. Therefore an ongoing public awareness drive will be necessary to achieve a saving of 10% by the year 2014, based on a projection from the present consumption. Transport Sector A Target Final Energy Demand Reduction of 9% by 2014 Transport is the second largest sectoral consumer of energy and is expected to grow considerably in the medium-term. Measures to address energy efficiency will not necessarily be easy to implement, as has been the experience internationally where motor vehicles have become the main means of transport. The projected savings will, therefore, only begin to impact during Phase 2 when planned interventions have been implemented fully. The majority of the measures will be regulatory in nature, but in order to be effective will rely heavily upon behavioral changes. Such changes are, by experience, the most intractable elements to influence. A target of 9% has, therefore, been established as a realistic but challenging objective for 2014. This target has assumed the introduction of a labeling system for vehicle energy consumption accompanied by legislation on the ‘fee bate system’, technology upgrade leading to more efficient vehicles/turnover in the vehicle park, but has excluded taxi- recapitalisation. As the impacts of taxi-recapitalisation may only be evident in the later phases of this Strategy the target would be reviewed in Phase 3. The impact of measures such as moving road to rail and spatial planning are also difficult to assess at this stage and remain interventions with impacts in the long-term. Draft Energy Efficiency Strategy of the Republic of South Africa April 2004 14
  • 21. 3.4 Outcomes Table 1 summarises outcomes by the eight goal areas of the Strategy, assuming that all targets are met. It should be noted that not all goal outcomes are quantifiable at this stage, so qualitative commentary is provided against some outcomes. Table 1. Projected Outcomes by 2014 Goal Area Outcomes Goal 1 • Health benefits realised through reduced atmospheric pollution and Improve the health of the nation improved living conditions, in particular a reduction in respiratory-related illnesses; Goal 2 • Long-term employment opportunities increased by reducing costs in Creation of Jobs commerce and industry; • Employment opportunities increased within the energy efficiency sector and related activities. Goal 3 • Access to affordable energy services improved by promoting low energy Energy Poverty Alleviation alternatives in the marketplace; • Lower energy costs for households by improving domestic energy efficiency. Goal 4 • Atmospheric pollutant levels reduced by a reduction in fossil fuel Reduce local Pollution combustion at power stations; • Local atmospheric pollutant levels reduced by a reduction in fossil fuel combustion within industry and commerce; • Transport-related atmospheric pollutant levels reduced by a reduction in combustion of petroleum products in motor vehicles. Goal 5 • National CO2 emissions reduced by improving energy efficiency across all Reduce CO2 Emissions economic sectors; Goal 6 • Improved industrial and commercial profitability by controlling and Improve Industrial Competitiveness minimising energy overheads; • Improved international acceptability of South African products by minimising the environmental impacts of their manufacture. Goal 7 • Increased national resilience against oil price fluctuations by reducing the Increase Energy Security country’s dependence upon imported crude oil supplies; • Increased resilience against internal supply disruptions by reducing load demands placed upon power distribution systems. Goal 8 • Construction of additional power generation plant deferred as far as Defer Additional Generation Capacity practicable by contributing towards Eskom’s 7.3GW peak load reduction target for 2015. 3.5 Monitoring & Measurement The White Paper on Energy Policy states that: “Government will ensure that the necessary resources are made available to establish structures, systems and legislation to facilitate the specification, collection, storage, maintenance and supply of energy data, and energy-related data, according to the requirements of integrated energy planning and international standards.” Government must be able to measure the effectiveness and efficiency of measures implemented and initiatives put in place for the promotion of energy efficiency, as prescribed by Energy Policy, and must sustain this capacity. There is a need to establish a system for continuous updating and registration of figures related to energy efficiency; in particular, indicators for efficiency measurement. A formalised system for collecting, managing data and calculating indicators is necessary for monitoring the implementation and success of activities initiated as part of the strategies for energy efficiency. It is DME’s responsibility to establish such a monitoring and Draft Energy Efficiency Strategy of the Republic of South Africa April 2004 15
  • 22. verification system and ensure that it is implemented. This is also a compliance measure that fulfils requirements by the Draft Energy Bill (section 17 (1) (2)) on the collection of energy information. The success of such a system will inevitably depend upon using a multi-stakeholder approach, and the relevant players are outlined in Section 4.4, Figure 9. 4. Implementing Instruments The Strategy makes use of a range of generic implementing instruments which are applied as appropriate to meet specific needs within each Sector Programme. The relative maturity of the marketplace will determine which instrument is used where, and how. For example, where interventions are seen as novel and may require some development, the appropriate instruments may include trials and incentives. By contrast, where interventions are already somewhat developed awareness may be the driving need. 4.1 Support Mechanisms The following paragraphs illustrate and describe the main supporting mechanisms and instruments used with each sectoral programme. Such mechanisms are intended to be independent of financial and policy instruments. Efficiency Standards Efficiency standards have been successfully applied overseas and have brought about significant improvements in efficiencies. South Africa has a well-developed system of standards and codes of practice that, in some cases, may be amended to include efficiency aspects without the need to established completely new standards. The Draft Energy Bill gives the Minister of Minerals and Energy substantial authority to make standards compulsory. Mandatory energy efficiency standards will be an important and integral part of the Strategy. Appliance Labeling Energy labeling of appliances is an internationally tried and tested tool to build awareness and raising capacity about energy consumption. A number of studies, the latest completed as recently 2003, have looked into the feasibility of introducing labeling for some household appliances in South Africa. Potential savings with labeling or higher efficiency standards are estimated at 3 PJ in 2012. The adoption of European Union standards for labeling can be considered, as this has already been tested and is widely approved. Furthermore, the success of the EU standards in conveying the message of efficiency to a diverse target-group, comprising a variety of cultural backgrounds, would be of particularly benefit to South Africa.Mandatory appliance labeling for household appliances forms an important element of the Strategy and will be promoted and implemented. Certification and Accreditation The Strategy makes use of several instruments where inspectors or auditors will be expected to carry out certain technical functions, or studies. These functions will necessarily require a minimum level of technical competence on behalf of the party Draft Energy Efficiency Strategy of the Republic of South Africa April 2004 16
  • 23. concerned. Examples include the certification of energy auditors for buildings and the accreditation of inspectors for Efficiency Standards. The outline requirements of relevant accreditation procedures will be specified by the DME, professional associations and the certification made by SABS. It is the intention of the Strategy to help develop such accreditation procedures and to enable appropriate certification to be awarded to the relevant aspirants. Education, Information and Awareness Information and generic awareness are key elements to achieve success in terms of changing South Africa into a more energy efficient society. Once laws and regulations are established, architects will need guidance (from standards etc) on how to design houses according to the new regulations, and plumbers should also have be informed about the need to insulate geysers. Awareness-raising starts with pre-schooling education and runs through all learning fields into the adult education system, under the auspices of the National Qualification Framework (NQF) up to level 8. The DME will engage with the institutions responsible for education and support, and facilitate the inclusion of appropriate education on energy efficiency in the curriculum. The DME will strive to ensure that: • Energy Efficiency is taught and examined at all levels in all appropriate subjects, in particular engineering and architecture; • Energy Efficiency is a competence requirement under the NQF training programmes for skilled workers in the relevant construction and buildings services trades Research and Technology Technological options represent significant potential for energy efficiency improvements and, in many instances, are well researched and already developed. However, the majority of these technologies are not manufactured locally and require importation. The latter point will represent a challenge for the Government, particularly as the drive to promote energy efficiency gains momentum. The National Energy Research Institute will be funded to carry out a dedicated programme of R&D for energy efficiency. The Strategy will support appropriate research and the possible adaptation of internationally available technologies and processes. Regulation The historically low unit price of energy, coupled with limited awareness on energy savings potential, may result in only modest success arising from voluntary measures and other non-legislative instruments. For this reason, regulatory means will be applied to achieve further improvements where necessary. Efficiency Standards will have limited impact unless made mandatory, and energy audits should be accompanied by an obligation to implement, for example, all no-cost recommendations identified. The NER will contribute to or develop regulatory measures for guiding reporting and compliance. Energy Audits Draft Energy Efficiency Strategy of the Republic of South Africa April 2004 17
  • 24. Energy audits have internationally been used across all sectors to identify efficiency measures that can be implemented in a cost-effective manner. However, to be effective it has often required both the audits as well as the implementation of measures to be compulsory or to be supported by subsidies. The Strategy will promote energy audits as a means of improving efficiency. Studies will be undertaken to design ways in which audits will achieve the greatest impact. Energy Management Systems Energy management enables the formalisation of monitoring, evaluating and targeting energy consumption as well as providing sector-specific benchmarking information. Within industrial and commercial applications, the concept of energy management must also embody other key areas, including Training, Motivation & Awareness, Green Accounts (where companies audit the environmental performance of their operation, as well as its economic performance), Energy Policy and formalised Monitoring & Targeting (M&T). The importance of effective M&T cannot be over-emphasised, as it provides the yardstick against which savings are targeted and improvements are measured. Without the key information that M&T provides, attempts to save energy within an organisation can be frustrating, futile and de-motivating. The implementation plan for the Industrial Sector will execute a special project designed to develop a monitoring and targeting system in collaboration with the database function at the DME. The Strategy will support the proliferation of energy management and the establishment of necessary information, including the introduction of Monitoring & Targeting and "Green accounts". Fee Bates Fee bates, as envisaged, will be directed toward motor vehicles. The basic principle is that levies imposed when licensing less efficient vehicles will be used to cross-subsidise the license fees on more efficient vehicles. The exact details and methodologies of these schemes are currently being researched, and will be implemented in conjunction with Government’s Motor Industry Development Plan. 4.2 Policy, Mandate and Governance The mandate to govern and undertake energy efficiency initiatives is derived from the following documents: • The South African Constitution; • The White Paper on Energy Policy, 1998; • The Municipal Systems Act No. 32 of 2000; • The Electricity Act No. 41 of 1987 (as amended); • The Draft Energy Bill; • The Standards Act; • The Draft Electricity Regulation Bill Draft Energy Efficiency Strategy of the Republic of South Africa April 2004 18
  • 25. The DME will prepare appropriate legislation and regulations for the Governance and Implementation of this Energy Efficiency Strategy. The regulations will take into account the capacity of the Government to enforce implementation. The mandate given by the White Paper on Energy Policy says that the DME should promote Energy Efficiency through various means as well as consider the establishment of an agency to be instrumental for the Coordination, Leadership and sector capacity development for the implementation of Efficiency. Government's present capacity to undertake energy efficiency programmes is limited. Other countries in similar circumstances have found the establishment of an agency to be an effective means of providing the necessary leadership and capacity to implement programmes. The DME will, during the early stages of implementation, finalise and consolidate considerations to ensure appropriate leadership in the sector. 4.3 Finance Instruments The formulation and implementation of this Strategy is geared towards self-finance, positive savings and job creation. The majority of Energy Efficiency improvements will materialise through the implementation of standards, regulation and management tools, which at the end of the day leads to short pay back periods for the individual enterprises, house owners and government. Costs related to preparing, for example, regulations may be sourced out of existing Government budgets supported by additional external donor funding. Costs related to investments in equipment or refurbishing of production flows, houses, etc. are to be born by the direct beneficiaries, which is reasonable to expect due to the short payback periods. Where payback periods are less favourable, the option to partake in other enabling mechanisms should be encouraged. Such mechanisms include the Clean Development Mechanism (CDM), developed under the 1997 Kyoto Protocol. For Government the real costs to implement this Strategy relate to the massive information and coordination requirements – such costs are to some degree flexible and therefore, kept at the implementation level rather than the Strategy level. At this stage of South Africa’s development it is difficult to justify government subsidies for Energy Efficiency when there are many other pressing needs nationwide. However, over time fiscal reform may be possible, and eventually other types of incentives may become available. As an example, the successful implementation of energy efficiency in the electricity sector leads to reduction in costs to end users due to deferred generation investments. Therefore subsidising energy efficiency to acceleration implementation will prove beneficial to all users of electricity. This is the justification of the current subsising of energy efficiency projects through the Eskom DSM Fund. Financing the Public Sector Implementation Plan Presently it appears that some cost effective capital measures in the Public Building Sector remain unimplemented because there are no specific budgets to cater for them. However, according to National Treasury within the existing Medium-Term Expenditure Framework it is possible to transfer operating cost budget items to capital cost budgets on the proviso that this is accomplished within the normal cycle of three years. This will probably require energy efficiency investments to be spread over several years. Draft Energy Efficiency Strategy of the Republic of South Africa April 2004 19
  • 26. This presents another enabling instrument for cost effective capital measures with short to medium term payback periods. Should this delivery mode prove workable in the Public Buildings Sector, there would then be motivation to extend the concept to all State-owned enterprises, Provincial and Local Government authorities. The introduction of shared savings will also act as an incentive to various departments. The intention here is that those departments who implement energy efficient measures will be able to utilise part of the savings thereby achieved (the other part of the savings going to the implementing company), as with energy service companies in the private sector (see next section). National Treasury is in agreement with this approach. Energy Service Companies The business of an Energy Service Company (ESCO) is to sell energy services. Energy management being one of the most common activities with saved energy as the main product. The ESCO meets client needs to reduce costs, improve energy efficiency, manage risk and enhance competitive edge. The ESCO will typically offer this through a package, which includes a comprehensive energy audit service, financing mechanism, equipment procurement, and installation and commissioning, operation monitoring and performance guarantees. Saved energy cost is typically used to meet the implementation cost of saving energy. There are several payments options that include lump sum payment or once off payment and performance contracting paid through shared savings where a percentage of the cost savings are split between owner and the ESCO. This approach can be used to implement resource management measures, such as energy management in industrial and commercial and even in the residential sectors. The strength of the approach is in the delivery of results i.e. actual energy cost savings by the ESCO enabling the customer to focus on their core business. Although the ESCO concept is not new, it is not yet fully developed in South Africa. Players do exist in the marketplace, but they are relatively few and many of them have limited experience. As a result a confidence gap exists in the market where customers are sceptical and reluctant to use this service delivery mode. This is exacerbated by an absence of a well-established performance standard and service provider certification and accreditation. Despite this, it is accepted that the ESCO model does have an important role to play in the delivery of energy management services in South Africa. Indeed Eskom’s own Demand Side Management programme uses the ESCO concept as it’s key delivery mechanism. There is, therefore, merit in supporting and strengthening this service delivery mode given the potential to achieve energy savings at minimum cost to the Fiscus. Clean Development Mechanism The Kyoto Protocol was adopted at the third Conference of the Parties in 1997. The Protocol provides that developed nations accept commitments to limit, or reduce, the emission of greenhouse gases according to differentiated targets. For the signatory parties, termed Annex 1 countries, this represents an overall reduction of 5% by the period 2008 to 2012 in relation to their combined emissions of greenhouse gases in 1990. South Africa ratified the UNFCCC in August 1997 and acceded to the Kyoto Protocol in March 2002 as a non-Annex 1 signatory. Achieving such goals will result in significant costs to the economies of each Annex 1 country, and a number of mechanisms were developed to assist these countries to comply with their respective targets. One of these mechanisms is the Clean Development Draft Energy Efficiency Strategy of the Republic of South Africa April 2004 20
  • 27. Mechanism, or CDM. The basic principle of the CDM is simple: developed countries can invest in low-cost abatement opportunities in developing countries and receive credits for the resulting emissions reduction. Such credits would then count towards their own abatement targets. The CDM can positively contribute towards the sustainability objectives of a developing nation by: • Transferring technology and financial resources; • Developing sustainable methods of energy production; • Increasing awareness of energy efficiency and environmental issues; • Alleviating poverty through income and employment generation; • Helping define investment priorities in projects that meet sustainability goals. The CDM encourages developing countries to participate by promising that their own development priorities will be addressed as part of the package. This recognises that only through long-term development will all countries be able to play a role in protecting the environment. To date, the Kyoto Protocol has not yet been fully ratified and still awaits major signatories such as the USA and Russia. There is a risk, therefore, that the enforcement of the Protocol may not materialise and that some of the targets set out in this Strategy would then need to be reviewed. Demand Side Management At current energy usage levels and national economic development projections, it is estimated that without any interventions to reduce peak electricity demand, there will be a need to invest in new power generating capacity by around 2007. As the construction of additional generation plant is an extremely costly and lengthy process, Eskom has embarked upon a Demand Side Management (DSM) programme in order to defer such an investment. The intention is to use a combination of energy efficiency measures, load management and negotiated interruptible supplies to move the 2007 deadline back to somewhere between 2015 and 2025. The DSM provision in Eskom’s current Integrated Energy Plan is for a peak load reduction target of 1.37GW by 2015. In addition, ther is an interruptible supply agreement target of 1.511GW by 2007 and 0.409GW by 2015. This target is likely to change dynamically over time in response to the actual requirement for DSM in South Africa. It is also likely to change in response to the effectiveness of interruptible supply agreements. Presently, however, the load reduction target is comprised of the following elements: • 0.81GW from load shifting; • 0.56GW from energy efficiency measures. Eskom has adopted the ESCO methodology as the key tool to implement the DSM process. Energy efficiency and load management projects are implemented and managed via a third-party (the ESCO) and savings resulting from the intervention are shared between the host site, Eskom and the ESCO in approximately equal proportions. Capital funds are currently gathered through supply tariffs and administered by Eskom. (The current funding mechanism is under review and discussion between Eskom and NER). Draft Energy Efficiency Strategy of the Republic of South Africa April 2004 21
  • 28. It is acknowledged that this methodology is inherently subject to the constraints and barriers previously outlined for ESCOs in the section above. Despite this there are 80 ESCOs already registered and six projects have been implemented yielding a demand reduction of around 1MW. Approximately 30 additional projects, with a combined potential saving of some 140MW, have been identified. In addition, approximately 300MW worth of potential projects are currently in the investigation stage (as at end of February 2004). Energy Pricing Following on from the specific policy objectives of the White Paper on Energy Policy (1998), energy pricing will be based on an assessment of the full economic, social and environmental costs and benefits of policies, plans, programmes and activities of energy production and utilisation. That is to say, a process of moving from cross-subsidies towards cost-reflective prices will generally be adopted. 4.4 Stakeholders The South African energy arena is characterised by a number of diverse role players each with a mandate within the fields of energy supply, conversion, efficiency and regulation. Only through well co-ordinated initiatives and promotion to activate the different role players will South Africa be able to effectively promote energy efficiency. The DME will prompt the different stakeholders to take a leading role in their areas of responsibility. The means will be information, regulation, promotion, facilitation of an enabling capacity development framework, as well as the coordination of knowledge and actions where necessary. Figure 8 shows how the key stakeholders will be involved in the strategic processes described in this document. Stakeholder relationships are shown against each implementing instrument, or focal area, in terms of primary stakeholders and secondary stakeholders. Primary stakeholders may be broadly defined as those whose main functionality deals directly with the associated focus area. Secondary stakeholders may be described as those whose responsibilities partly overlap with a particular focus area, or where their involvement would be of an ad hoc nature. Figure 9 compares the major roles of the primary stakeholders across the sectoral initiatives proposed. These roles are defined in terms of strategic responsibility, implementation, regulation and monitoring. The figure also indicates which stakeholders will be responsible for the Monitoring and Verification (M&V) of sectoral initiatives, as indicated in Section 3.5. Draft Energy Efficiency Strategy of the Republic of South Africa April 2004 22
  • 29. Figure 8. Stakeholder Responsibilities Primary Stakeholder Stakeholder Group Secondary Stakeholder DTI, DoH, NDoT NER SARS, NT Non-central Govt. CEF Industry Assocs Eskom & Utilities Energy Users ESCOs SABS Education Services Financial Sector CDM Services NGOs DME Efficiency Standards Appliance Labeling Certification & Accreditation Instruments Education & Awareness Research & Technology Regulation Energy Audits Energy Management Fee Bates Policy, Mandate and Governance Finance
  • 30. Figure 9. Sectoral Stakeholder Responsibilities Strategy Implementation Stakeholder Regulation Eskom NDoT DPLG Motor Industry Local Authorities NER DTI NAAMSA DoH End-users SARS SABS DOPW REDs / IPPS DME Monitoring Regulator/M&V Industry Non-Transport Commerce Public Buildings Residential Power Generation General Taxi Recapitalisation Transport Fee Bate Road-to-Rail ALL Spatial Planning Road Traffic Mgt Strategy ALL Motor Industry Devt Plan ALL 24