Download as PDF, PPTX

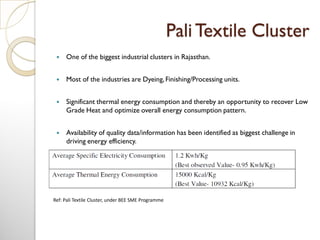
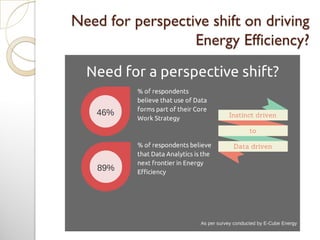
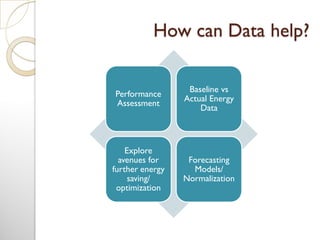
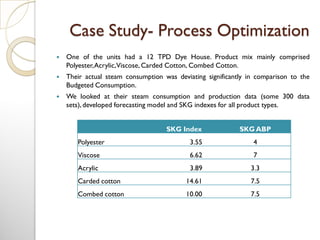
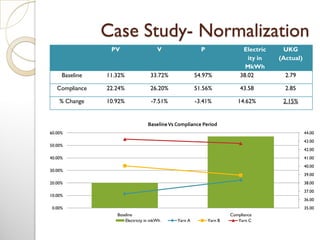
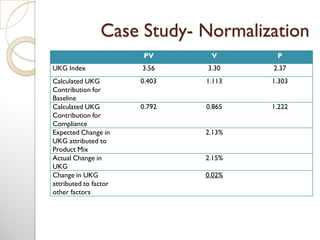
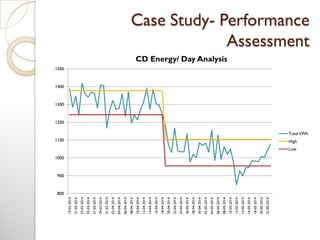
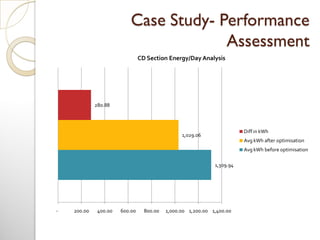
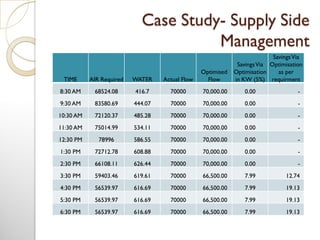
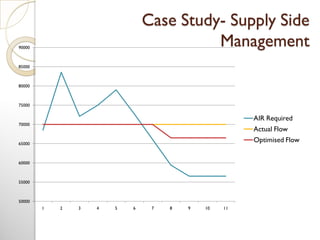
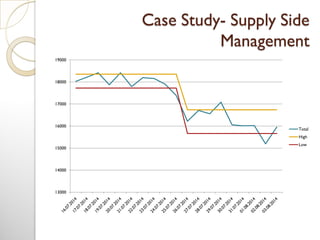
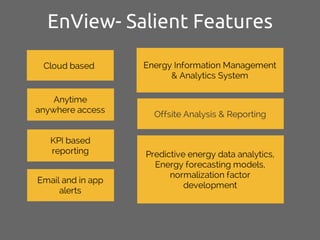


This document discusses how data analytics can help foster energy efficiency, specifically in the textile industry. It provides examples of how E-Cube Energy has used data analytics to optimize processes, normalize energy usage based on production and establish energy savings baselines. Key points made include: - E-Cube has established 15 million units/year in energy savings across textile clients through performance assessment, forecasting models and supply side optimization. - Case studies show how analyzing steam consumption and production data helped optimize a dyeing process and attribute savings to specific factors like product mix changes. - Normalizing energy usage based on production helped verify over 2% savings from optimization projects at one textile mill. - Analyzing water and air


![제 23회 보아즈(BOAZ) 빅데이터 컨퍼런스 - [MBOAX] : ABSA를 활용한 소비자 반응 분석 기반 운영 효율화 대시보드 설계](https://cdn.slidesharecdn.com/ss_thumbnails/3-1boaz23rdconferencemboax-260203102709-9d519923-thumbnail.jpg?width=640&height=640&fit=bounds)


