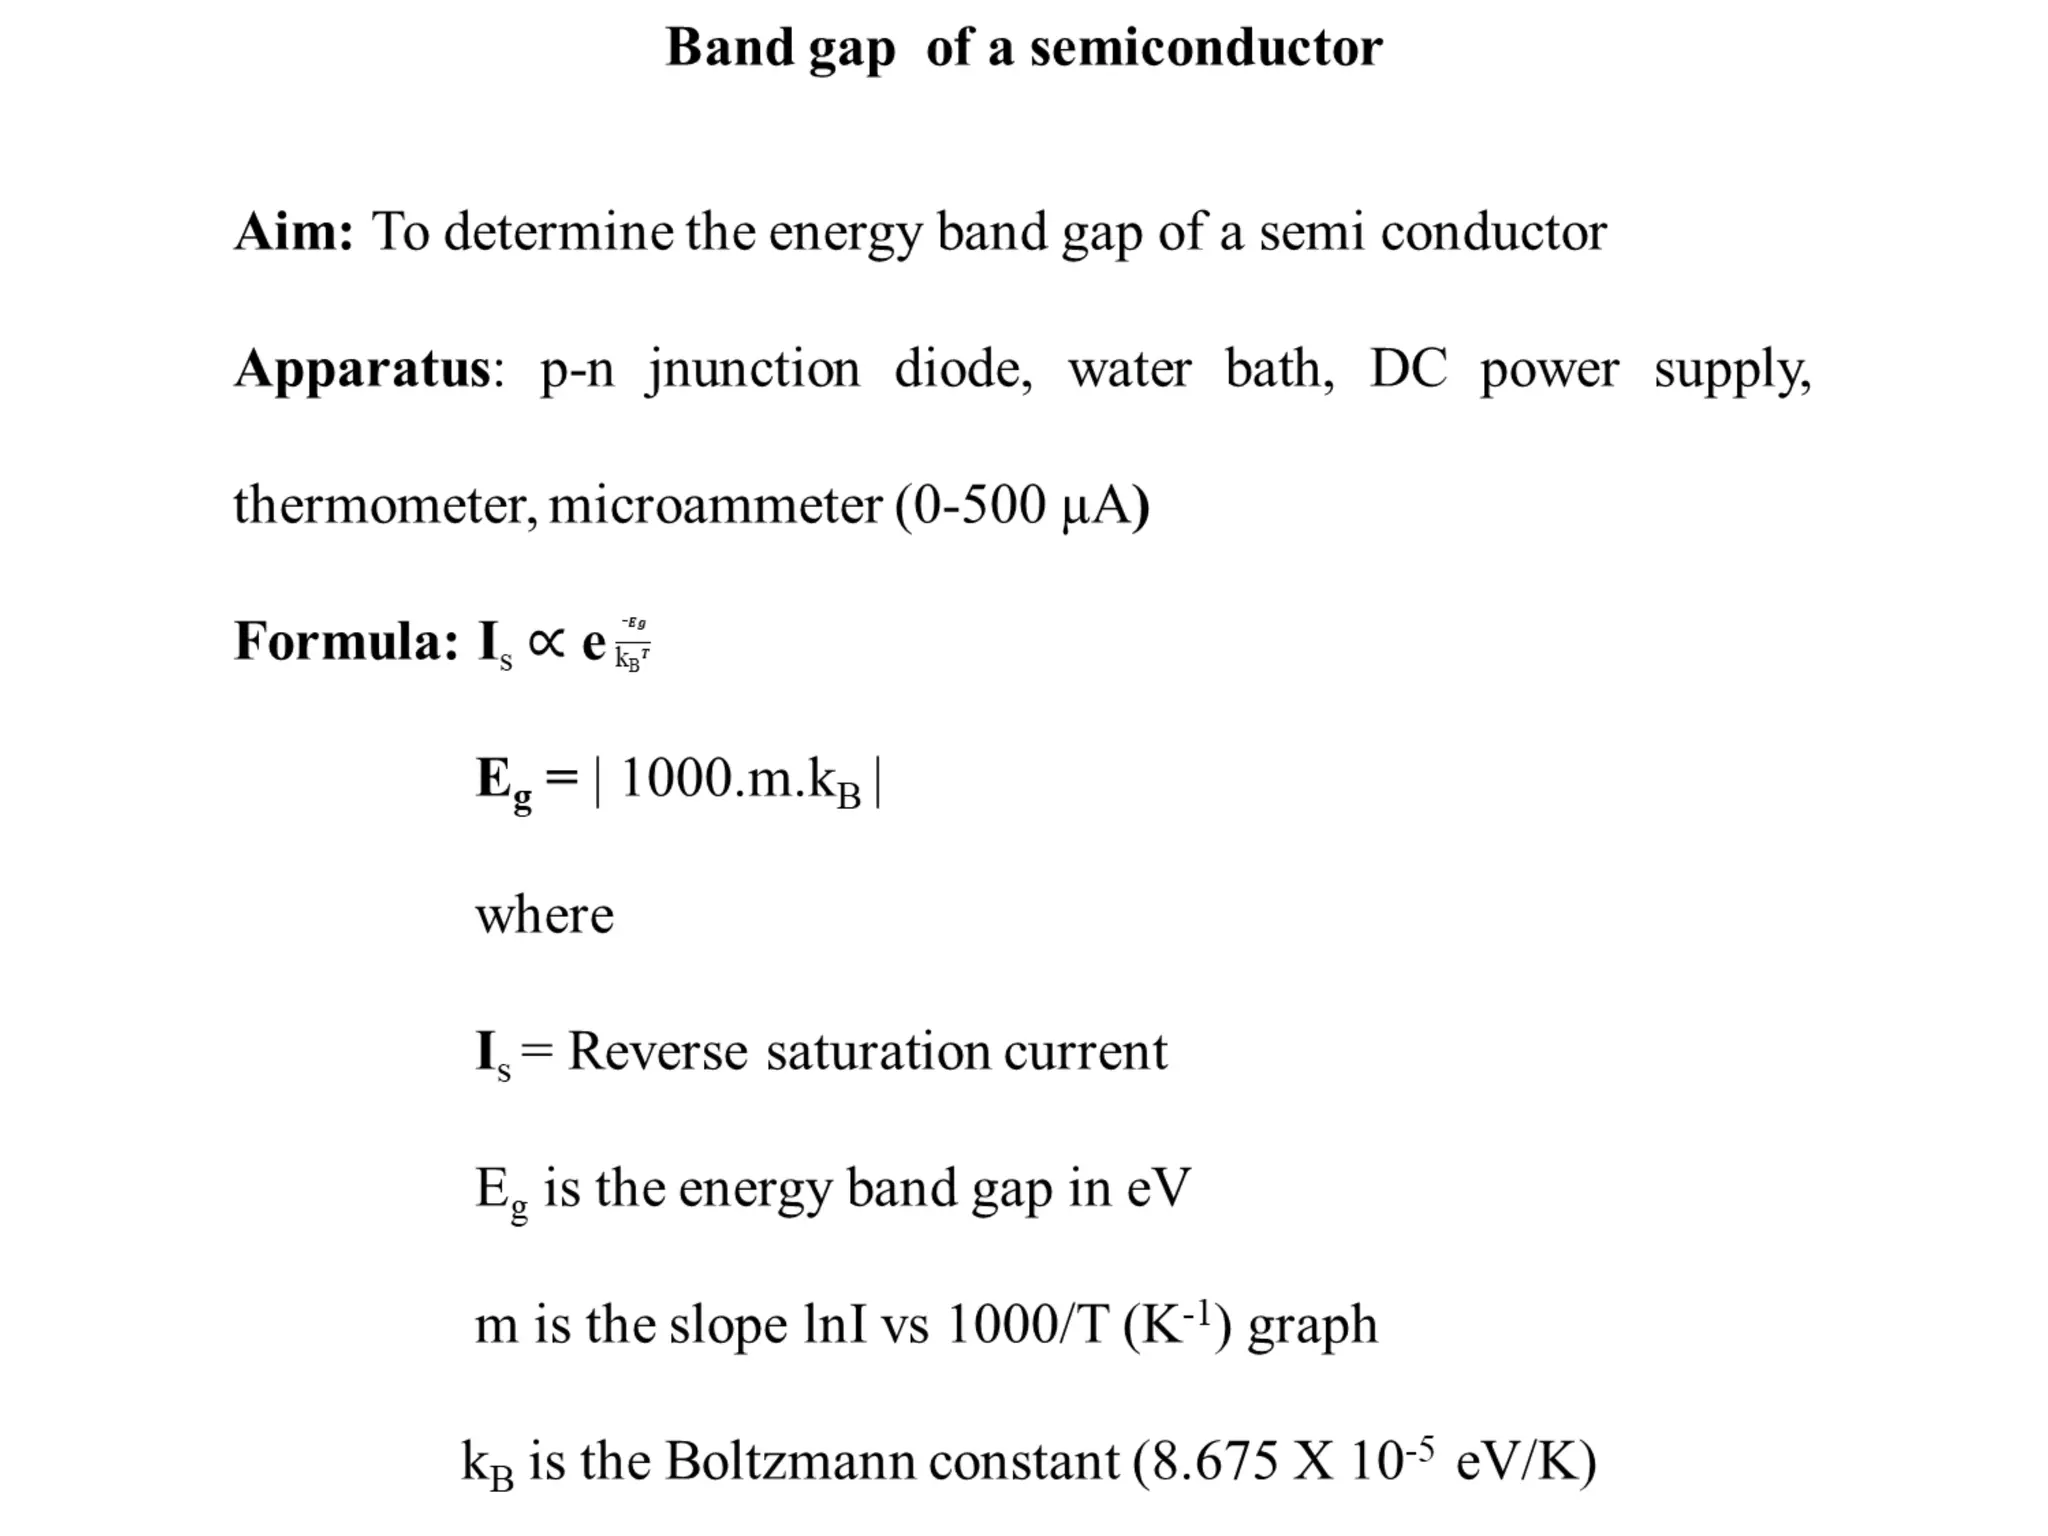
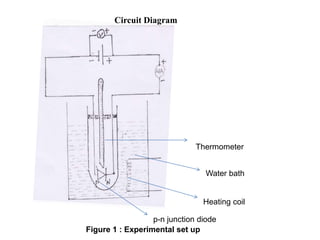
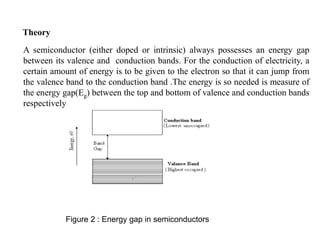
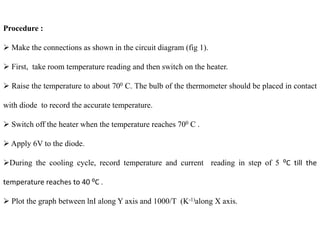
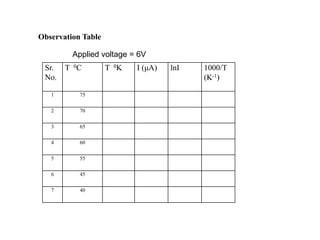
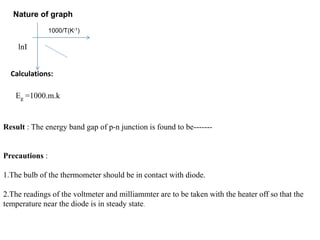
Aim: To determine the energy band gap of a semi-conductor
Apparatus: p-n junction diode, water bath, DC power supply,
thermometer, microammeter (0-500 µA)
Formula :
Is∝e-Eg/kBT
Eg = |1000.m.kB |
where
Is is saturation current
Eg is the energy band gap
m is the slope lnI vs 1000/T (K-1) graph
kB is the Boltzmann constant (8.675 X 10⁻⁵ eV/K)
Circuit Diagram
Thermometer
p-n junction diode
Water bath
Heating coil
Figure 1 : Experimental set up
A semiconductor (either doped or intrinsic) always possesses an energy gap
between its valence and conduction bands. For the conduction of electricity, a
certain amount of energy is to be given to the electron so that it can jump from
the valence band to the conduction band .The energy is so needed is measure of
the energy gap(Eg) between the top and bottom of valence and conduction bands
respectively.
Theory
Figure 2 : Energy gap in semiconductors
In semiconductors, at low temperatures there are few charge carriers to
move, so conductivity is quite low .However with increase in temperature,
more number of charge carriers get sufficient energy to be excited to the
conduction band this lead to increase in the number of free charge carriers
and hence increase in the conductivity. In addition to the dependence of the
electrical conductivity on the number of free charges ,it also depends on
their mobility .The mobility of the charge carriers however decreases with
increase in temperature. But on the average the conductivity of the
semiconductors rises with rise in temperature. To determine the energy band
gap of semiconducting material we study the variation of it conductance
with temperature in the reverse bias , the current flowing through the p-n
junction is quite small and internal heating of the junction does not take
place. When p-n junction is placed in reverse bias as shown in fig 1. the
current flows through the junction due to minority charge carriers only the
concentration of these charge carriers depend on the band gap each Eg
Procedure :
 Make the connections as shown in the circuit diagram (fig 1).
 First, take room temperature reading and then switch on the heater.
 Raise the temperature to about 700 C. The bulb of the thermometer should be placed in contact
with diode to record the accurate temperature.
 Switch off the heater when the temperature reaches 700 C .
 Apply 6V to the diode.
During the cooling cycle, record temperature and current reading in step of 5 ⁰C till the
temperature reaches to 40 ⁰C .
 Plot the graph between lnI along Y axis and 1000/T (K-1)along X axis.
Sr.
No.
T 0C T 0K I (μA) lnI 1000/T
(K-1)
1 75
2 70
3 65
4 60
5 55
6 45
7 40
Observation Table
Applied voltage = 6V
Calculations:
Eg =1000.m.k
Result : The energy band gap of p-n junction is found to be-------
Precautions :
1.The bulb of the thermometer should be in contact with diode.
2.The readings of the voltmeter and milliammter are to be taken with the heater off so that the
temperature near the diode is in steady state.
lnI
Nature of graph
1000/T(K-1)

energy band gap-corrected MK - Copy.pptx

  • 2.
    Aim: To determinethe energy band gap of a semi-conductor Apparatus: p-n junction diode, water bath, DC power supply, thermometer, microammeter (0-500 µA) Formula : Is∝e-Eg/kBT Eg = |1000.m.kB | where Is is saturation current Eg is the energy band gap m is the slope lnI vs 1000/T (K-1) graph kB is the Boltzmann constant (8.675 X 10⁻⁵ eV/K)
  • 3.
    Circuit Diagram Thermometer p-n junctiondiode Water bath Heating coil Figure 1 : Experimental set up
  • 4.
    A semiconductor (eitherdoped or intrinsic) always possesses an energy gap between its valence and conduction bands. For the conduction of electricity, a certain amount of energy is to be given to the electron so that it can jump from the valence band to the conduction band .The energy is so needed is measure of the energy gap(Eg) between the top and bottom of valence and conduction bands respectively. Theory Figure 2 : Energy gap in semiconductors
  • 5.
    In semiconductors, atlow temperatures there are few charge carriers to move, so conductivity is quite low .However with increase in temperature, more number of charge carriers get sufficient energy to be excited to the conduction band this lead to increase in the number of free charge carriers and hence increase in the conductivity. In addition to the dependence of the electrical conductivity on the number of free charges ,it also depends on their mobility .The mobility of the charge carriers however decreases with increase in temperature. But on the average the conductivity of the semiconductors rises with rise in temperature. To determine the energy band gap of semiconducting material we study the variation of it conductance with temperature in the reverse bias , the current flowing through the p-n junction is quite small and internal heating of the junction does not take place. When p-n junction is placed in reverse bias as shown in fig 1. the current flows through the junction due to minority charge carriers only the concentration of these charge carriers depend on the band gap each Eg
  • 6.
    Procedure :  Makethe connections as shown in the circuit diagram (fig 1).  First, take room temperature reading and then switch on the heater.  Raise the temperature to about 700 C. The bulb of the thermometer should be placed in contact with diode to record the accurate temperature.  Switch off the heater when the temperature reaches 700 C .  Apply 6V to the diode. During the cooling cycle, record temperature and current reading in step of 5 ⁰C till the temperature reaches to 40 ⁰C .  Plot the graph between lnI along Y axis and 1000/T (K-1)along X axis.
  • 7.
    Sr. No. T 0C T0K I (μA) lnI 1000/T (K-1) 1 75 2 70 3 65 4 60 5 55 6 45 7 40 Observation Table Applied voltage = 6V
  • 8.
    Calculations: Eg =1000.m.k Result :The energy band gap of p-n junction is found to be------- Precautions : 1.The bulb of the thermometer should be in contact with diode. 2.The readings of the voltmeter and milliammter are to be taken with the heater off so that the temperature near the diode is in steady state. lnI Nature of graph 1000/T(K-1)