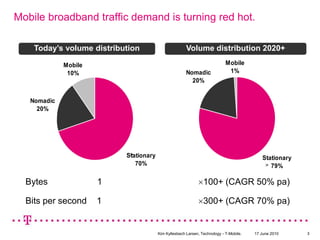
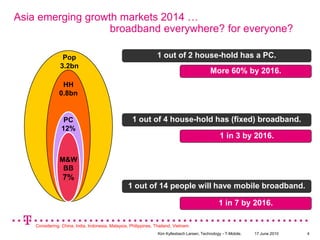
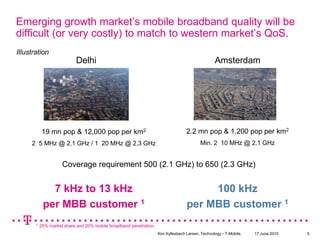
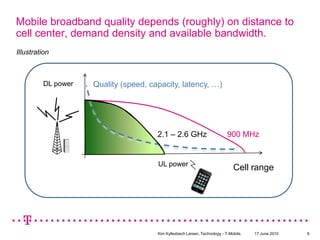
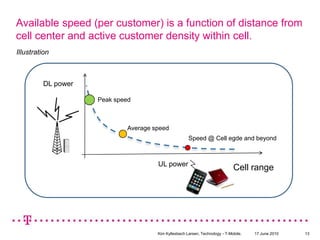
Beyond Boundaries: Leveraging No-Code Solutions for Industry Innovation
Emerging Markets QoS Expectations
1. Mobile broadbanddemand in emergingmarkets … will itbecomparabletodevelopedmarkets? WiMAX Forum Global Congress 2010, Amsterdam 17th June 2010. Dr. Kim Kyllesbech LarsenInternational Network Economics, Technology, T-Mobile
2. 17 June 2010 Kim Kyllesbech Larsen, Technology - T-Mobile. 2 Changing market - tomorrow’s world.Social trends and technological indicators. 25+ mn Mobile-TV users in APAC 1.60+ bn internet users. 350+ mn active users. 65+ mn mobile users. 2.5+ bnphotouploads /month $4.5+ bn mobile gaming revenue 3+ bn iPhone Appsdownloads. 20+ hrs video uploads / day 4.1+ bn mobile users. 250+ bn e-mails per day. 40+% more than 5 MB. 400+ mn registered users. 86+ mn active ebay users Digitize Socialize Individualize All IP … All Digital Networking and Sharing My-tech NOT Hi-tech
3. Mobile broadband traffic demand is turning red hot. Today’s volume distribution Volume distribution 2020+ > > Bytes 1 100+ (CAGR 50% pa) Bits per second 1 300+ (CAGR 70% pa) 17 June 2010 Kim Kyllesbech Larsen, Technology - T-Mobile. 3
4. Asia emerging growth markets 2014 … broadband everywhere? for everyone? 1 out of 2 house-hold has a PC. Pop 3.2bn More 60% by 2016. HH 0.8bn 1 out of 4 house-hold has (fixed) broadband. PC 12% 1 in 3 by 2016. M&W BB 7% 1 out of 14 people will have mobile broadband. 1 in 7 by 2016. Considering: China, India, Indonesia, Malaysia, Philippines, Thailand, Vietnam. 17 June 2010 Kim Kyllesbech Larsen, Technology - T-Mobile. 4
5. Emerging growth market’s mobile broadband quality will be difficult (or very costly) to match to western market’s QoS. Illustration Delhi Amsterdam 2.2 mn pop & 1,200 pop per km2 Min. 2×10 MHz @ 2.1 GHz 19 mn pop & 12,000 pop per km2 2×5 MHz @ 2.1 GHz / 1×20 MHz @ 2.3 GHz Coverage requirement 500 (2.1 GHz) to 650 (2.3 GHz) 7 kHz to 13 kHz per MBB customer 1 100 kHz per MBB customer 1 1 25% marketshare and 20% mobile broadbandpenetration. 17 June 2010 Kim Kyllesbech Larsen, Technology - T-Mobile. 5
6. Mobile broadband quality depends (roughly) on distance to cell center, demand density and available bandwidth. Illustration DL power Quality (speed, capacity, latency, …) 2.1 – 2.6 GHz 900 MHz UL power Cell range 17 June 2010 Kim Kyllesbech Larsen, Technology - T-Mobile. 6
7. The wired, the wireless and the mobile broadband. 100+ Illustration: relative usage 70↑+ 20 1 1/3 Mobile broadband 850 MHz – 2.1 GHz BWA 2.3 – 2.5+ GHz Fixed with WiFi Mobile broadband: hardly any QoS pricing mainly based on volumetric FUP. Wireless & Fixed Broadband business model uses QoS-based pricing. 17 June 2010 Kim Kyllesbech Larsen, Technology - T-Mobile. 7
8. Devices with a supporting web-based service ecosystem generates substantially more traffic than “normal handsets” Terminal distribution Corresponding volume 17 June 2010 Kim Kyllesbech Larsen, Technology - T-Mobile. 8
9. Need for speed depends on terminal device, price plan and supporting service ecosystems, e.g., Apps store, iTunes, p2p.. Illustration Increasinglatencyrequirements Increasingbandwidth and volumetricdemand 17 June 2010 Kim Kyllesbech Larsen, Technology - T-Mobile. 9
10. Streaming takes up 60% of mobile user generated http traffic. URL distribution Corresponding volume per URL Note: abovedistributions do notinclude peer-2-peer traffic. 17 June 2010 Kim Kyllesbech Larsen, Technology - T-Mobile. 10
11. Device performance drives mobile broadband usage. Illustration: relative volume-based usage versus device (& network) performance. > 20+% 3Gs: CPU ARM 600MHz (HSPA7.2Mbps) 3G: CPU ARM 412MHz (HSPA 3.6 Mbps) 2G: CPU ARM 412 MHz (EDGE 0.237 Mbps) 1 1 EDGE only market data 17 June 2010 Kim Kyllesbech Larsen, Technology - T-Mobile. 11
12. Mobile broadband usage versus pricing. Illustration: Volumetric demand versus price plan Volumetricdemand 34 × low mobile ×34 ×12 ×8 ×2 1 6 × low mobile Prepaid mobile ×0.2 of low mobile (contract). Prepaid laptop ×5.5 of low mobile (contract). 17 June 2010 Kim Kyllesbech Larsen, Technology - T-Mobile. 12
13. Available speed (per customer) is a function of distance from cell center and active customer density within cell. Illustration DL power Peak speed Average speed Speed @ Cell egde and beyond UL power Cell range 17 June 2010 Kim Kyllesbech Larsen, Technology - T-Mobile. 13
14. Emerging market broadband … “happy” short-term, a tougher future. Tougher future … QoS limitations. Dramatic Hz per customer drop! Relative quality drops High investment level required to maintain quality. Happy start … plenty of quality. Lots of Hz per customer! Good quality. Re-use site-grid or Greenfield with relative low TCO levels. 17 June 2010 Kim Kyllesbech Larsen, Technology - T-Mobile. 14
15. 17 June 2010 Kim Kyllesbech Larsen, Technology - T-Mobile. 15 The emerging market mobile broadband customer experience will depend on network quality, pricing and device portfolio (prepaid dominated?). demand density per available Hz is likely to be much higher compared to western markets customer is likely to experience worse broadband quality compared to that of developedmarkets.