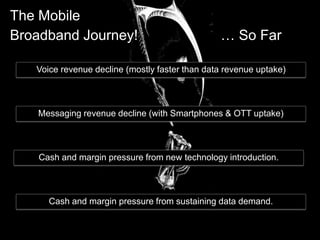
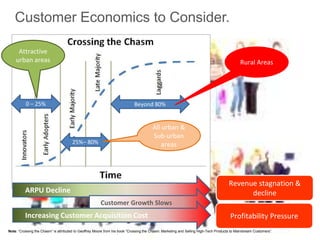
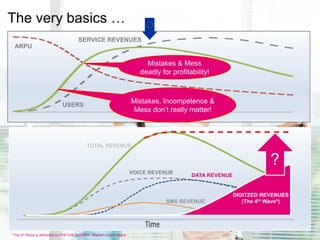
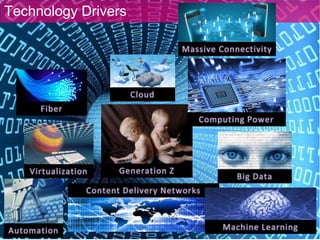
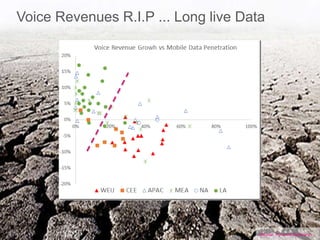
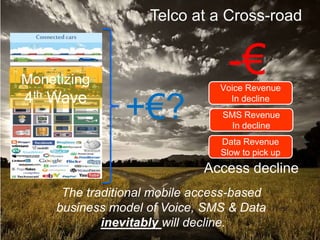
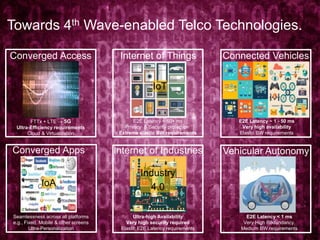
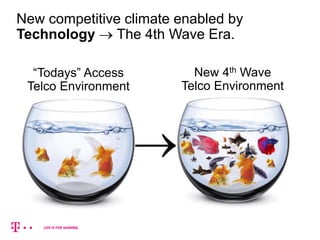
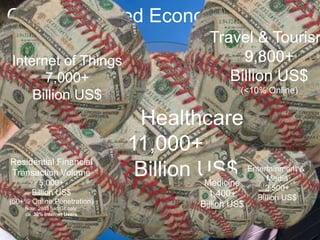
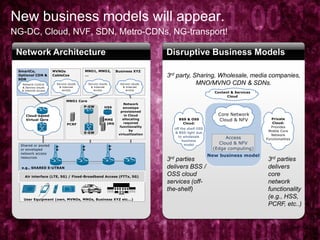
1
Dr. Kim Kyllesbech Larsen,
Group Technology, Deutsche Telekom.
Strategies to Achieve Maximum Profitability.
European CTO Telecoms Forum
18th January 2016, Amsterdam, The Netherlands.
Beyond
Launch
2
Messaging revenue decline (with Smartphones & OTT uptake)
Voice revenue decline (mostly faster than data revenue uptake)
Cash and margin pressure from new technology introduction.
Cash and margin pressure from sustaining data demand.
The Mobile
Broadband Journey! … So Far
3
Customer Economics to Consider.
0 – 25%
25%– 80%
Beyond 80%
ARPU Decline
Customer Growth Slows
Increasing Customer Acquisition Cost
Revenue stagnation &
decline
Profitability Pressure
Attractive
urban areas
All urban &
Sub-urban
areas
Rural Areas
Note: “Crossing the Chasm” is attributed to Geoffrey Moore from his book “Crossing the Chasm: Marketing and Selling High-Tech Products to Mainstream Customers”.
4
Time
USERS
ARPU
SERVICE REVENUES
Time
SMS REVENUE
VOICE REVENUE
DATA REVENUE
TOTAL REVENUE
DIGITZED REVENUES
(The 4th Wave*)
?
* The 4th Wave is attributed to CHETAN SHARMA, MobileFutureForward.
The very basics …
Mistakes & Mess
deadly for profitability!
Mistakes, Incompetence &
Mess don’t really matter!
Technology Drivers
6
Mobile Broadband Status 2015.
Source: 2011 – 2014 “Implementation of the EU regulatory framework for electronic communication – 2015”, EU
Commision, Brussels, 19 May 2015 (Final). 2015 presenter's guestimate.
85% of HH with LTE coverage.
80% of pop have mobile broadband access
7
Fixed Broadband Status 2015.
Source: 2011 – 2014 “Implementation of the EU regulatory framework for electronic communication – 2015”, EU
Commission, Brussels, 19 May 2015 (Final). 2015 presenter's guestimate.
30% of HH with 30 Mbps or more.
13% of HH with 100 Mbps or more.
8
Illustration
WEU – Technology migration.
Technology penetration from a user perspective.
Million
subscriptions
Source: Pyramid Research;
From 2019 onwards presentors extrapolations.
5G?
9
Mobile Economics 2010 - 2014.
Mobile Revenue has declined
faster than Opex
leading to a decline in profitability.
CAGR 2010 – 2014.
Source: BoA ML October 2015, “Global Wireless Matrix”.
10
Source: Pyramid Research.
Voice Revenues R.I.P ... Long live Data
1111
Telco at a Cross-road
-€
SMS Revenue
In decline
Voice Revenue
In decline
Data Revenue
Slow to pick up
The traditional mobile access-based
business model of Voice, SMS & Data
inevitably will decline.
+€?
Access decline
Monetizing
4th Wave
1212
Towards 4th Wave-enabled Telco Technologies.
Converged Access Internet of Things
Internet of Industries
Connected Vehicles
Converged Apps Vehicular Autonomy
E2E Latency < 1 ms
Very High Redundancy.
Medium BW requirements
E2E Latency ~ 1 - 50 ms
Very high availability
Elastic BW requirements
E2E Latency ~ 50+ ms
Privacy & Security protection
Extreme elastic BW requirements
Ultra-high Availability
Very high security required
Elastic E2E Latency requirements
FTTx + LTE  5G
Ultra-Efficiency requirements
Cloud & Virtualization
Seamlessness across all platforms
e.g., Fixed, Mobile & other screens
Ultra-Personalization
Industry
4.0IoA
IoT
“Todays” Access
Telco Environment
New 4th Wave
Telco Environment
New competitive climate enabled by
Technology  The 4th Wave Era.

14
+€?
What we strive for!
15
Our Industry Challenge.
Technology Marketing
3G  4G  5G “1G”
Cloudisation
Virtualization
Convergence
Access-based
thinking.
1616
100 Gbps
DWDM
10
GbE
Illustration
Technology Convergence…
a critical enabler for the Digitized Society!
OLT
MSAN
Cellular
Wholesale
NG-CN
Data Center(s)
w. Cloud, XaaS, SDN/NFV, CDN, …
Note: Croatia Telekom (Deutsche Telekom), Croatia’s largest telecommunications company, first one to deploy the new TeraStream cloud-enabled transport & data center architecture (in
partnership with Cisco). MSAN: Multi-Service Acccess Node, OLT: Optical Lite Termination. Sources: Peter Lothberg (DTAG) https://ripe67.ripe.net/presentations/131-ripe2-2.pdf &
http://www.internetsociety.org/deploy360/blog/2014/01/videoslides-case-study-of-terastreams-ipv6-implementation-ripe67/
Small cell
Node
Small cell
Small cell
Small cell
Intelligence & Services
Moves to Cloud & End-User Devices
Target Min 100+ Mbps at consumer edge
R1
R2
Pure Switching
& IP Routing
17
MOBILE
CONVINIENCE
HOMEDigitized!
RETAIL
Content
SECURITY
DEFENCE
HEALTH
SURVAILANC
E
SMART
GRID
DATA MINING
TOURISM
PROFESIONA
L SERVICES
TRANSPORT
BIONICS
QoE
ENVIRONMENT
18
Mobile
1,400+
Billion US$
(55% Data)
Global Digitized Economy 2020
Fixed
440+
Billion US$
(60% BB)
Mobile Banking
400+
Billion US$
Public Cloud
370+
Billion US$
Mobile Health
60+
Billion US$
M2M
140+
Billion US$
Mobile App
30+
Billion US$
Mobile Digital Advertising
170+ Billion US$
(70+% of Total)
Smartphones
250+ Billion US$
Mobile Content
8+ Billion US$
Another
Trillion Dollar+
Economy
in the most obvious
Digital Services.
Managed Cloud Services
4+ Billion US$
Sources: http://www.statista.com/ premium account.
Typically up-to 2020 has been projected based on available
data. This applies to the following page as well.
19
Mobile
1,400+
Billion US$
(55% Data)
Global Digitized Economy 2020
Fixed
440+
Billion US$
(60% BB)
Mobile Banking
400+
Billion US$
Public Cloud
370+
Billion US$
Mobile Health
60+
Billion US$
M2M
140+
Billion US$
Mobile App
30+
Billion US$
Mobile Digital Advertising
170+ Billion US$
(70+% of Total)
Smartphones
250+ Billion US$
Mobile Content
8+ Billion US$
Another
Trillion Dollar+
Economy
in the most obvious
Mobile Digital
Services Entertainment &
Media
2,500+
Billion US$
Travel & Tourism
9,800+
Billion US$
(<10% Online)
Internet of Things
7,000+
Billion US$
Residential Financial
Transaction Volume
5,000+
Billion US$
(50+% Online Penetration)
Note: 2013 had Globaly
ca. 30% Internet Users
Healthcare
11,000+
Billion US$Medicine
1,400+
Billion US$
20
21
First production vehicle designed through crowdsourcing.
Design chosen through a vote by open design community.
Developed at a fraction of normal development budget.
Co-creation process:
Engage customers through
Co-creation!
22
Engage customers through Co-creation!
250+ thousand
product ideas
since 2008!
Product ideas
23
Network Architecture
New business models will appear.
NG-DC, Cloud, NVF, SDN, Metro-CDNs, NG-transport!
Disruptive Business Models
3rd parties
delivers
core
network
functionality
(e.g., HSS,
PCRF, etc..)
3rd parties
delivers BSS /
OSS cloud
services (off-
the-shelf)
3rd party, Sharing, Wholesale, media companies,
MNO/MVNO CDN & SDNs.
24
Rapidly
towards
The challenges
we face are NOT
Technology!
It is how to
Quantum Leap
Marketing
25
Thank you!
Dr. Kim Kyllesbech Larsen
Follow Dr. Kim on Twitter @KimKLarsen
Blog: www.TechNEconomyBlog.com
Presentations: http://www.slideshare.net/KimKyllesbechLarsen
Acknowledgement: I am indebted to my wife Eva Varadi for her great support,
patience and understanding during the creation of this presentation. Further, I
would also like to thank Chetan Sharma (Future Mobile Forward) for his incredible
inspirational papers on “The 4th Wave”.

Beyond LTE Launch

  • 1.
    1 Dr. Kim KyllesbechLarsen, Group Technology, Deutsche Telekom. Strategies to Achieve Maximum Profitability. European CTO Telecoms Forum 18th January 2016, Amsterdam, The Netherlands. Beyond Launch
  • 2.
    2 Messaging revenue decline(with Smartphones & OTT uptake) Voice revenue decline (mostly faster than data revenue uptake) Cash and margin pressure from new technology introduction. Cash and margin pressure from sustaining data demand. The Mobile Broadband Journey! … So Far
  • 3.
    3 Customer Economics toConsider. 0 – 25% 25%– 80% Beyond 80% ARPU Decline Customer Growth Slows Increasing Customer Acquisition Cost Revenue stagnation & decline Profitability Pressure Attractive urban areas All urban & Sub-urban areas Rural Areas Note: “Crossing the Chasm” is attributed to Geoffrey Moore from his book “Crossing the Chasm: Marketing and Selling High-Tech Products to Mainstream Customers”.
  • 4.
    4 Time USERS ARPU SERVICE REVENUES Time SMS REVENUE VOICEREVENUE DATA REVENUE TOTAL REVENUE DIGITZED REVENUES (The 4th Wave*) ? * The 4th Wave is attributed to CHETAN SHARMA, MobileFutureForward. The very basics … Mistakes & Mess deadly for profitability! Mistakes, Incompetence & Mess don’t really matter!
  • 5.
  • 6.
    6 Mobile Broadband Status2015. Source: 2011 – 2014 “Implementation of the EU regulatory framework for electronic communication – 2015”, EU Commision, Brussels, 19 May 2015 (Final). 2015 presenter's guestimate. 85% of HH with LTE coverage. 80% of pop have mobile broadband access
  • 7.
    7 Fixed Broadband Status2015. Source: 2011 – 2014 “Implementation of the EU regulatory framework for electronic communication – 2015”, EU Commission, Brussels, 19 May 2015 (Final). 2015 presenter's guestimate. 30% of HH with 30 Mbps or more. 13% of HH with 100 Mbps or more.
  • 8.
    8 Illustration WEU – Technologymigration. Technology penetration from a user perspective. Million subscriptions Source: Pyramid Research; From 2019 onwards presentors extrapolations. 5G?
  • 9.
    9 Mobile Economics 2010- 2014. Mobile Revenue has declined faster than Opex leading to a decline in profitability. CAGR 2010 – 2014. Source: BoA ML October 2015, “Global Wireless Matrix”.
  • 10.
    10 Source: Pyramid Research. VoiceRevenues R.I.P ... Long live Data
  • 11.
    1111 Telco at aCross-road -€ SMS Revenue In decline Voice Revenue In decline Data Revenue Slow to pick up The traditional mobile access-based business model of Voice, SMS & Data inevitably will decline. +€? Access decline Monetizing 4th Wave
  • 12.
    1212 Towards 4th Wave-enabledTelco Technologies. Converged Access Internet of Things Internet of Industries Connected Vehicles Converged Apps Vehicular Autonomy E2E Latency < 1 ms Very High Redundancy. Medium BW requirements E2E Latency ~ 1 - 50 ms Very high availability Elastic BW requirements E2E Latency ~ 50+ ms Privacy & Security protection Extreme elastic BW requirements Ultra-high Availability Very high security required Elastic E2E Latency requirements FTTx + LTE  5G Ultra-Efficiency requirements Cloud & Virtualization Seamlessness across all platforms e.g., Fixed, Mobile & other screens Ultra-Personalization Industry 4.0IoA IoT
  • 13.
    “Todays” Access Telco Environment New4th Wave Telco Environment New competitive climate enabled by Technology  The 4th Wave Era. 
  • 14.
  • 15.
    15 Our Industry Challenge. TechnologyMarketing 3G  4G  5G “1G” Cloudisation Virtualization Convergence Access-based thinking.
  • 16.
    1616 100 Gbps DWDM 10 GbE Illustration Technology Convergence… acritical enabler for the Digitized Society! OLT MSAN Cellular Wholesale NG-CN Data Center(s) w. Cloud, XaaS, SDN/NFV, CDN, … Note: Croatia Telekom (Deutsche Telekom), Croatia’s largest telecommunications company, first one to deploy the new TeraStream cloud-enabled transport & data center architecture (in partnership with Cisco). MSAN: Multi-Service Acccess Node, OLT: Optical Lite Termination. Sources: Peter Lothberg (DTAG) https://ripe67.ripe.net/presentations/131-ripe2-2.pdf & http://www.internetsociety.org/deploy360/blog/2014/01/videoslides-case-study-of-terastreams-ipv6-implementation-ripe67/ Small cell Node Small cell Small cell Small cell Intelligence & Services Moves to Cloud & End-User Devices Target Min 100+ Mbps at consumer edge R1 R2 Pure Switching & IP Routing
  • 17.
  • 18.
    18 Mobile 1,400+ Billion US$ (55% Data) GlobalDigitized Economy 2020 Fixed 440+ Billion US$ (60% BB) Mobile Banking 400+ Billion US$ Public Cloud 370+ Billion US$ Mobile Health 60+ Billion US$ M2M 140+ Billion US$ Mobile App 30+ Billion US$ Mobile Digital Advertising 170+ Billion US$ (70+% of Total) Smartphones 250+ Billion US$ Mobile Content 8+ Billion US$ Another Trillion Dollar+ Economy in the most obvious Digital Services. Managed Cloud Services 4+ Billion US$ Sources: http://www.statista.com/ premium account. Typically up-to 2020 has been projected based on available data. This applies to the following page as well.
  • 19.
    19 Mobile 1,400+ Billion US$ (55% Data) GlobalDigitized Economy 2020 Fixed 440+ Billion US$ (60% BB) Mobile Banking 400+ Billion US$ Public Cloud 370+ Billion US$ Mobile Health 60+ Billion US$ M2M 140+ Billion US$ Mobile App 30+ Billion US$ Mobile Digital Advertising 170+ Billion US$ (70+% of Total) Smartphones 250+ Billion US$ Mobile Content 8+ Billion US$ Another Trillion Dollar+ Economy in the most obvious Mobile Digital Services Entertainment & Media 2,500+ Billion US$ Travel & Tourism 9,800+ Billion US$ (<10% Online) Internet of Things 7,000+ Billion US$ Residential Financial Transaction Volume 5,000+ Billion US$ (50+% Online Penetration) Note: 2013 had Globaly ca. 30% Internet Users Healthcare 11,000+ Billion US$Medicine 1,400+ Billion US$
  • 20.
  • 21.
    21 First production vehicledesigned through crowdsourcing. Design chosen through a vote by open design community. Developed at a fraction of normal development budget. Co-creation process: Engage customers through Co-creation!
  • 22.
    22 Engage customers throughCo-creation! 250+ thousand product ideas since 2008! Product ideas
  • 23.
    23 Network Architecture New businessmodels will appear. NG-DC, Cloud, NVF, SDN, Metro-CDNs, NG-transport! Disruptive Business Models 3rd parties delivers core network functionality (e.g., HSS, PCRF, etc..) 3rd parties delivers BSS / OSS cloud services (off- the-shelf) 3rd party, Sharing, Wholesale, media companies, MNO/MVNO CDN & SDNs.
  • 24.
    24 Rapidly towards The challenges we faceare NOT Technology! It is how to Quantum Leap Marketing
  • 25.
    25 Thank you! Dr. KimKyllesbech Larsen Follow Dr. Kim on Twitter @KimKLarsen Blog: www.TechNEconomyBlog.com Presentations: http://www.slideshare.net/KimKyllesbechLarsen Acknowledgement: I am indebted to my wife Eva Varadi for her great support, patience and understanding during the creation of this presentation. Further, I would also like to thank Chetan Sharma (Future Mobile Forward) for his incredible inspirational papers on “The 4th Wave”.