

![12
12
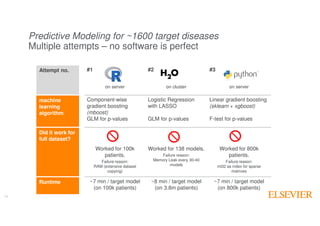
# model 1: component-wise linear boosting
boost_train_ds <- glmboost(as.formula(paste(icd_atc_use_names[i],"~.")),
data=data[ins,][c(which_one,sample(which_zero,(length(which_one)),replace=F)),],
family=Binomial(), control=boost_control(mstop=400,trace=T,center=F))
...
# model 1: GLM with ElasticNet
model1 = H2OGeneralizedLinearEstimator(model_id=post_col, family = 'binomial', solver='IRLSM',
alpha = 0.99, #mainly LASSO
lambda_search=True, standardize=True, intercept=True)
model1.train(x=index_cols, y=post_col, training_frame=training, validation_frame=val)
...
+ XGBoost
+ mboost
# model 1: component-wise linear boosting
params={'silent': 0, 'nthread': 4,
'eval_metric':['error','map','map@'+str(top1percent_train),'map@'+str(top1percent_eval),'auc'],
'objective': 'binary:logistic', 'booster': 'gblinear',
'lambda': 0, #L2 regularization (Ridge) none
'alpha': 500} #L1 regularization (LASSO)
booster = xgb.train( params, dtrain, num_boost_round=settings.boosting_iterations,
evals=[(dtrain,'train'),(dtest,'eval')], early_stopping_rounds=10, evals_result =quality)
...
Code for model building](https://image.slidesharecdn.com/1200hellwig-161207102207/85/Elsevier-Medical-Graph-mit-Machine-Learning-zu-Precision-Medicine-12-320.jpg)
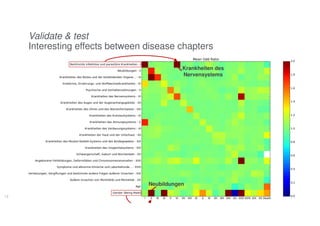
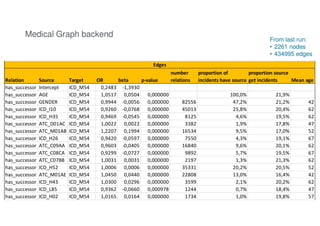
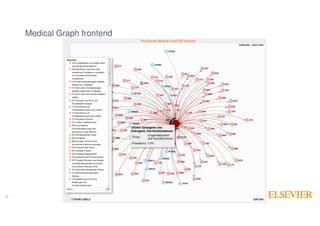

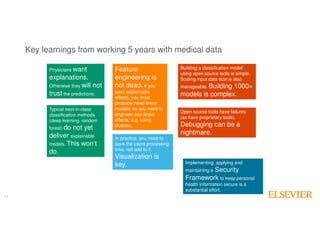

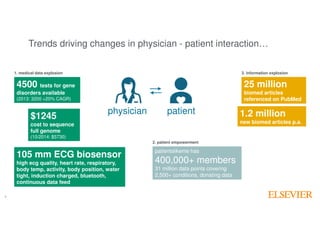
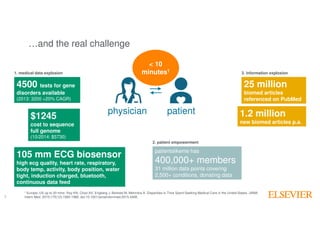
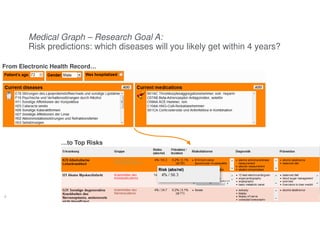
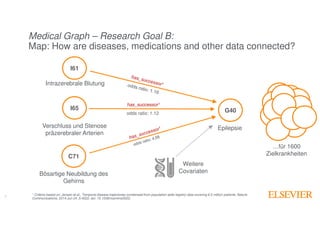
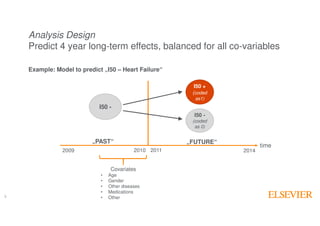
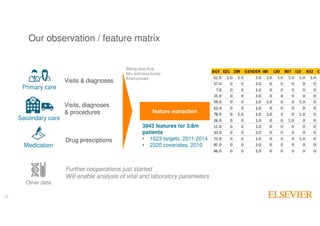
The document outlines Elsevier Health Analytics' efforts to leverage big data and medical analytics for personalized decision support in clinical settings, focusing on enhancing physician-patient interactions amidst an information explosion in biomedical articles and patient data. It discusses the development of a medical graph aimed at predicting disease risks and connections between various health data points, highlighting challenges in predictive modeling and the need for explainable AI. Key takeaways include the importance of explanations for physicians, the complexity of scaling models, and the necessity of effective visualization in data analysis.

![[Review] High-performance medicine: the convergence of human and artificial i...](https://cdn.slidesharecdn.com/ss_thumbnails/reviewhigh-performancemedicine-190728142338-thumbnail.jpg?width=640&height=640&fit=bounds)