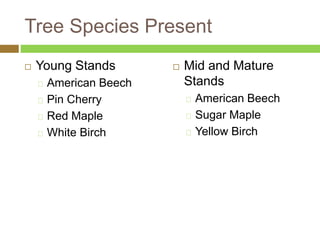
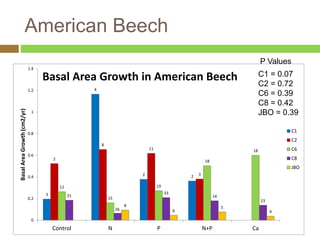
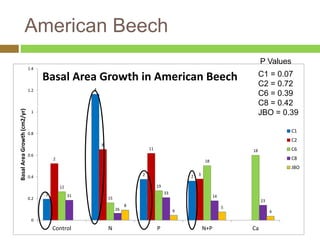
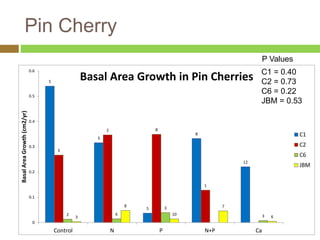
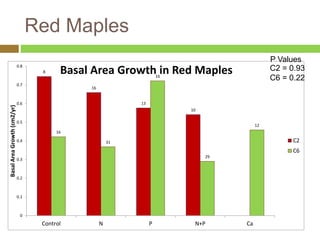
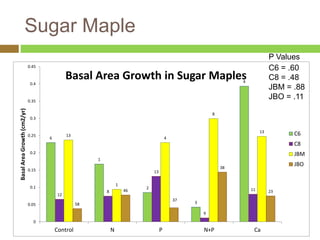
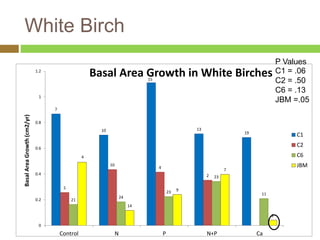
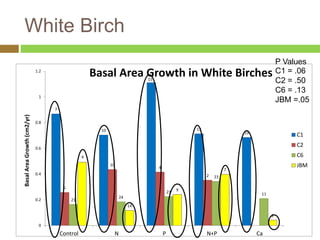
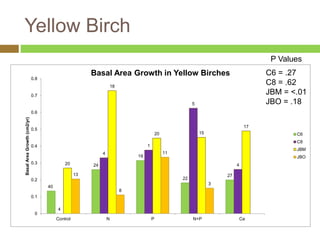
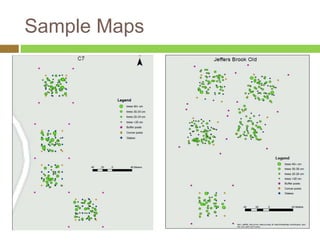
Do fertilized trees grow 
faster? 
Looking for a growth response in the 
MELNHE stands 
Shoestring REU 
Eli Egan-Anderson 
Cornell ‘15
Background 
 Nitrogen (N) is one of the major limiting 
nutrients for net primary production (NPP) 
and is required in large amounts by plants 
(Vitousek and 
Howarth 1991) 
It is one of the 
requirements of 
photosynthesis
Co-limitation 
 Multiple Element Limitation (MEL) describes 
plants effort allocation for acquiring different 
nutrients (Rastetter 1997) 
 Phosphorus (P) has been found to be a major 
limiting factor when N is available in large 
quantities (Walker and Syers 1976) 
 In N+P plots there are larger amounts of 
organically available N than in plots where just 
N was added (Fisk et al 2014)
Predictions for the Study 
 I expected to see positive growth in all stands 
where fertilizer has been added 
More growth in N plots of younger stands 
Expected the most growth will be found in N+P 
plots at young ages
Methods 
 Diameter growth inventory stands 
C1, C2 and C6 
Young 
 C1 cut in 1990 
 C2 cut in 1988 
 All trees with diameters over 10 
cm in 2011 were measured and 
recorded
Methods 
 Diameter growth inventory stands 
C1, C2 and C6 
Mid aged 
 C6 cut in 1975 
 JBM cut in 1985 
 All trees with diameters over 10 
cm in 2011 were measured and 
recorded
Methods 
 Diameter growth inventory stands 
C1, C2 and C6 
Mature 
 C8 cut in1883 
 JBO cut in 1900 
 All trees with diameters over 10 
cm in 2011 were measured and 
recorded
Methods Cont. 
 Nail was placed at 1.57 m 
and a 20 cm dowel was 
hung from the nail to 
measure below at DBH 
 Compared findings to pre-treatment 
data from 2011
Summary of original findings 
 We measured in June/early July 
Only significance before was white 
birch in C2 
 No longer statistically significant 
 Some new results have slightly 
different conclusions
Tree Species Present 
 Young Stands 
American Beech 
Pin Cherry 
Red Maple 
White Birch 
 Mid and Mature 
Stands 
American Beech 
Sugar Maple 
Yellow Birch
American Beech 
3 
4 
2 2 
2 
8 
11 
3 
12 
15 
19 
18 
18 
31 
26 
33 
14 
C1 = 0.07 
C2 = 0.72 
C6 = 0.39 
C8 = 0.42 
JBO = 0.39 
23 
8 
6 
5 
4 
1.4 
1.2 
1 
0.8 
0.6 
0.4 
0.2 
0 
Control N P N+P Ca 
Basal Area Growth (cm2/yr) 
Basal Area Growth in American Beech 
C1 
C2 
C6 
C8 
JBO 
P Values
American Beech 
3 
4 
2 2 
2 
8 
11 
3 
12 
15 
19 
18 
18 
31 
26 
33 
14 
C1 = 0.07 
C2 = 0.72 
C6 = 0.39 
C8 = 0.42 
JBO = 0.39 
23 
8 
6 
5 
4 
1.4 
1.2 
1 
0.8 
0.6 
0.4 
0.2 
0 
Control N P N+P Ca 
Basal Area Growth (cm2/yr) 
Basal Area Growth in American Beech 
C1 
C2 
C6 
C8 
JBO 
P Values
Pin Cherry 
5 
3 
5 
8 
12 
3 
2 8 
1 
2 6 
3 
8 
10 
7 
C1 = 0.40 
C2 = 0.73 
C6 = 0.22 
JBM = 0.53 
3 3 
6 
0.6 
0.5 
0.4 
0.3 
0.2 
0.1 
0 
Control N P N+P Ca 
Basal Area Growth (cm2/yr) 
Basal Area Growth in Pin Cherries 
C1 
C2 
C6 
JBM 
P Values
Red Maples 
8 
16 
13 
10 
16 
31 
16 
29 
12 
0.8 
0.7 
0.6 
0.5 
0.4 
0.3 
0.2 
0.1 
0 
Control N P N+P Ca 
Basal Area Growth (cm2/yr) 
Basal Area Growth in Red Maples 
P Values 
C2 = 0.93 
C6 = 0.22 
C2 
C6
Sugar Maple 
6 
1 
2 
3 
4 
12 
8 
13 
9 
11 
13 
1 
4 
8 
13 
58 
46 
37 
38 
P Values 
C6 = .60 
C8 = .48 
JBM = .88 
JBO = .11 
23 
0.45 
0.4 
0.35 
0.3 
0.25 
0.2 
0.15 
0.1 
0.05 
0 
Control N P N+P Ca 
Basal Area Growth (cm2/yr) 
Basal Area Growth in Sugar Maples 
C6 
C8 
JBM 
JBO
White Birch 
7 
10 
15 
13 
19 
5 
10 
4 
2 
21 
24 
23 
23 
11 
4 
14 
9 
7 
2 
1.2 
1 
0.8 
0.6 
0.4 
0.2 
0 
Control N P N+P Ca 
Basal Area Growth (cm2/yr) 
Basal Area Growth in White Birches 
P Values 
C1 = .06 
C2 = .50 
C6 = .13 
JBM =.05 
C1 
C2 
C6 
JBM
White Birch 
7 
10 
15 
13 
19 
5 
10 
4 
2 
21 
24 
23 
23 
11 
4 
14 
9 
7 
2 
1.2 
1 
0.8 
0.6 
0.4 
0.2 
0 
Control N P N+P Ca 
Basal Area Growth (cm2/yr) 
Basal Area Growth in White Birches 
P Values 
C1 = .06 
C2 = .50 
C6 = .13 
JBM =.05 
C1 
C2 
C6 
JBM
40 
24 
19 
20 15 
22 
27 
4 
4 
1 
5 
18 
20 4 
17 
13 
8 
11 
3 
0.8 
0.7 
0.6 
0.5 
0.4 
0.3 
0.2 
0.1 
0 
Control N P N+P Ca 
Basal Area Growth (cm2/yr) 
Basal Area Growth in Yellow Birches 
C6 
C8 
JBM 
JBO 
Yellow Birch 
P Values 
C6 = .27 
C8 = .62 
JBM = <.01 
JBO = .18
40 
24 
19 
20 15 
22 
27 
4 
4 
1 
5 
18 
20 4 
17 
13 
8 
11 
3 
0.8 
0.7 
0.6 
0.5 
0.4 
0.3 
0.2 
0.1 
0 
Control N P N+P Ca 
Basal Area Growth (cm2/yr) 
Basal Area Growth in Yellow Birches 
C6 
C8 
JBM 
JBO 
Yellow Birch 
P Values 
C6 = .27 
C8 = .62 
JBM = <.01 
JBO = .18
Issues of note 
 Hard to assign strong statistical 
analysis to the plots with only one 
or two trees of a species 
 Trees magically shrinking and 
moving
Discussion 
 Yellow birch shows a strong 
response close to what we were 
expecting 
 C2 white birch no longer appears 
significant, other white birch 
significant results contradict what 
we found earlier
Stem Mapping 
Goals Methods 
 Goals: to create a 
georeferenced map 
of all trees with a 
DBH above 10 cm in 
the mature stands 
 Took a distance with a 
hypsometer and angle 
from corner post to 
trees 
 Input points based on 
UTM stake 
coordinates from Matt 
Vadeboncoeur
Sample Maps
Implications 
 Help us to understand nutrient limitations of 
the Northern forests 
 Addresses factors we may see with an 
increase in N deposition 
 Helps to understand cost benefit of fertilizers 
as an option for silvicultural practices 
 Maps help us understand how trees and 
species within our stands interact
Acknowledgements and 
Citations 
 Our glorious leader 
(Adam Wild) 
 Shinjini Goswami 
 Ruth Yanai 
 Timothy Fahey 
 Matt Vadeboncoeur 
 Shoestringers 
 Fisk M. Ratliff T. Goswami, S and 
Yanai, R (2014). Synergistic soil 
response to nitrogen plus 
phosphorus. fertilization in hardwood 
forests. Biogeochemistry DOI 
10.1007/s10533-013-9918-1 
 Rastetter, E. B., G. I. Ågren and G. 
R. Shaver. 1997. Responses of N-limited 
ecosystems to increased CO2: 
A balanced-nutrition, coupled-element- 
cycles model. Ecological 
Applications 7:444-460. 
 Vitousek, P. M., and R. W. Howarth. 
1991. Nitrogen limitation on land and 
in the sea—How can it occur. 
Biogeochemistry 13:87–115. 
 Walker, T and Syers, J. 1976. The 
fate of phosphorus during 
pedogenesis. Geoderma 15(1): 1-19

Eli inventory REUcon

  • 1.
    Do fertilized treesgrow faster? Looking for a growth response in the MELNHE stands Shoestring REU Eli Egan-Anderson Cornell ‘15
  • 2.
    Background  Nitrogen(N) is one of the major limiting nutrients for net primary production (NPP) and is required in large amounts by plants (Vitousek and Howarth 1991) It is one of the requirements of photosynthesis
  • 3.
    Co-limitation  MultipleElement Limitation (MEL) describes plants effort allocation for acquiring different nutrients (Rastetter 1997)  Phosphorus (P) has been found to be a major limiting factor when N is available in large quantities (Walker and Syers 1976)  In N+P plots there are larger amounts of organically available N than in plots where just N was added (Fisk et al 2014)
  • 4.
    Predictions for theStudy  I expected to see positive growth in all stands where fertilizer has been added More growth in N plots of younger stands Expected the most growth will be found in N+P plots at young ages
  • 5.
    Methods  Diametergrowth inventory stands C1, C2 and C6 Young  C1 cut in 1990  C2 cut in 1988  All trees with diameters over 10 cm in 2011 were measured and recorded
  • 6.
    Methods  Diametergrowth inventory stands C1, C2 and C6 Mid aged  C6 cut in 1975  JBM cut in 1985  All trees with diameters over 10 cm in 2011 were measured and recorded
  • 7.
    Methods  Diametergrowth inventory stands C1, C2 and C6 Mature  C8 cut in1883  JBO cut in 1900  All trees with diameters over 10 cm in 2011 were measured and recorded
  • 8.
    Methods Cont. Nail was placed at 1.57 m and a 20 cm dowel was hung from the nail to measure below at DBH  Compared findings to pre-treatment data from 2011
  • 9.
    Summary of originalfindings  We measured in June/early July Only significance before was white birch in C2  No longer statistically significant  Some new results have slightly different conclusions
  • 10.
    Tree Species Present  Young Stands American Beech Pin Cherry Red Maple White Birch  Mid and Mature Stands American Beech Sugar Maple Yellow Birch
  • 11.
    American Beech 3 4 2 2 2 8 11 3 12 15 19 18 18 31 26 33 14 C1 = 0.07 C2 = 0.72 C6 = 0.39 C8 = 0.42 JBO = 0.39 23 8 6 5 4 1.4 1.2 1 0.8 0.6 0.4 0.2 0 Control N P N+P Ca Basal Area Growth (cm2/yr) Basal Area Growth in American Beech C1 C2 C6 C8 JBO P Values
  • 12.
    American Beech 3 4 2 2 2 8 11 3 12 15 19 18 18 31 26 33 14 C1 = 0.07 C2 = 0.72 C6 = 0.39 C8 = 0.42 JBO = 0.39 23 8 6 5 4 1.4 1.2 1 0.8 0.6 0.4 0.2 0 Control N P N+P Ca Basal Area Growth (cm2/yr) Basal Area Growth in American Beech C1 C2 C6 C8 JBO P Values
  • 13.
    Pin Cherry 5 3 5 8 12 3 2 8 1 2 6 3 8 10 7 C1 = 0.40 C2 = 0.73 C6 = 0.22 JBM = 0.53 3 3 6 0.6 0.5 0.4 0.3 0.2 0.1 0 Control N P N+P Ca Basal Area Growth (cm2/yr) Basal Area Growth in Pin Cherries C1 C2 C6 JBM P Values
  • 14.
    Red Maples 8 16 13 10 16 31 16 29 12 0.8 0.7 0.6 0.5 0.4 0.3 0.2 0.1 0 Control N P N+P Ca Basal Area Growth (cm2/yr) Basal Area Growth in Red Maples P Values C2 = 0.93 C6 = 0.22 C2 C6
  • 15.
    Sugar Maple 6 1 2 3 4 12 8 13 9 11 13 1 4 8 13 58 46 37 38 P Values C6 = .60 C8 = .48 JBM = .88 JBO = .11 23 0.45 0.4 0.35 0.3 0.25 0.2 0.15 0.1 0.05 0 Control N P N+P Ca Basal Area Growth (cm2/yr) Basal Area Growth in Sugar Maples C6 C8 JBM JBO
  • 16.
    White Birch 7 10 15 13 19 5 10 4 2 21 24 23 23 11 4 14 9 7 2 1.2 1 0.8 0.6 0.4 0.2 0 Control N P N+P Ca Basal Area Growth (cm2/yr) Basal Area Growth in White Birches P Values C1 = .06 C2 = .50 C6 = .13 JBM =.05 C1 C2 C6 JBM
  • 17.
    White Birch 7 10 15 13 19 5 10 4 2 21 24 23 23 11 4 14 9 7 2 1.2 1 0.8 0.6 0.4 0.2 0 Control N P N+P Ca Basal Area Growth (cm2/yr) Basal Area Growth in White Birches P Values C1 = .06 C2 = .50 C6 = .13 JBM =.05 C1 C2 C6 JBM
  • 18.
    40 24 19 20 15 22 27 4 4 1 5 18 20 4 17 13 8 11 3 0.8 0.7 0.6 0.5 0.4 0.3 0.2 0.1 0 Control N P N+P Ca Basal Area Growth (cm2/yr) Basal Area Growth in Yellow Birches C6 C8 JBM JBO Yellow Birch P Values C6 = .27 C8 = .62 JBM = <.01 JBO = .18
  • 19.
    40 24 19 20 15 22 27 4 4 1 5 18 20 4 17 13 8 11 3 0.8 0.7 0.6 0.5 0.4 0.3 0.2 0.1 0 Control N P N+P Ca Basal Area Growth (cm2/yr) Basal Area Growth in Yellow Birches C6 C8 JBM JBO Yellow Birch P Values C6 = .27 C8 = .62 JBM = <.01 JBO = .18
  • 20.
    Issues of note  Hard to assign strong statistical analysis to the plots with only one or two trees of a species  Trees magically shrinking and moving
  • 21.
    Discussion  Yellowbirch shows a strong response close to what we were expecting  C2 white birch no longer appears significant, other white birch significant results contradict what we found earlier
  • 22.
    Stem Mapping GoalsMethods  Goals: to create a georeferenced map of all trees with a DBH above 10 cm in the mature stands  Took a distance with a hypsometer and angle from corner post to trees  Input points based on UTM stake coordinates from Matt Vadeboncoeur
  • 23.
  • 24.
    Implications  Helpus to understand nutrient limitations of the Northern forests  Addresses factors we may see with an increase in N deposition  Helps to understand cost benefit of fertilizers as an option for silvicultural practices  Maps help us understand how trees and species within our stands interact
  • 25.
    Acknowledgements and Citations  Our glorious leader (Adam Wild)  Shinjini Goswami  Ruth Yanai  Timothy Fahey  Matt Vadeboncoeur  Shoestringers  Fisk M. Ratliff T. Goswami, S and Yanai, R (2014). Synergistic soil response to nitrogen plus phosphorus. fertilization in hardwood forests. Biogeochemistry DOI 10.1007/s10533-013-9918-1  Rastetter, E. B., G. I. Ågren and G. R. Shaver. 1997. Responses of N-limited ecosystems to increased CO2: A balanced-nutrition, coupled-element- cycles model. Ecological Applications 7:444-460.  Vitousek, P. M., and R. W. Howarth. 1991. Nitrogen limitation on land and in the sea—How can it occur. Biogeochemistry 13:87–115.  Walker, T and Syers, J. 1976. The fate of phosphorus during pedogenesis. Geoderma 15(1): 1-19

Editor's Notes

  • #6 Wound response to the nail could affect diameter measurements Maybe Scott Bailey’s method
  • #7 Wound response to the nail could affect diameter measurements Maybe Scott Bailey’s method
  • #8 Wound response to the nail could affect diameter measurements Maybe Scott Bailey’s method
  • #11 Most consistently occuring species, C2 doesn’t have a calcium plot