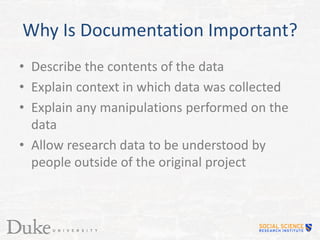
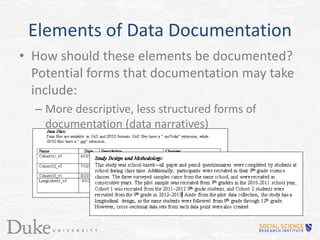
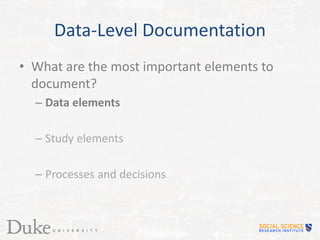
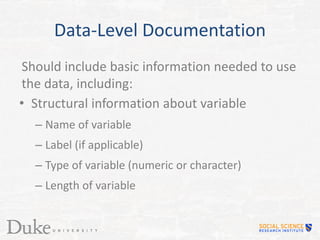
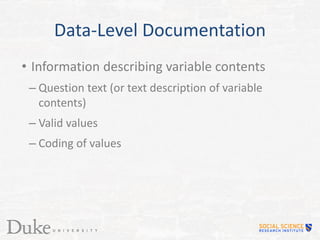
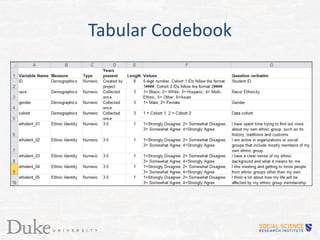
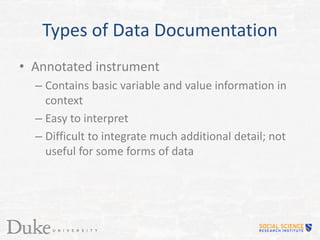
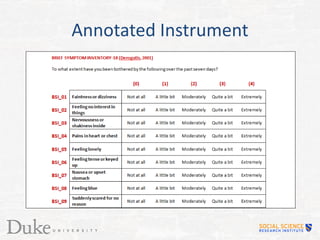
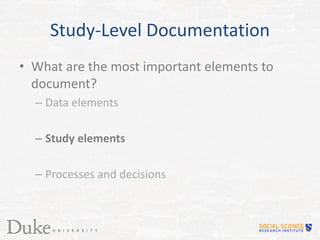
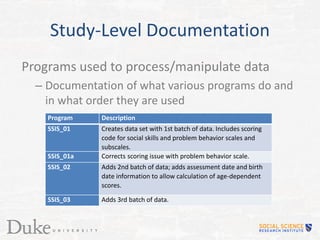
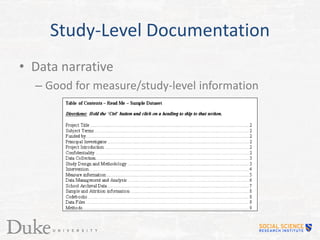
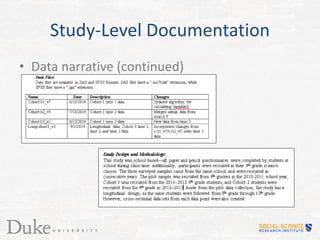
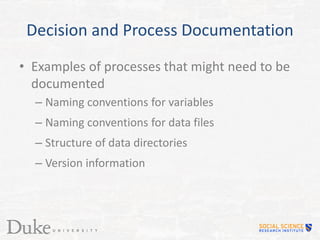
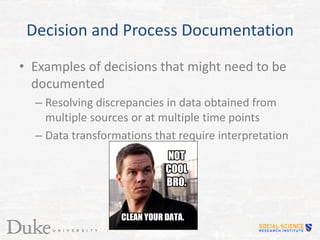
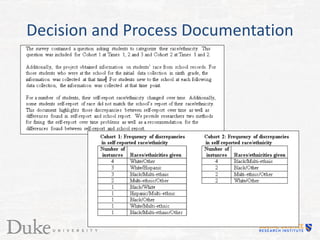
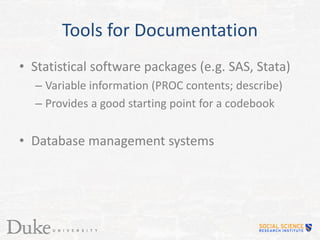
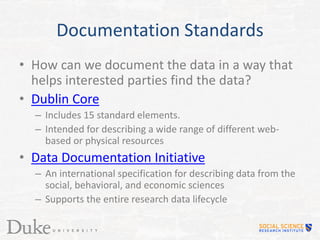
This document discusses the importance of properly documenting research data. It notes that documentation allows data to be understood by those outside the original project and prevents inaccurate assumptions from being made if the data manipulations or variable meanings are unclear. Insufficient documentation can make data unusable or misinterpreted. The document outlines key elements to document like data elements, study details, and decisions made. It provides examples of documentation tools like codebooks, annotated instruments, and data narratives. Thorough documentation ensures research data remains useful and understandable.
Definition
A procedure used to collect both qualitative and quantitative data.
This is done due to the fact that it is believed that both types of studies will provided a clearer understanding of what is being studied.
“It consists of merging ,integrating ,linking ,or embedding the two “strands””(Ceswell,2012).
Data plays an important role in any research or study conducted. It aids in bringing about a breakthrough in the respective field as well as for future researches. The collection of data is carried out in two forms viz: Qualitative Data and Quantitative Data which includes further bifurcation under it.
What is Qualitative Data?
Qualitative research can be defined as the method of research which focuses on gaining relevant information through observational, open-ended and communication method. They are more exploratory which concentrates on gaining insights about the situation and dig a bit deeper to find the underlying reason. The central idea behind using this method is to find the answer to Why and How rather than How many. Data gathered during a qualitative research is what is termed as qualitative data.
What is the purpose?
A qualitative data is non-numerical and more textual which comprises mostly of images, written texts, recorded audios and spoken words by people. Moreover, one can conduct qualitative research online as well as offline too. Apart from this, the varied purpose of qualitative research is as follows:
- To examine the purpose or reason for the situation
- Gain an understanding of the experience of people
- Understanding of relations and meaning
- Varied norms including social and political as well as contextual and cultural practice which impact the cause.
A presentation about the added value of combining qualitative and quantitative methods. It begins with a brief discussion of qualitative research and how it is distinct from yet shares basic principles with quantitative research, followed by a discussion of four important ways mixed methods -- integrating qualitative and quantitative -- adds value to our research efforts, and then a discussion of mixed methods research -- what it is, typologies, alternatives to typologies, and the use of diagrams.
DATA SCIENCE AND BIG DATA ANALYTICSCHAPTER 2 DATA ANA.docxrandyburney60861
DATA SCIENCE AND BIG DATA
ANALYTICS
CHAPTER 2:
DATA ANALYTICS LIFECYCLE
• Data science projects differ from BI projects
• More exploratory in nature
• Critical to have a project process
• Participants should be thorough and rigorous
• Break large projects into smaller pieces
• Spend time to plan and scope the work
• Documenting adds rigor and credibility
DATA ANALYTICS LIFECYCLE
• Data Analytics Lifecycle Overview
• Phase 1: Discovery
• Phase 2: Data Preparation
• Phase 3: Model Planning
• Phase 4: Model Building
• Phase 5: Communicate Results
• Phase 6: Operationalize
• Case Study: GINA
2.1 DATA ANALYTICS
LIFECYCLE OVERVIEW
• The data analytic lifecycle is designed for Big Data problems and
data science projects
• With six phases the project work can occur in several phases
simultaneously
• The cycle is iterative to portray a real project
• Work can return to earlier phases as new information is uncovered
2.1.1 KEY ROLES FOR A
SUCCESSFUL ANALYTICS
PROJECT
KEY ROLES FOR A
SUCCESSFUL ANALYTICS
PROJECT
• Business User – understands the domain area
• Project Sponsor – provides requirements
• Project Manager – ensures meeting objectives
• Business Intelligence Analyst – provides business domain
expertise based on deep understanding of the data
• Database Administrator (DBA) – creates DB environment
• Data Engineer – provides technical skills, assists data
management and extraction, supports analytic sandbox
• Data Scientist – provides analytic techniques and modeling
2.1.2 BACKGROUND AND OVERVIEW
OF DATA ANALYTICS LIFECYCLE
• Data Analytics Lifecycle defines the analytics process and
best practices from discovery to project completion
• The Lifecycle employs aspects of
• Scientific method
• Cross Industry Standard Process for Data Mining (CRISP-DM)
• Process model for data mining
• Davenport’s DELTA framework
• Hubbard’s Applied Information Economics (AIE) approach
• MAD Skills: New Analysis Practices for Big Data by Cohen et al.
https://en.wikipedia.org/wiki/Scientific_method
https://en.wikipedia.org/wiki/Cross_Industry_Standard_Process_for_Data_Mining
http://www.informationweek.com/software/information-management/analytics-at-work-qanda-with-tom-davenport/d/d-id/1085869?
https://en.wikipedia.org/wiki/Applied_information_economics
https://pafnuty.wordpress.com/2013/03/15/reading-log-mad-skills-new-analysis-practices-for-big-data-cohen/
OVERVIEW OF
DATA ANALYTICS LIFECYCLE
2.2 PHASE 1: DISCOVERY
1. Learning the Business Domain
2. Resources
3. Framing the Problem
4. Identifying Key Stakeholders
5. Interviewing the Analytics Sponsor
6. Developing Initial Hypotheses
7. Identifying Potential Data Sources
2.3 PHASE 2: DATA PREPARATION
2.3 PHASE 2: DATA
PREPARATION
• Includes steps to explore, preprocess, and condition
data
• Create robust environment – analytics sandbox
• Data preparation tends to be t.
Spring 2014 Data Management Lab: Session 2 Slides (more details at http://ulib.iupui.edu/digitalscholarship/dataservices/datamgmtlab)
What you will learn:
1. Build awareness of research data management issues associated with digital data.
2. Introduce methods to address common data management issues and facilitate data integrity.
3. Introduce institutional resources supporting effective data management methods.
4. Build proficiency in applying these methods.
5. Build strategic skills that enable attendees to solve new data management problems.
[AIIM17] Data Categorization You Can Live With - Monica Crocker AIIM International
Everyone has an opinion about how to categorize data: information security, records managers, compliance, privacy, business owners. In this session you will learn why information classification is important, how to build a classification scheme that supports all use cases, and how to maintain it over the life of the system. A particular focus will be on the potential benefits of using “big buckets” to make this effort more manageable.
Learn about the current state of Information Management in AIIM’s latest report: http://info.aiim.org/2017-state-of-information-management
Technical Documentation 101 for Data Engineers.pdfShristi Shrestha
Introduction to technical documentation for data engineers. This presentation contains details about metadata management software, documentation good practices, data documentation principles, data pipeline documentation practices and data pipeline documentation standards like CRISP-DM.
Who says you can't do records management in SharePoint?John F. Holliday
Although records management features have steadily improved with each new SharePoint version, many industry observers are starting to express their doubts as to whether SharePoint is a viable platform for building real-world ERM solutions. This session will explore the enhanced RM capabilities of SharePoint 2013 and show how to leverage them to full advantage. The session will also introduce several third-party tools that further enhance the platform to enable true enterprise-class content lifecycle management.
How to Make a Field invisible in Odoo 17Celine George
It is possible to hide or invisible some fields in odoo. Commonly using “invisible” attribute in the field definition to invisible the fields. This slide will show how to make a field invisible in odoo 17.
This is a presentation by Dada Robert in a Your Skill Boost masterclass organised by the Excellence Foundation for South Sudan (EFSS) on Saturday, the 25th and Sunday, the 26th of May 2024.
He discussed the concept of quality improvement, emphasizing its applicability to various aspects of life, including personal, project, and program improvements. He defined quality as doing the right thing at the right time in the right way to achieve the best possible results and discussed the concept of the "gap" between what we know and what we do, and how this gap represents the areas we need to improve. He explained the scientific approach to quality improvement, which involves systematic performance analysis, testing and learning, and implementing change ideas. He also highlighted the importance of client focus and a team approach to quality improvement.
We all have good and bad thoughts from time to time and situation to situation. We are bombarded daily with spiraling thoughts(both negative and positive) creating all-consuming feel , making us difficult to manage with associated suffering. Good thoughts are like our Mob Signal (Positive thought) amidst noise(negative thought) in the atmosphere. Negative thoughts like noise outweigh positive thoughts. These thoughts often create unwanted confusion, trouble, stress and frustration in our mind as well as chaos in our physical world. Negative thoughts are also known as “distorted thinking”.
How to Split Bills in the Odoo 17 POS ModuleCeline George
Bills have a main role in point of sale procedure. It will help to track sales, handling payments and giving receipts to customers. Bill splitting also has an important role in POS. For example, If some friends come together for dinner and if they want to divide the bill then it is possible by POS bill splitting. This slide will show how to split bills in odoo 17 POS.
Ethnobotany and Ethnopharmacology:
Ethnobotany in herbal drug evaluation,
Impact of Ethnobotany in traditional medicine,
New development in herbals,
Bio-prospecting tools for drug discovery,
Role of Ethnopharmacology in drug evaluation,
Reverse Pharmacology.
Read| The latest issue of The Challenger is here! We are thrilled to announce that our school paper has qualified for the NATIONAL SCHOOLS PRESS CONFERENCE (NSPC) 2024. Thank you for your unwavering support and trust. Dive into the stories that made us stand out!
The French Revolution, which began in 1789, was a period of radical social and political upheaval in France. It marked the decline of absolute monarchies, the rise of secular and democratic republics, and the eventual rise of Napoleon Bonaparte. This revolutionary period is crucial in understanding the transition from feudalism to modernity in Europe.
For more information, visit-www.vavaclasses.com
Synthetic Fiber Construction in lab .pptxPavel ( NSTU)
Synthetic fiber production is a fascinating and complex field that blends chemistry, engineering, and environmental science. By understanding these aspects, students can gain a comprehensive view of synthetic fiber production, its impact on society and the environment, and the potential for future innovations. Synthetic fibers play a crucial role in modern society, impacting various aspects of daily life, industry, and the environment. ynthetic fibers are integral to modern life, offering a range of benefits from cost-effectiveness and versatility to innovative applications and performance characteristics. While they pose environmental challenges, ongoing research and development aim to create more sustainable and eco-friendly alternatives. Understanding the importance of synthetic fibers helps in appreciating their role in the economy, industry, and daily life, while also emphasizing the need for sustainable practices and innovation.
Model Attribute Check Company Auto PropertyCeline George
In Odoo, the multi-company feature allows you to manage multiple companies within a single Odoo database instance. Each company can have its own configurations while still sharing common resources such as products, customers, and suppliers.
The Indian economy is classified into different sectors to simplify the analysis and understanding of economic activities. For Class 10, it's essential to grasp the sectors of the Indian economy, understand their characteristics, and recognize their importance. This guide will provide detailed notes on the Sectors of the Indian Economy Class 10, using specific long-tail keywords to enhance comprehension.
For more information, visit-www.vavaclasses.com
Sectors of the Indian Economy - Class 10 Study Notes pdf
Elements of Data Documentation
1. Elements of Data Documentation
Adam Mack
Education and Human Development Incubator (EHDi)
Social Science Research Institute
October 1, 2015
2. Why Is Documentation Important?
• Describe the contents of the data
• Explain context in which data was collected
• Explain any manipulations performed on the
data
• Allow research data to be understood by
people outside of the original project
3. Do I Need to Document?
Back in the day… … and now.
Research:
5. Consequences of Insufficient
Documentation
• Data may be unusable
• May make inaccurate assumptions about data
– Manipulations performed on data may affect
results of analyses
– May be unclear how to interpret contents of a
variable
6. Consequences of Insufficient Documentation:
Example
• Assume each of the following prompts is answered
on a 1–5 agreement scale.
– Data management is great. (dmgreat) 5
– Data management is the greatest! (dmgrtst) 5
– I don’t like data management. (dmnolike) 1
• Dmnolike needs to be reversed scored (to 5) before a
scale score can be calculated from the variables.
• You can recode this value within the same variable,
but should you?
7. Elements of Data Documentation
• What are the most important elements to
document?
8. Elements of Data Documentation
• What are the most important elements to
document?
– Data elements
– Study elements
– Processes and decisions
9. Elements of Data Documentation
• Who will be using the documentation?
– Data managers
– Statisticians
– Researchers
– Outside users
10. Elements of Data Documentation
• When should documentation be created?
– Often, projects wait until data has been collected
before creating documentation such as
codebooks.
– Creating documentation early in the project has
numerous advantages.
11. Elements of Data Documentation
• How should these elements be documented?
Potential forms that documentation may take
include:
– Codebook
12. Elements of Data Documentation
• How should these elements be documented?
Potential forms that documentation may take
include:
– Annotated version of instrument
13. Elements of Data Documentation
• How should these elements be documented?
Potential forms that documentation may take
include:
– More descriptive, less structured forms of
documentation (data narratives)
14. Data-Level Documentation
• What are the most important elements to
document?
– Data elements
– Study elements
– Processes and decisions
15. Data-Level Documentation
Should include basic information needed to use
the data, including:
• Structural information about variable
– Name of variable
– Label (if applicable)
– Type of variable (numeric or character)
– Length of variable
16. Data-Level Documentation
• Information describing variable contents
– Question text (or text description of variable
contents)
– Valid values
– Coding of values
18. Data-Level Documentation
• Question routing (if skip patterns used)
– Identify number of participants asked each
question/path through survey
• Error checking/validation
19. Data-Level Documentation
• Reliability of scales
– Calculate Cronbach’s alpha for each scale included
in the data
– Compare values for your study to previously
reported values in the literature
20. Types of Data Documentation
• Tabular codebook (Excel)
– Good for organizing a large amount of information
concisely
– Sortable
– Filterable
– Customizable; can hide columns that may be
needed but are not of interest to a general
audience
22. Types of Data Documentation
• Annotated instrument
– Contains basic variable and value information in
context
– Easy to interpret
– Difficult to integrate much additional detail; not
useful for some forms of data
24. Study-Level Documentation
• What are the most important elements to
document?
– Data elements
– Study elements
– Processes and decisions
25. Study-Level Documentation
• Details about the source of the data
– Study design and purpose
– Collection method
– Information about the research sample
– Longitudinal time points (if applicable)
26. Study-Level Documentation
• Information about data files
– File name/version
– Date created
– Number of records
– Number of variables
– Changes since last version of file
27. Study-Level Documentation
• Information about measures used
– Description of measure
– Description of scales
– Source of measure, including references as
appropriate
29. Study-Level Documentation
Programs used to process/manipulate data
– Documentation of what various programs do and
in what order they are used
Program Description
SSIS_01 Creates data set with 1st batch of data. Includes scoring
code for social skills and problem behavior scales and
subscales.
SSIS_01a Corrects scoring issue with problem behavior scale.
SSIS_02 Adds 2nd batch of data; adds assessment date and birth
date information to allow calculation of age-dependent
scores.
SSIS_03 Adds 3rd batch of data.
32. Decision and Process Documentation
• What are the most important elements to
document?
– Data elements
– Study elements
– Processes and decisions
33. Decision and Process Documentation
• By far, the least established area of research
documentation.
• Due to individual differences between
research projects, it can be difficult to identify
a standard template.
34. Decision and Process Documentation
Elements to include in documentation:
• Scope (variables/measures)
• Time (if multiple time points)
• Describe purpose of process or situation
requiring a decision being made
35. Decision and Process Documentation
Elements to include in documentation:
• Information from the data that describes or
affects the decision or process
• A description of the process itself, including:
– Any software or tools needed to complete the
process
– Any resources /references used
36. Decision and Process Documentation
• What sorts of decisions and processes should
be documented with this level of detail?
– Basic scales and processes that are commonly
utilized may not require this much detail
– Processes and procedures that are not well
established or that deviate significantly from the
standard method should be documented
37. Decision and Process Documentation
• Examples of processes that might need to be
documented
– Naming conventions for variables
– Naming conventions for data files
– Structure of data directories
– Version information
38. Decision and Process Documentation
• Examples of decisions that might need to be
documented
– Resolving discrepancies in data obtained from
multiple sources or at multiple time points
– Data transformations that require interpretation
40. Tools for Documentation
• Statistical software packages (e.g. SAS, Stata)
– Variable information (PROC contents; describe)
– Provides a good starting point for a codebook
• Database management systems
42. PROC CODEBOOK (SAS)
• PROC CODEBOOK is a SAS macro that creates
a codebook based on a SAS data set
43. PROC CODEBOOK (SAS)
• Requirements
– Labels on variables and data set
– Formats assigned to categorical values
– Minimum of 1 categorical/2 numeric variables
• Optional elements
– Ordering of variables (default is by variable name)
– ODS formatting of title text
44. PROC CODEBOOK (SAS)
• Can be useful when dealing with data sets that
include SAS formats
• If data set does not already have formats applied,
may take as much time to add them as to create
your own codebook (which has more flexibility)
• To download the SAS macro and access
documentation, visit
http://www.cpc.unc.edu/research/tools/data_an
alysis/proc_codebook
45. Documentation Standards
• How can we document the data in a way that
helps interested parties find the data?
• Dublin Core
– Includes 15 standard elements.
– Intended for describing a wide range of different web-
based or physical resources
• Data Documentation Initiative
– An international specification for describing data from the
social, behavioral, and economic sciences
– Supports the entire research data lifecycle
47. Resources
• Inter-university Consortium for Political and
Social Research (ICPSR)
– Guide to Social Science Data Preparation and
Archiving
• Cornell Research Data Management Service
Group
– Guide to writing "readme" style metadata
• Duke University Libraries
48. Questions?
• Ask away!
• If you would like to talk more about
documentation for your own projects, contact
us at ehdidata@duke.edu.
• Thanks for coming!
49. Acknowledgements
For their help in putting together this workshop:
• Lorrie Schmid
• Chandler Thomas
And for helping keep you interested in the material:
• Darth Vader
• Success Kid
• Mark Wahlberg (and @ResearchMark)