Download to read offline
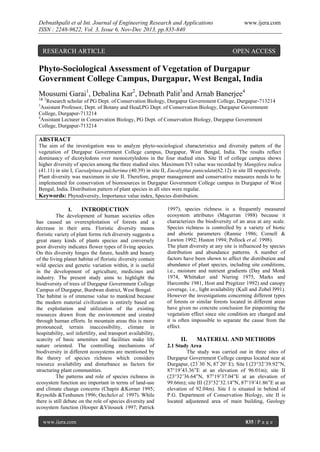
![Debnathpalit et al Int. Journal of Engineering Research and Applications
ISSN : 2248-9622, Vol. 3, Issue 6, Nov-Dec 2013, pp.835-840
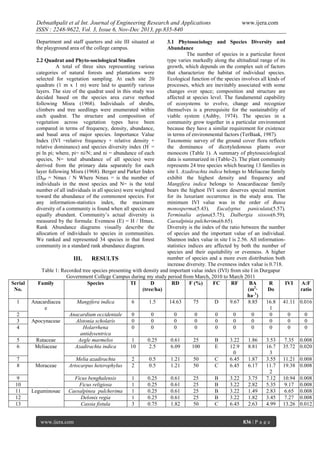
In order to assess ecological knowledge of
the native flora in Durgapur College campus in
general, a quantitative phytosociological study in
different was carried out. Importance Value Index
(I.V.I.) for each plant species was determined to
quantify the importance of each species. The
vegetation of the studied sites is composed of
evergreen vegetation. The disturbance is mainly due to
the extensive cutting of tress for fuel and for fodder,
overgrazing, removal of economically important trees
and some other biotic interference. These activities are
responsible in converting natural vegetation to semi
natural vegetation. An important component of any
ecosystem is the species it contains. Species also
serves as good indicators of the ecological condition
of a system (Morgenthal, et al., 2001). A list of all
species collected during the study was compiled. The
floristic composition of different area was also
compared. The species composition of the three
studied sites was considerably different. Vegetation
analysis gives the information necessary to determine
the name of the community and provide data that can
be used to compare it with other communities. Four to
five plant communities: Azadirachta indica,
Polyalthia longifolia, Eucalyptus paniculata were
observed as a leading dominant. The communities
with strong single species dominance have been
attributed to grazing, species competition, seed
predation, disease, stability and niche diversification
(Whittaker and Levin 1977, Harper 1977). The rarer
plant species with poor representation in our samples
need proper attention from plant biologists to
determine their conservation status and key functions.
Butea
monosperma,
Eucalyptus
paniculata,
Terminalia arjuna, Dalbergia sissoo, Caesalpinia
pulcherima in site I; Butea monosperma, Azadirchta
indica, Aurocaria sp., Anacardium occidentale in site
II and Tamarindus indica, Tectona grandis,
Terminalia arjuna in site III. The communities in the
study area were heterogeneous. The absence of certain
frequencies classes in the communities reflected the
heterogeneity of the vegetation, which is either due to
biotic disturbance or the floral poverty. The result
obtained by Raunkiaer (1934) may be regarded only
as possibilities to be confirmed by other alternative
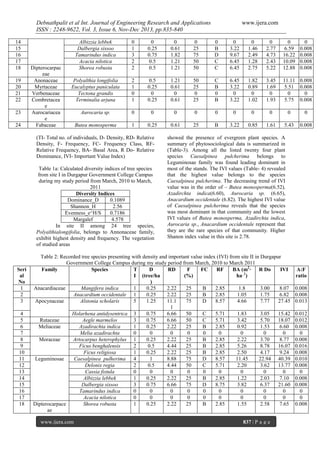
approaches. The ratio of abundance to frequency for
different species was calculated to elicit the
distributional patterns. This ratio indicates regular
(<0.025), random (0.025-0.05) and contagious (>0.05)
distributions (Curtis and Cottam 1956). In our present
investigation all of the studied plant species were
regular in distribution. The concept of species
diversity relates simply to “richness” of a community
or geographical area in species. At the simplest level
of examination, species diversity corresponds to the
number of species present. Species diversity is
considered to be an important attribute of community
organization and allowed comparison of the structural
characteristics of the communities. It is often related
to community dynamics stability, productivity,
www.ijera.com
www.ijera.com
integration, evolution, structure and competition. The
idea of displacement of one species through
competition with other is net prime importance.
Protection of the natural flora from overgrazing is
necessary, especially during the time when the
desirable plants set their seeds. Protection is essential
to maintain the desirable forage plant species in a
good proportion, to avoid invader plant species and to
rehabilitate the destroyed natural flora (Arshad, et al.,
2002). We must carry out our efforts to make a list of
the plant species, which can be lost from the natural
environment, otherwise it will leads to desertification.
Desertification associated with human activities has
been recognized over the past two decades as one of
the important facets of ongoing global environmental
change (Verstraete and Schwartz, 1991; UNEP,1997;
Huenneke, et al., 2002) and Species loss can alter the
goods and services provided by ecosystems (Hooper,
et al., 2005).
The variable rate of frequency class distribution at
three studied sites of Durgapur Government College
campus may be explained by a common biological
explanation pattern which implies most dominant
species appeared to colonize a new area appropriates a
fraction of the available resources and by competitive
interaction, pre-empts that fraction. The second
species then preempts a similar fraction of the
remaining resource and so on with further colonists.
The reconstruction of plant communities on disturbed
sites with a species composition similar to that of the
natural area will require allocation of more financial
inputs. The saving and establishment of plant
communities one of the major tasks facing by
ecologist. Extensive work on the development of
vegetation depends upon good indigenous vegetation
recovery. Preservation of these communities
especially within disturbed sites is more generally,
demands a unique and pressing conservation
challenge. Extensive cutting of tress for fuel and for
fodder, overgrazing, removal of economically
important trees and some other biotic interference
affecting the nature, structure and composition of
plant communities. Since species diversity is
important to maintain heterogeneity of a stable
ecosystem, the diversity is to be preserved through
appropriate measures. Since this forest is likely to
have generous impact on socio-economic conditions
of local stakeholders, its ecorestoration and protection
is of utmost importance.
REFERENCES
[1]
[2]
[3]
Arshad, M, Salahuddin&Rao, A (2002).
Phytosociological Assessment of natural
reserve of national park Lalsuhanra (Punjab,
Pakistan). Asian Journal of Plant Sciences 1
(2): 174 - 175.
Ashby, W.R. (1974). Einfuhrung in die
kybernetik. Frankfurt/ M. 416.
Chapin III, F.S. &Korner, C. (1995).
Patterns, causes, changes and consequences
839 | P a g e](https://image.slidesharecdn.com/ek36835840-131127003613-phpapp01/85/Ek36835840-5-320.jpg)
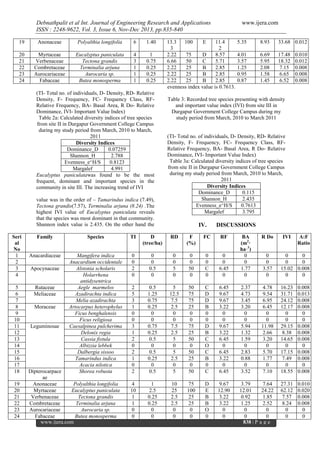
![Debnathpalit et al Int. Journal of Engineering Research and Applications
ISSN : 2248-9622, Vol. 3, Issue 6, Nov-Dec 2013, pp.835-840
[4]
[5]
[6]
[7]
[8]
[9]
[10]
[11]
[12]
[13]
[14]
[15]
[16]
[17]
[18]
of biodiversity in arctic and alpine
ecosystems. In Chapin III, F.S. &Kmrner, C.
(Eds.), Arctic and alpine biodiversity:
Patterns, causes and ecosystem consequences
(pp. 313-320). Springer, Berlin.
Cornell, H.V. & Lawton, J.H. (1992). Species
interactions, local and regional processes, and
limits to the richness of ecological
communities: a theoretical perspective. J.
Anim. Ecol., 61, 1-12.
Curtis, J.T. &Cottam, G. (1956). Plant
Ecology Workbook Laboratory Field
Reference Manual. Burgess Publishing Co.
Minnesota 193.
Day, F.P. Jr. & Monk, C.D. (1974).
Vegetation patterns on a southern
Appalachian watershed. Ecology, 55, 10641074.
Harper, J.L. (1977). Population Biology of
Plants. Academic Press, New York.
Hooper, D.U. &Vitousek, P.M. (1997).The
effects of plant composition and diversity on
ecosystem processes. Science, 277, 13021305.
Hooper, et.al. (2005). Effects of biodiversity
on ecosystem functioning: a consensus of
current knowledge, Ecol. Monogr, 75, 3-35.
Host, G. E. &Pregitzer, K. S. (1992).
Geomorphic influences on ground-flora and
over story composition in upland for- Plant
diversity in boreal forest of north-western
Lower Michigan. Canadian Journal of
Forest Research, 22, 1547-1555.
Huenneke, et.al. (2002). Desertification alters
patterns of aboveground net primary
production in Chihuahua ecosystems.
Biology, 8, 247–264.
Huston, M.A. (1994). Biological diversity.
Cambridge University Press, Cambridge.
Kull, K. &Zobel, M. (1991). High species
richness in an Estonian wooded meadow.
Journal of Vegetation Science, 2, 711-714.
Magurran, A.E. (1988). Ecological diversity
and its measurement. Princeton University
Press, Princeton.
Marks, P. L. &Harcombe, P. A. (1981).Forest
vegetation of the Big Thicket, southeast
Texas. Ecological Mono-graphs, 51, 287305.
Misra, R. (1968). Ecology WorkBook.
Oxford and IBH Publishing Company,
Calcutta.
Morgenthal, et.al. (2001). the vegetation of
ash disposal sites at Hendrina Power Station
II: Floristic composition South African
Journal of Botany, 67(4), 520 - 532.
Oechel, et.al. (eds.) (1997). Global change
and arctic terrestrial ecosystems. Springer,
Berlin.
www.ijera.com
[19]
[20]
[21]
[22]
[23]
[24]
[25]
[26]
[27]
[28]
www.ijera.com
Patrick, R. (1997). Biodiversity: Why is it
important? In ReakaKudla, M.L., Wilson,
D.E. & Wilson, E.O. (Eds.), Biodiversity II
(pp.
15-24).
Joseph
Henry
Press,
Washington, DC.
Pollock, M.M., Naiman, R.J. & Hanley, T.A.
(1998).Plant species richness in riparian
wetlands - a test of biodiversity theory.
Ecology, 79, 94-105.
Rannie, W.F. (1986). Summer air
temperature and number of vascular species
in arctic Canada .Arctic, 39, 133-137.
Raunkiaer, C. (1934). The life forms of
plants and statistical. Plant Geography, Being
the collected papers of C. Raunkiaer.
(pp.632) Oxford, Clarendon Press.
Reynolds, H.L. &Tenhunen, J.D. (Eds.)
(1996).Landscape function and disturbance in
Arctic tundra. Springer,
TerBaak, C.J.F. (1987).The analysis of
vegetation environmental relationship by
canonical
correspondence
analysis.
Vegetatio, 69, 69-77.
United Nations Environment Program
(UNEP).
(1997).
World
Atlas
of
Desertification. 2nd ed. Edward Arnold,
London, and Wiley, New York, USA.
Verstraete, M.M.
& Schwartz, S.A.
(1991).Desertification and global change,
Vegetatio, 91, 3-13.
Whittaker, R. H., &Niering, W. A. (1975).
Vegetation of the Santa Catalina mountains,
Arizona.
Whittaker, R.H. & Levin, S.A. (1977). The
role of mosaic phenomena in mosaic
communities.
Theoretical
Population
Biology, 12,117-139.
840 | P a g e](https://image.slidesharecdn.com/ek36835840-131127003613-phpapp01/85/Ek36835840-6-320.jpg)

This research article assesses the phyto-sociological characteristics and diversity of vegetation at Durgapur Government College campus in West Bengal, India. The findings show a predominance of dicotyledons over monocotyledons, with Site II exhibiting the highest species diversity, particularly highlighting the significance of Mangifera indica and Caesalpinia pulcherima. The study emphasizes the need for proper management and conservation measures to protect the biodiversity within the campus.


