Abstract A large number of structures that are being constructed at present tend to be wind-sensitive because of their slenderness, shapes, size, lightness and flexibility. With the ever increase in the vertical growth of urban cities, high rise buildings are being constructed in large numbers. In this study, analytical investigation of different shapes of buildings are taken as an example and various analytical approaches are performed on the building. These plans are modeled and wind loads are found out according to I.S 875(part 3)-1987 by taking gust factor and without taking gust factor. These models are compared in different aspects such as storey drift, storey displacement, storey shear, etc. for different shapes of buildings by using finite element software package ETAB’s 13.1.1v. Among these results, which shape of building provide sound wind loading to the structure as well as the structural efficiency would be selected. Key Words: Storey displacement, Storey drift, Storey shear, Gust, Wind load
Halogenation process of chemical process industries
Effects of shape on the wind instigate response of high rise buildings
1. IJRET: International Journal of Research in Engineering and Technology eISSN: 2319-1163 | pISSN: 2321-7308
_______________________________________________________________________________________
Volume: 04 Issue: 09 | September-2015, Available @ http://www.ijret.org 65
EFFECTS OF SHAPE ON THE WIND-INSTIGATE RESPONSE OF
HIGH RISE BUILDINGS
M. R. Wakchaure1
, Sayali Gawali2
1
Professor, Civil Engineering Department, Amrutvahini College of Engineering Sangamner, Maharashtra, India
2
Post Graduate Student, Civil Engineering Department, Amrutvahini College of Engineering Sangamner,
Maharashtra, India
Abstract
A large number of structures that are being constructed at present tend to be wind-sensitive because of their slenderness, shapes,
size, lightness and flexibility. With the ever increase in the vertical growth of urban cities, high rise buildings are being
constructed in large numbers. In this study, analytical investigation of different shapes of buildings are taken as an example and
various analytical approaches are performed on the building. These plans are modeled and wind loads are found out according to
I.S 875(part 3)-1987 by taking gust factor and without taking gust factor. These models are compared in different aspects such as
storey drift, storey displacement, storey shear, etc. for different shapes of buildings by using finite element software package
ETAB’s 13.1.1v. Among these results, which shape of building provide sound wind loading to the structure as well as the
structural efficiency would be selected.
Key Words: Storey displacement, Storey drift, Storey shear, Gust, Wind load
--------------------------------------------------------------------***----------------------------------------------------------------------
1. INTRODUCTION
A building having height more than 15 m as per National
building code 2005 of India is called high rise building. Due
to rapid growth of population, expensive land prices, to
improve aesthetic view of city and restriction in horizontal
development due to less space, vertical growth is the
ultimate option available. Wind is the large scale horizontal
movement of free air. It plays an important role in design of
tall structures because it exerts loads on buildings. The
response of structures to wind depends on the characteristics
of wind. As the height of building increases, there is more
danger against high velocity of wind force at high level.
1.1 Wind Effects on Structures
Wind is randomly varying dynamic phenomenon. Wind
loading is complex live load that varies both in time and
space. Wind effects on structures can be classified as static
and dynamic. Static wind effects causes elastic bending and
twisting of structure. Wind gusts are the major dynamic
effects on the on the structures which induce large dynamic
motions, including oscillations. Hence, dynamic analysis is
essential for tall structures.
It is important to evaluate the characteristics of fluctuating
wind forces and the dynamic characteristics of the building.
The wind induced building response of tall buildings can be
reduced by means of aerodynamic based design and
modifications that change the flow pattern around the
building or break up the wind affecting the building face.
The use of aerodynamic building forms is an effective
method of reducing the wind loads on buildings.
2. METHODOLOGY
In this study, the gust response factors and the equivalent
static wind loads for various along wind response
components at different shape of building as per I.S
875(part3)-1987 are calculated and analysed with the help of
ETAB’s 13.1.1v.
Table -1: Parameters considered for the study
No. of Storey 50
Bottom storey height 3m
Storey height 3m
Soil type Medium
Wind zone I
Shape of buildings Rectangular, square,
circular and elliptical
Thickness of slab 0.125m
Beam size 0.3m x 0.6 m
Column size 1m x 1m
Material Properties
Grade of concrete M40
Grade of steel Fe500
Dead load intensities
FF on floors 1.75 kN/m²
FF on roof 2 kN/m²
Live load intensities
LL on floors 2 kN/m²
LL on roof 1 kN/m2
2. IJRET: International Journal of Research in Engineering and Technology eISSN: 2319-1163 | pISSN: 2321-7308
_______________________________________________________________________________________
Volume: 04 Issue: 09 | September-2015, Available @ http://www.ijret.org 66
2.1 Building Models
Fig-1: Plan and 3-D view of square building
Fig-2: Plan and 3-D view of rectangular building
Fig-3: Plan and 3-D view of circular building
Fig-4: Plan and 3-D view of elliptical building
Table -2: Model Plan dimensions
Name of
parameter
Square
shape
Rectangul
ar shape
Circular
shape
Elliptical
shape
Plan dimension in
x-direction
50 m 70 m 28.20 m 38 m
Plan dimension in
y-direction
50 m 35.714 m 28.20 m 20.95 m
2.2 Linear Analysis
2.1.1 Pressure coefficients
Pressure coefficients are applicable to structural elements
like walls and roofs as well as to the design of cladding. The
calculation process implies the algebraic addition of Cpe and
Cpi obtain the final wind loading. External pressure
coefficient depends on wind direction, structure
configuration in plan, its height versus width ratio and,
characteristics of roof and its shape. Internal pressure
coefficients are largely dependent on the percentage of
openings in the walls and their location with reference to
wind direction.
2.1.2 Force coefficients
The value of force coefficients apply to a building or
structure as a whole, and when multiplied by the effective
frontal area A, of the building or structure and by design
wind pressure, pd gives the total wind load on that particular
building or structure.
2.1.3 Parameters considered for linear analysis
Design wind speed: The basic wind speed (Vz) for any site
shall be obtained from Fig.1 IS: (875(Part 3)-1987) and shall
be modified to include the following effects to get design
wind velocity at any height (Vz) for the chosen structure:
a) Risk level
b) Terrain roughness, height and size of structure; and
c) Local topography
Vz = Vb.k1.k2.k3
Vz= hourly mean wind speed in m/s, at height z
Vb = regional basic wind speed in m/s
k1 = probability factor (risk coefficient) (Clause 5.3.1 of IS:
875(Part 3)-1987)
k2 = Terrain and height factor (Clause 5.3.2 of IS: 875(Part
3)-1987)
k3 = topography factor (Clause 5.3.3 of IS: 875(Part 3)-
1987)
Design Wind Pressure: The design wind pressure at any
height above mean level shall be obtained by the Following
relationship between wind pressure and wind velocity:
Pz=0.6 Vz
2
Where, Pz= Design wind pressure in N/m2 at height 'z' m
Vz = design wind velocity in m/s at height „z‟ m
Wind Load on Individual Members: (IS: 875 (Part 3)
F = (Cpe – Cpi) APZ
Where, Cpe = external pressure coefficient,
Cpi = internal pressure- coefficient,
A = surface area of structural or cladding unit and
Pz = design wind pressure.
Table -3: Parameters considered for linear analysis
Name of
parameter
Square
shape
Rectangular
shape
Circular
shape
Elliptical
shape
(k1) 1 1 1 1
(k3) 1 1 1 1
Terrain category II II II II
Class of structure B C C C
3. IJRET: International Journal of Research in Engineering and Technology eISSN: 2319-1163 | pISSN: 2321-7308
_______________________________________________________________________________________
Volume: 04 Issue: 09 | September-2015, Available @ http://www.ijret.org 67
Table -4: Linear Wind loads (KN)
Floo
r no.
Squar
e
Rectangular
Circular EllipticalX Y
1 131.78 166.15 84.77 105.17 32.78
5 142.76 180.75 92.22 114.41 35.66
10 166.03 207.77 106.01 131.52 41.00
15 177.54 226.14 115.38 143.15 44.62
20 185.91 238.39 121.63 150.91 47.04
25 192.68 247.47 126.26 156.65 48.83
30 199.57 256.71 130.97 162.50 50.65
35 205.23 263.41 134.40 166.74 51.98
40 208.27 269.98 137.74 170.90 53.27
45 211.32 275.70 140.66 174.52 54.40
50 214.40 281.25 143.50 178.04 55.50
Chart -1: Wind intensity in X-direction
Chart -2: Wind intensity in Y-direction
From linear analysis, it was seen from table-4 that with the
increase in the height of building the wind intensities were
also increasing and wind intensities were decreasing with
the variation of shapes from square to elliptical. The
variation of wind intensity is shown in chart 1 and chart 2.
2.2 Gust Factor Method
A gust factor, defined as the ratio between a peak wind gust
and mean wind speed over a period of time, can be used
along with other statistics to examine the structure of the
wind.
Constants and parameters used for gust factor analysis are:
i. T = Time period (pg.48, IS 875(part-3)-1987)
ii. Cf = Force coefficient for clad building (fig. 4 of IS
875(part-3)-1987)
iii. gf = Peak Factor and Roughness Factor (fig. 8 of IS
875(part-3)-1987)
iv. B = Background factor (fig. 9 of IS 875(part-3)-
1987)
v. S = Size reduction factor (fig. 10 of IS 875(part-3)-
1987)
vi. Ø = Constant
vii. E = Gust energy factor (fig. 11 of IS 875(part-3)-
1987)
viii. β = (pg.52, IS 875(part-3)-1987)
ix. G = Gust factor
x. Fx = Along wind load on the structure on a strip
area at any height
Table -5: Parameters considered for gust factor analysis
Name of
parameter
Square
model
Rectangular
model
Circular
model
Elliptical
model
Tx 1.9 1.61 2.54 2.18
Ty 1.9 2.25 2.54 2.94
Cf 1.25 1.1 0.7 0.2
gf 0.85 0.85 0.85 0.85
B 0.85 0.85 0.85 0.85
Ø 0 0 0 0
β 0.016 0.016 0.016 0.016
Table -6: Wind loads with gust factor (KN)
Floor
no.
Square Rectangular Circular Elliptical
X Y X Y
1 96.46 116.57 67.26 94.77 30.17 29.22
5 111.76 134.82 78.52 109.81 35.17 33.85
10 136.45 162.67 95.85 132.90 42.91 40.80
15 153.23 181.94 107.96 149.22 48.41 45.84
20 165.27 194.96 116.17 160.49 52.06 49.17
25 175.29 204.68 122.30 168.74 54.74 51.67
30 183.98 214.61 128.60 177.10 57.98 54.23
35 191.70 223.33 134.15 184.53 60.85 56.44
40 197.03 229.23 137.91 189.55 62.69 57.96
45 203.04 235.21 141.72 194.60 64.47 59.52
50 209.79 241.27 145.57 200.41 66.31 61.10
Chart -3: Wind intensity in X-direction
4. IJRET: International Journal of Research in Engineering and Technology eISSN: 2319-1163 | pISSN: 2321-7308
_______________________________________________________________________________________
Volume: 04 Issue: 09 | September-2015, Available @ http://www.ijret.org 68
3. RESULTS AND DISCUSSION
In this section, behavior of different buildings when
subjected to wind load have been discussed.
Chart -4: Wind intensity in Y-direction
3.1 Wind Intensity
It is the pressure exerted by the wind on the structure. The
wind intensity for square, rectangular, circular and elliptical
shape building are compared in table 7 and it is graphically
represented in chart 5, 6, 7 and 8.
Table -7: Comparison of wind loads without gust factor (X-direction) (kN)
Table -8: Comparison of wind loads without gust factor (Y-direction) (kN)
Storey
No.
Height
m
Square Rectangular Circular Elliptical
Wind
intensity
Wind
intensity %
Decrease
Wind
intensity %
Decrease
Wind
intensity %
Decrease
(kN) (kN) (kN) (kN)
0 0 131.780 84.769 35.674 105.172 20.191 32.784 75.123
10 30 166.029 106.008 36.151 131.523 20.783 40.997 75.307
20 60 185.911 121.630 34.576 150.906 18.829 47.039 74.698
30 90 199.569 130.974 34.371 162.499 18.575 50.653 74.619
40 120 208.267 137.744 33.862 170.899 17.942 53.271 74.422
50 150 214.397 143.496 33.070 178.036 16.960 55.496 74.115
Table -9: Comparison of wind loads with gust factor (X-direction) (kN)
Storey
No.
Height
m
Square Rectangular Circular Elliptical
Wind
intensity
Wind
intensity %
Decrease
Wind
intensity %
Decrease
Wind
intensity %
Decrease
(kN) (kN) (kN) (kN)
0 0 96.457 116.566 -20.847 94.773 1.746 30.172 68.719
10 30 136.446 162.674 -19.223 132.902 2.597 42.915 68.548
20 60 165.272 194.964 -17.965 160.494 2.891 52.061 68.500
30 90 183.979 214.612 -16.651 177.101 3.738 57.981 68.485
40 120 197.028 229.230 -16.344 189.554 3.793 62.695 68.180
50 150 209.786 241.265 -15.006 200.406 4.471 66.310 68.392
Storey
No.
Height
m
Square Rectangular Circular Elliptical
Wind
intensity
Wind
intensity %
Decrease
Wind
intensity %
Decrease
Wind
intensity %
Decrease
(kN) (kN) (kN) (kN)
0 0 131.780 166.147 -26.079 105.172 20.191 32.784 75.123
10 30 166.029 207.775 -25.144 131.523 20.783 40.997 75.307
20 60 185.911 238.395 -28.231 150.906 18.829 47.039 74.698
30 90 199.569 256.710 -28.632 162.499 18.575 50.653 74.619
40 120 208.267 269.979 -29.631 170.899 17.942 53.271 74.422
50 150 214.397 281.253 -31.183 178.036 16.960 55.496 74.115
5. IJRET: International Journal of Research in Engineering and Technology eISSN: 2319-1163 | pISSN: 2321-7308
_______________________________________________________________________________________
Volume: 04 Issue: 09 | September-2015, Available @ http://www.ijret.org 69
Table -10: Comparison of wind loads with gust factor (Y-direction) (kN)
Storey
No.
Height
m
Square Rectangular Circular Elliptical
Wind
intensity
Wind
intensity %
Decrease
Wind
intensity %
Decrease
Wind
intensity %
Decrease
(kN) (kN) (kN) (kN)
0 0 96.457 67.265 30.265 94.773 1.746 29.222 69.704
10 30 136.446 95.846 29.755 132.902 2.597 40.803 70.096
20 60 165.272 116.165 29.713 160.494 2.891 49.174 70.247
30 90 183.979 128.604 30.099 177.101 3.738 54.235 70.521
40 120 197.028 137.912 30.004 189.554 3.793 57.959 70.583
50 150 209.786 145.574 30.608 200.406 4.471 61.101 70.875
Chart -5: Wind intensity in X-direction (without gust)
Chart -6: Wind intensity in Y-direction (without gust)
Chart -7: Wind intensity in X-direction (with gust)
Chart -8: Wind intensity in Y-direction (with gust)
3.2 Storey Displacement
It is displacement caused by the lateral force on the each
storey level of structure. The storey displacement for square,
rectangular, circular and elliptical shape building are
compared in table 11 and it is graphically represented in
chart 9, 10, 11 and 12.
Table -11: Comparison of storey displacement without gust factor (X-direction) (mm)
Storey
No.
Height
m
Square Rectangular Circular Elliptical
Storey
displacement
Storey
displacement %
Decrease
Storey
displacement %
Decrease
Storey
displacement %
Decrease
(mm) (mm) (mm) (mm)
0 0 0.8 0.5 37.500 0.7 12.500 0.2 75.000
10 30 27.6 17.7 35.870 24 13.043 6.5 76.449
20 60 52.7 33.7 36.053 46.1 12.524 12.4 76.471
30 90 72.5 46 36.552 63.7 12.138 17 76.552
40 120 85.9 54.2 36.903 75.7 11.874 20.1 76.601
50 150 92.9 58.3 37.244 82 11.733 21.6 76.749
10. IJRET: International Journal of Research in Engineering and Technology eISSN: 2319-1163 | pISSN: 2321-7308
_______________________________________________________________________________________
Volume: 04 Issue: 09 | September-2015, Available @ http://www.ijret.org 74
4. CONCLUSION
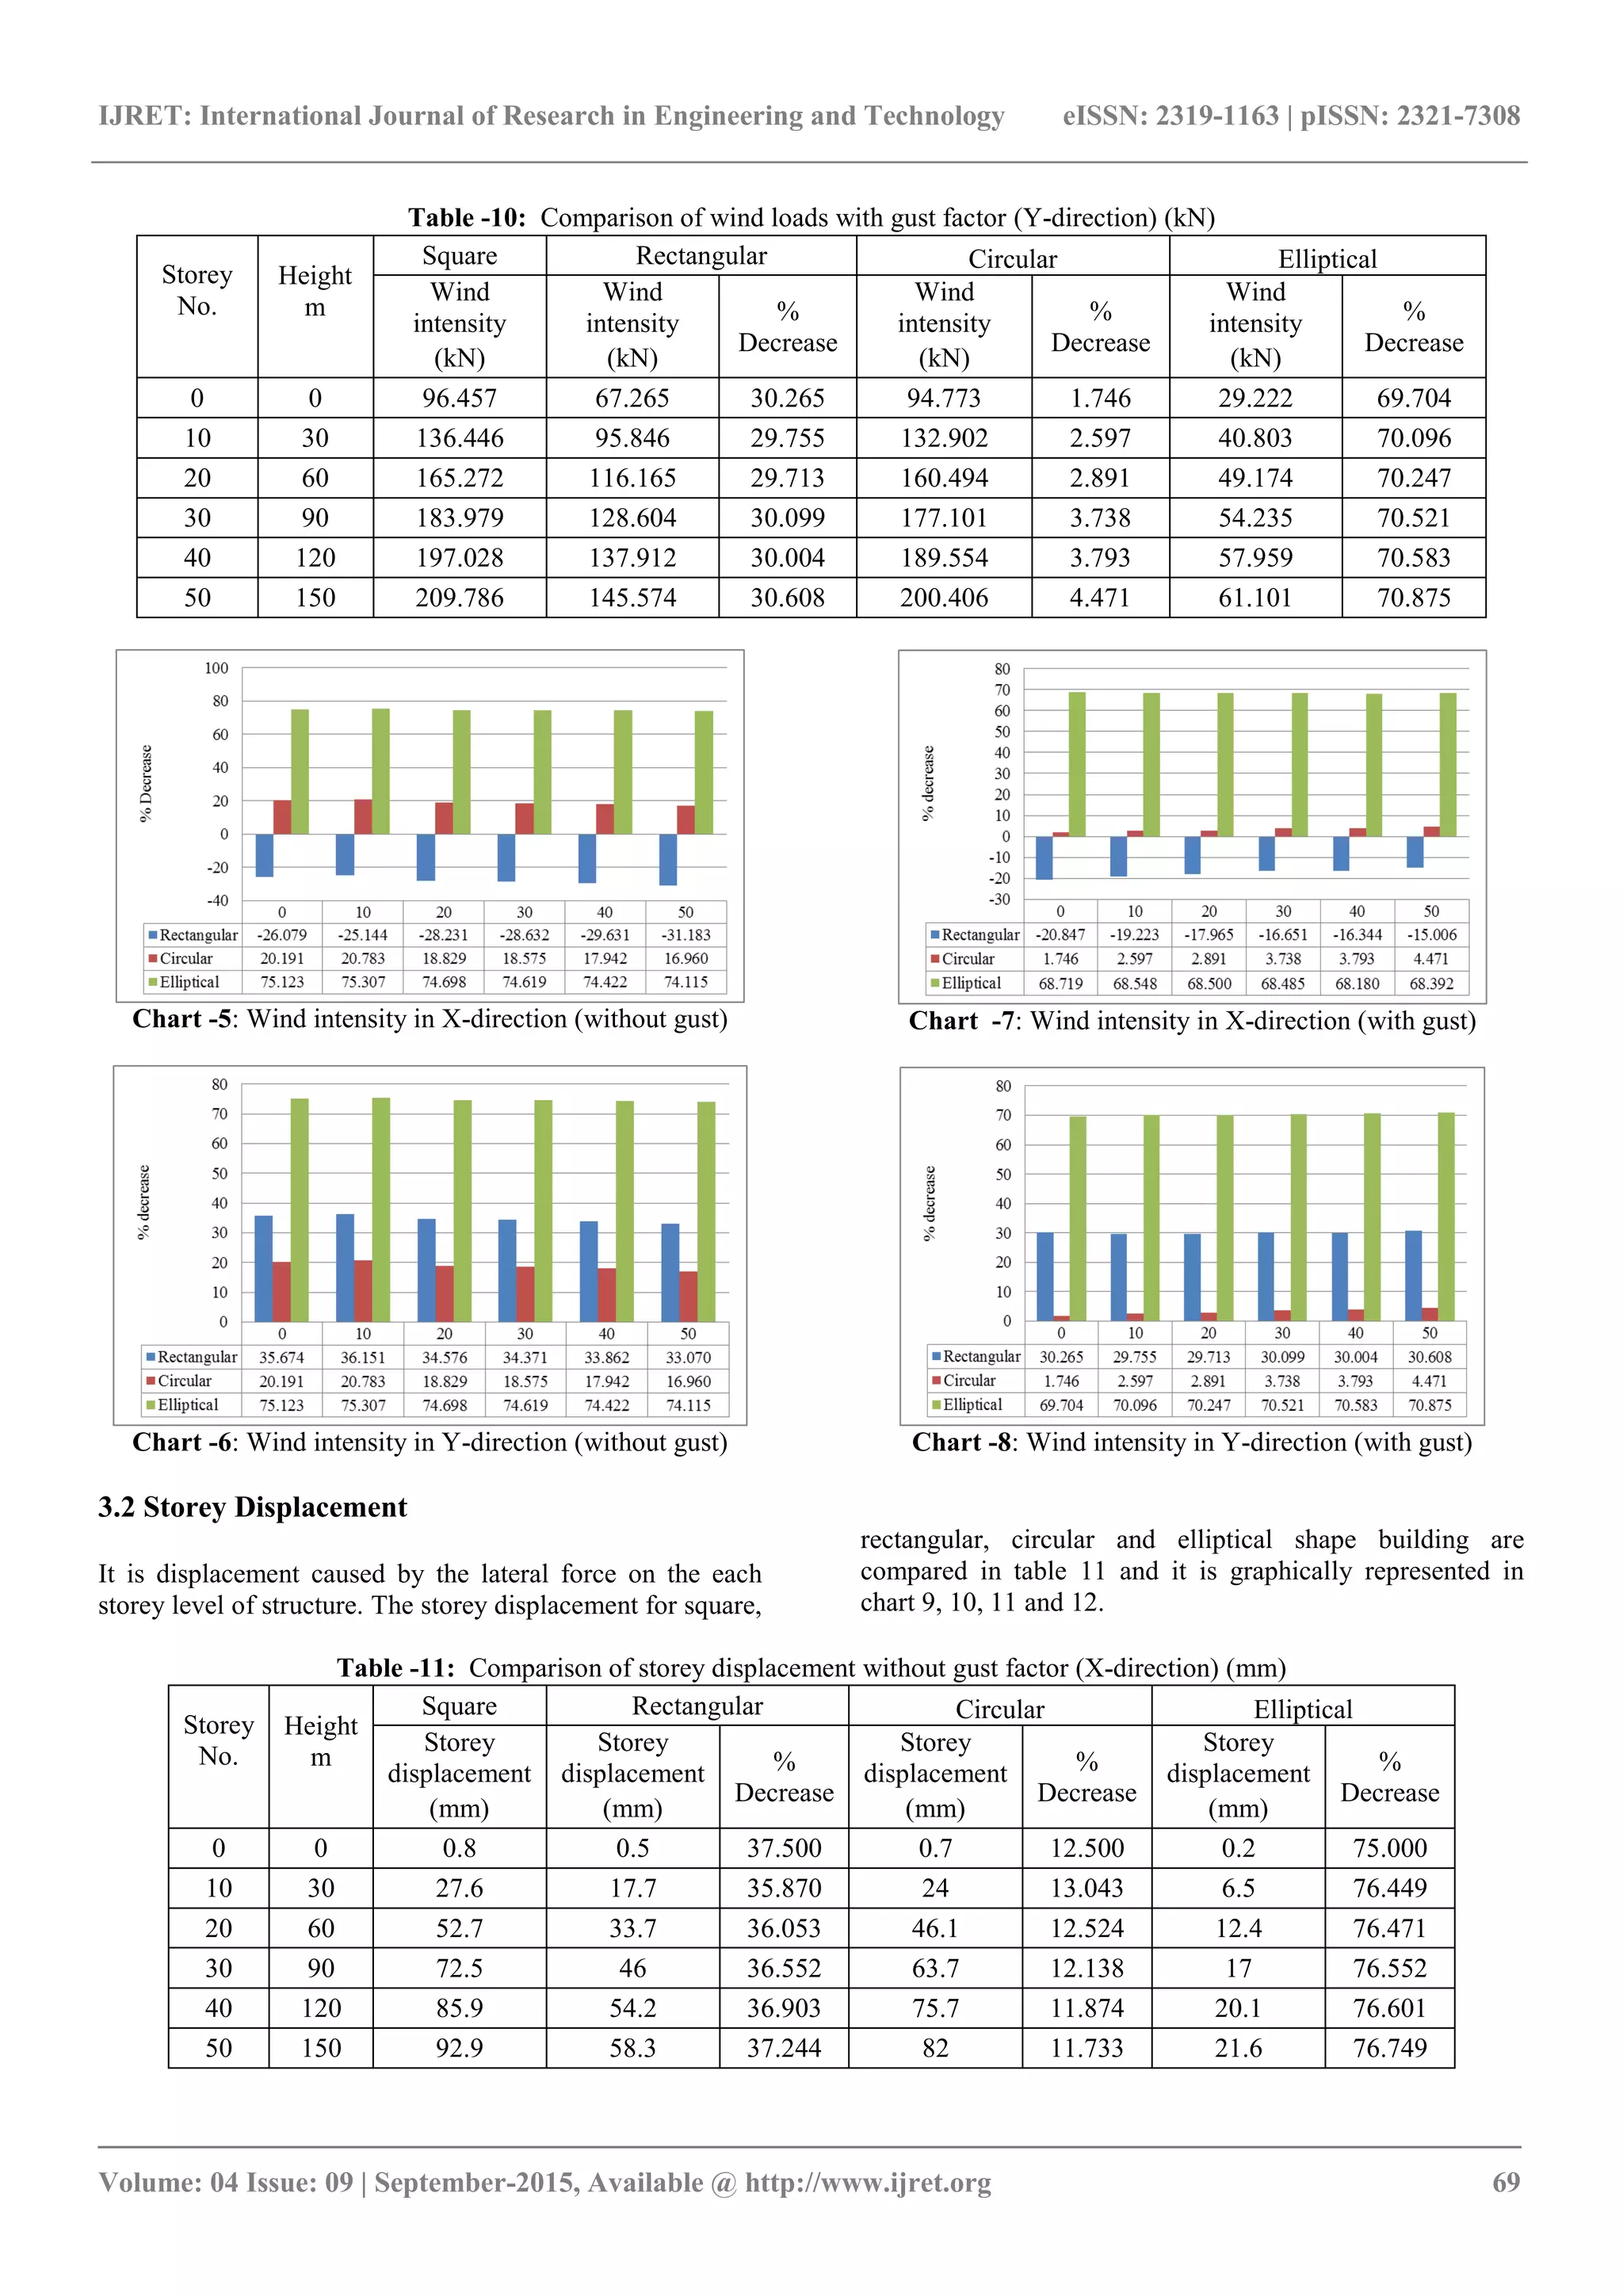
1. The percentage reduction in peak wind intensity for
circular building is 16.96 %, 74.115 % for elliptical
building and it is more by 31.183 % for rectangular
building when compared with square building without
gust factor. The percentage reduction in peak wind
intensity for circular building is 4.471 %, 68.392 % for
elliptical building and it is more by 15 % for
rectangular building when compared with square
building with gust factor.
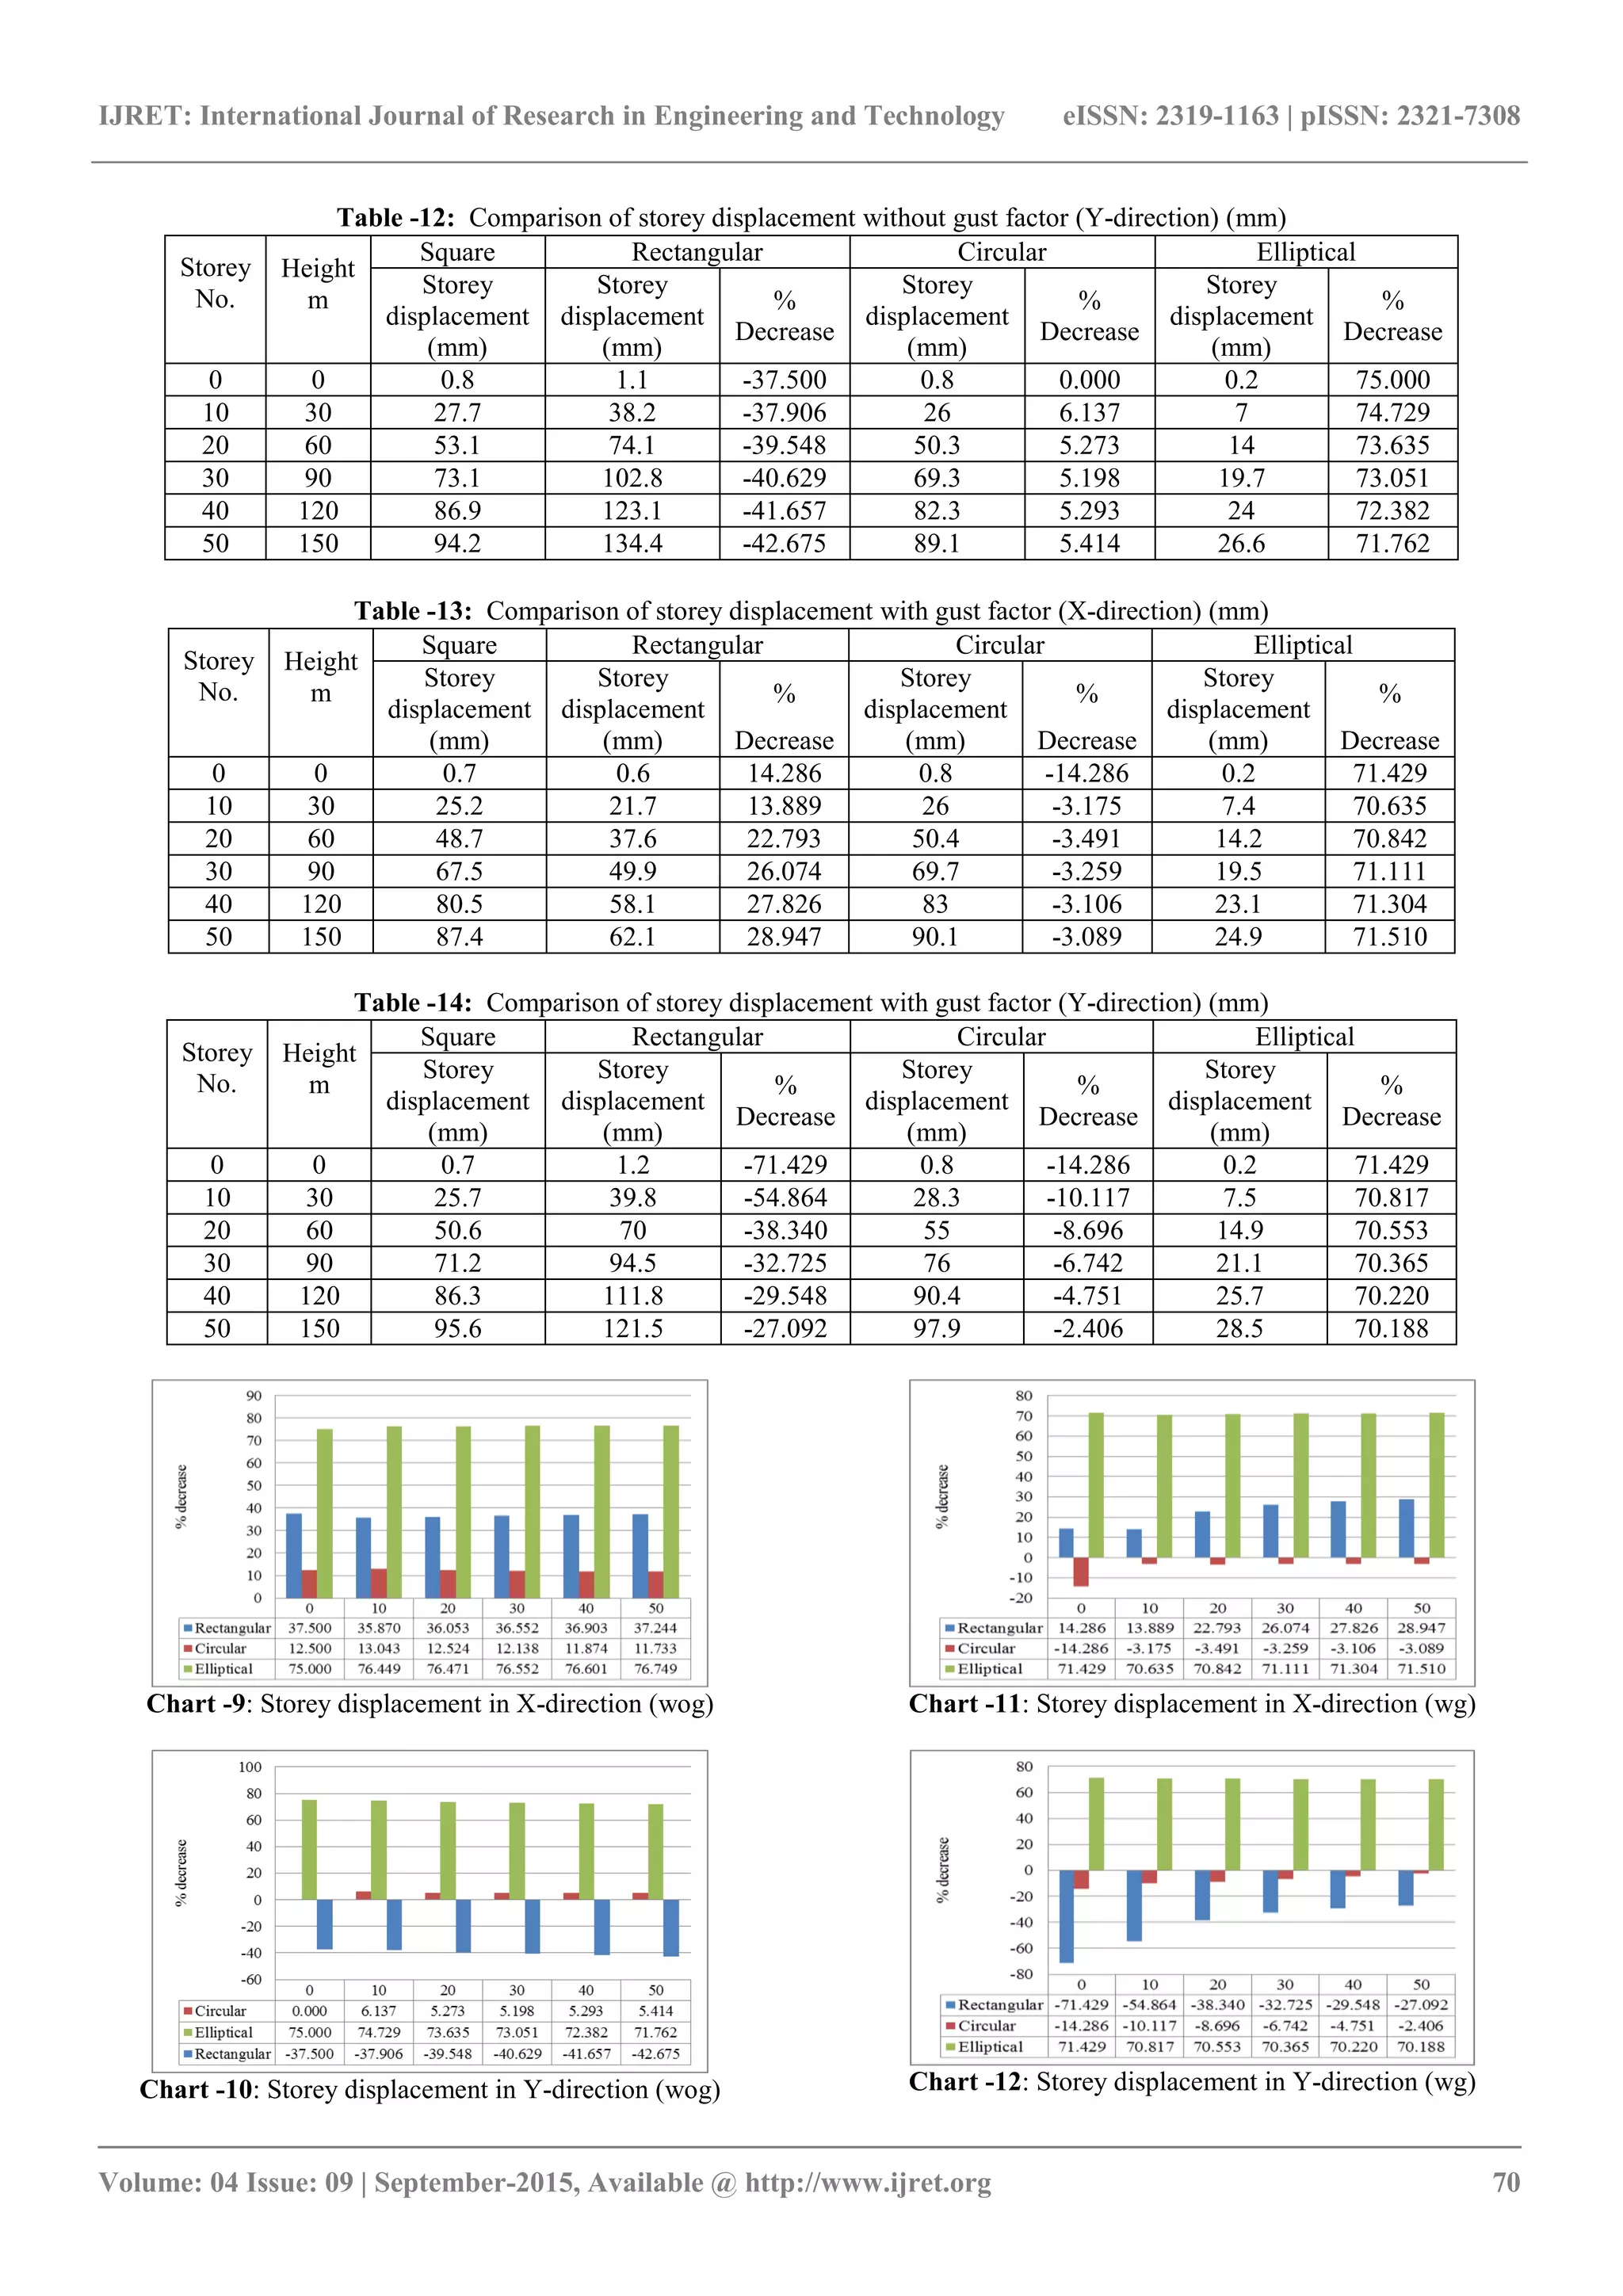
2. The percentage reduction in peak displacement in
circular building is 11.73 %, 76.74 % in elliptical
building ,31.18 % in rectangular building without gust
factor and 28.94 % in rectangular building,71.51 % in
elliptical building and it is more by 3.08 % in circular
building with gust factor in longitudinal direction when
compared with square building. The percentage
reduction in peak displacement in circular building is
5.41 %, 71.76 % for elliptical building and it is more
by 42.67 % for rectangular building without gust factor
and it is 70.18 % in elliptical building, it is more by 27
% in rectangular, 2.40 % in circular building when
compared with square building with gust factor in
transverse direction.
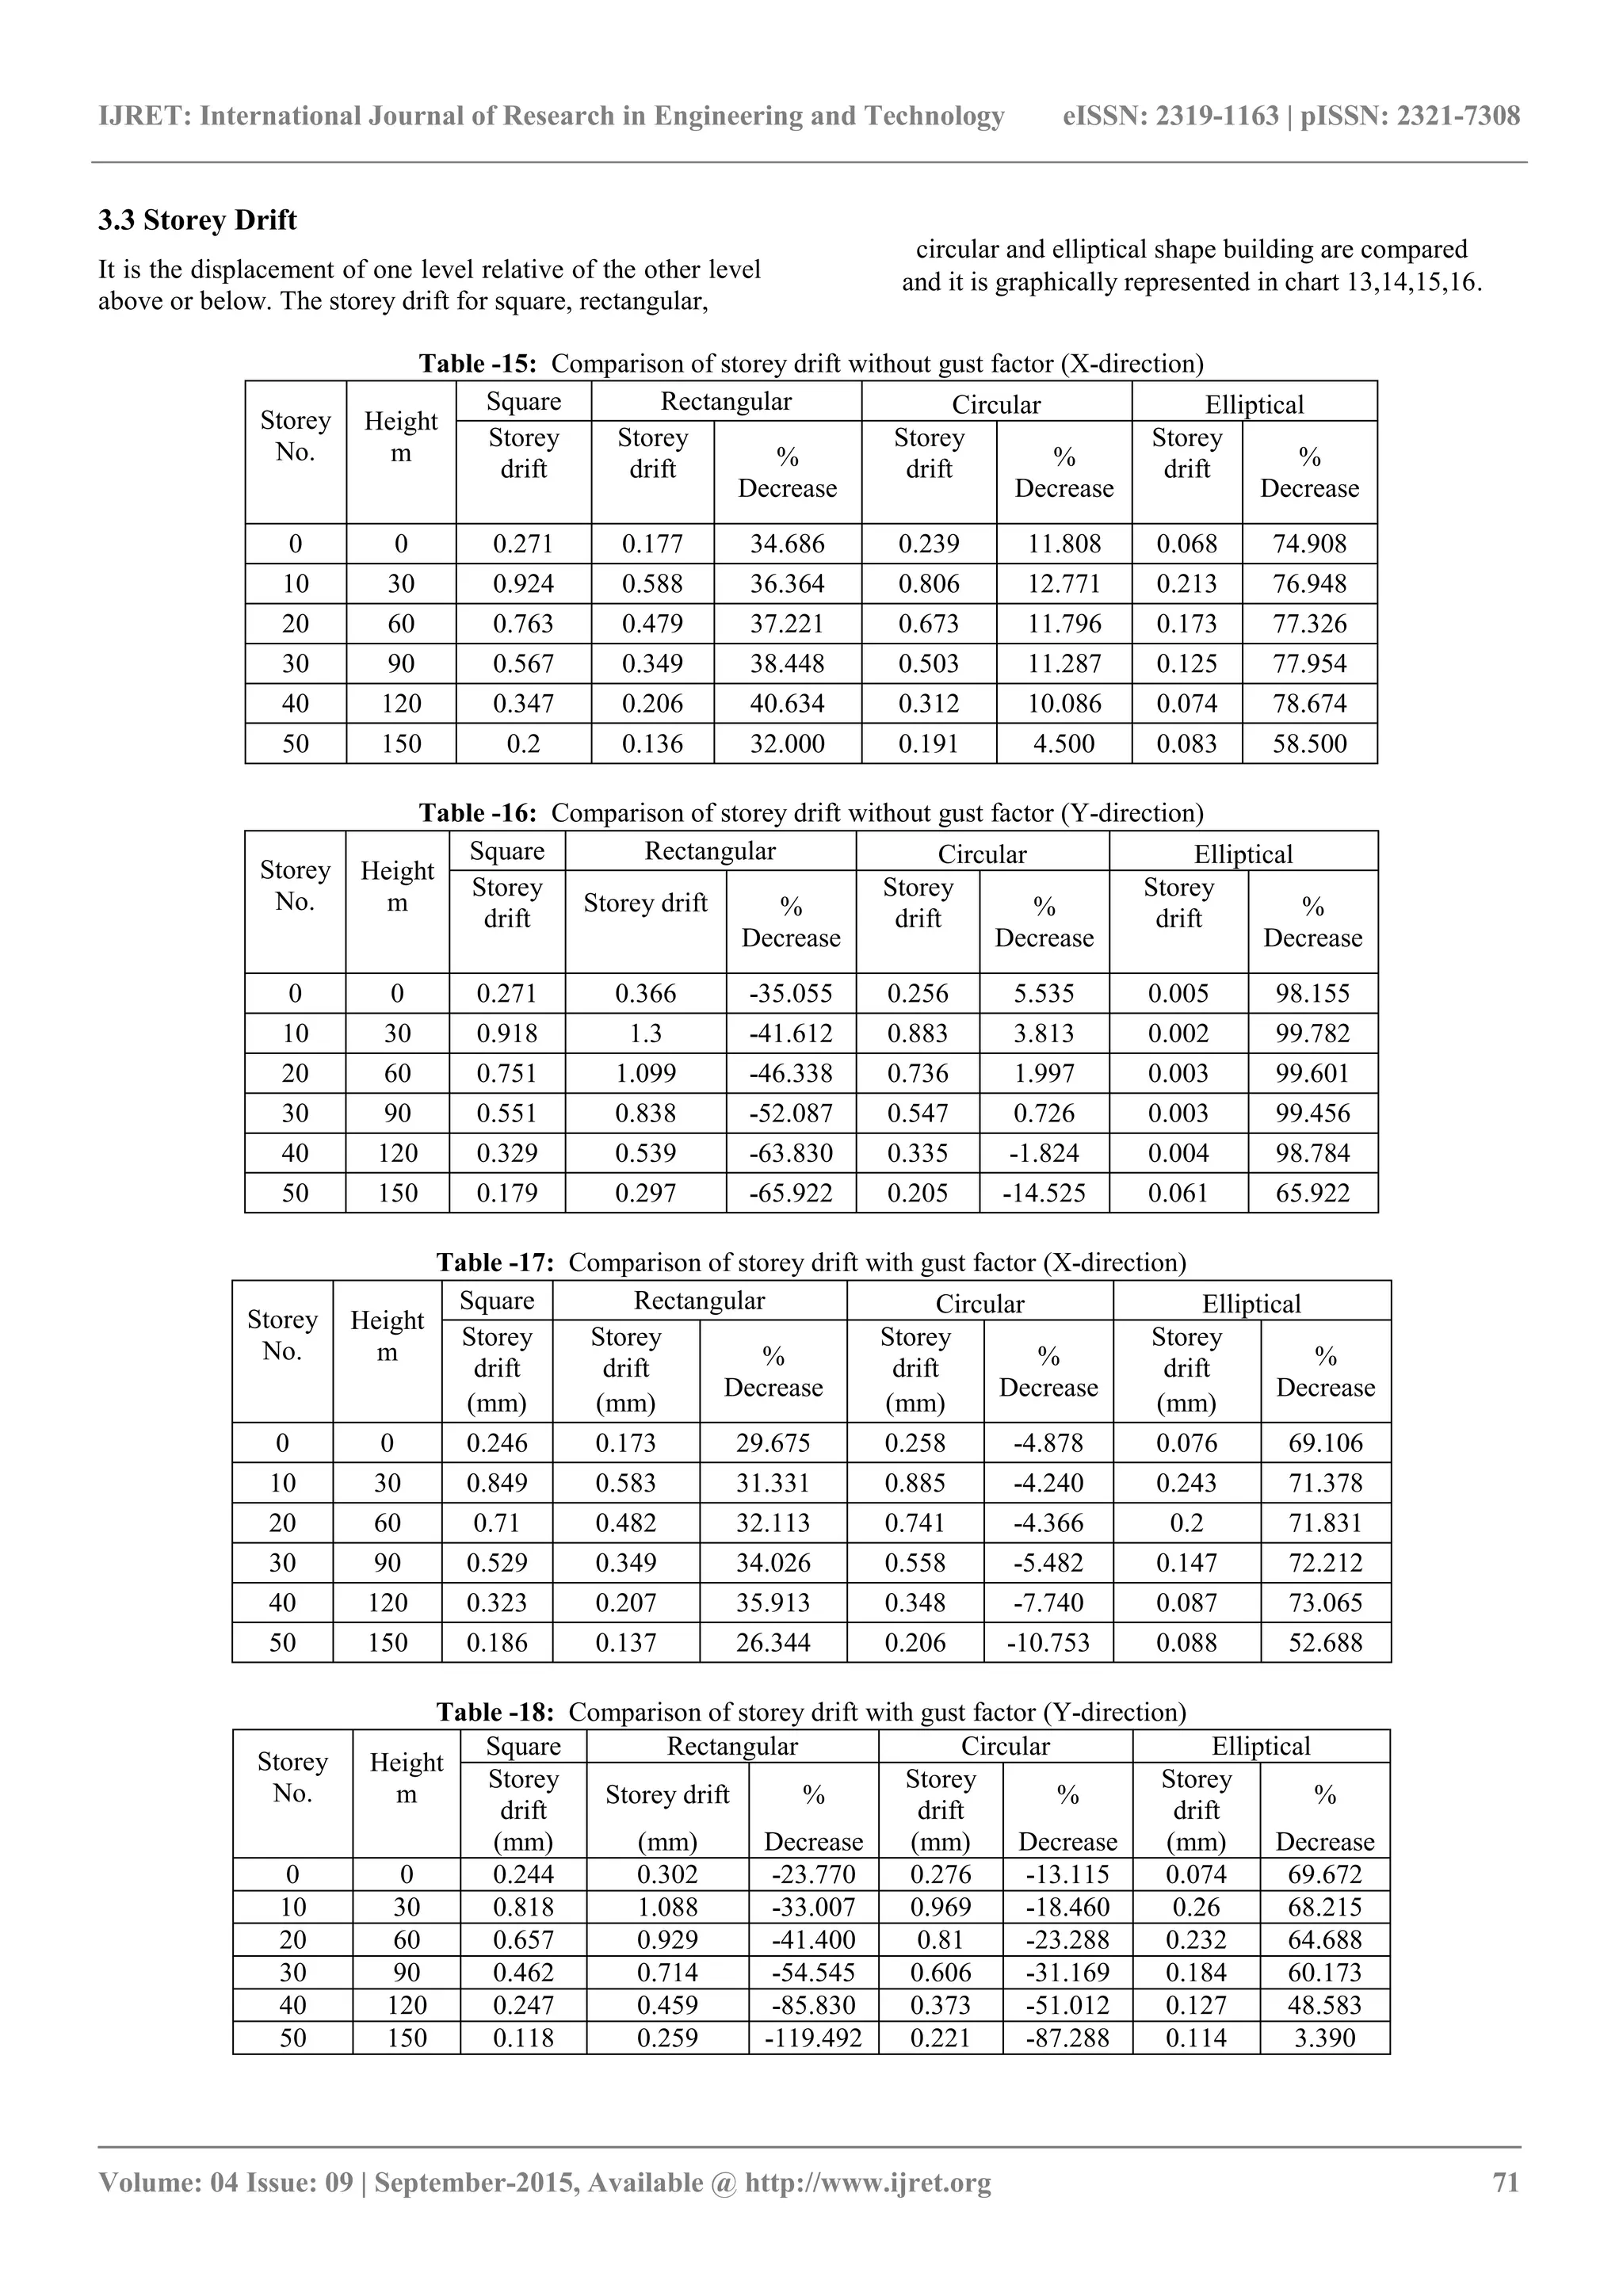
3. The percentage reduction in peak drift in circular
building is 4.50 %, 58.50 % in elliptical building , 32
% in rectangular building without gust factor and 26.44
% in rectangular building,52.68 % in elliptical building
and it is more by 10.75 % in circular building with gust
factor in longitudinal direction when compared with
square building. The percentage reduction in peak drift
in elliptical building is 65.92 % and it is more by 65.92
% for rectangular building and 14.52 % in circular
building without gust factor and it decreased by 3.39 %
in elliptical building, it is more by 119.49 % in
rectangular, 87.28 % in circular building when
compared with square building with gust factor in
transverse direction.
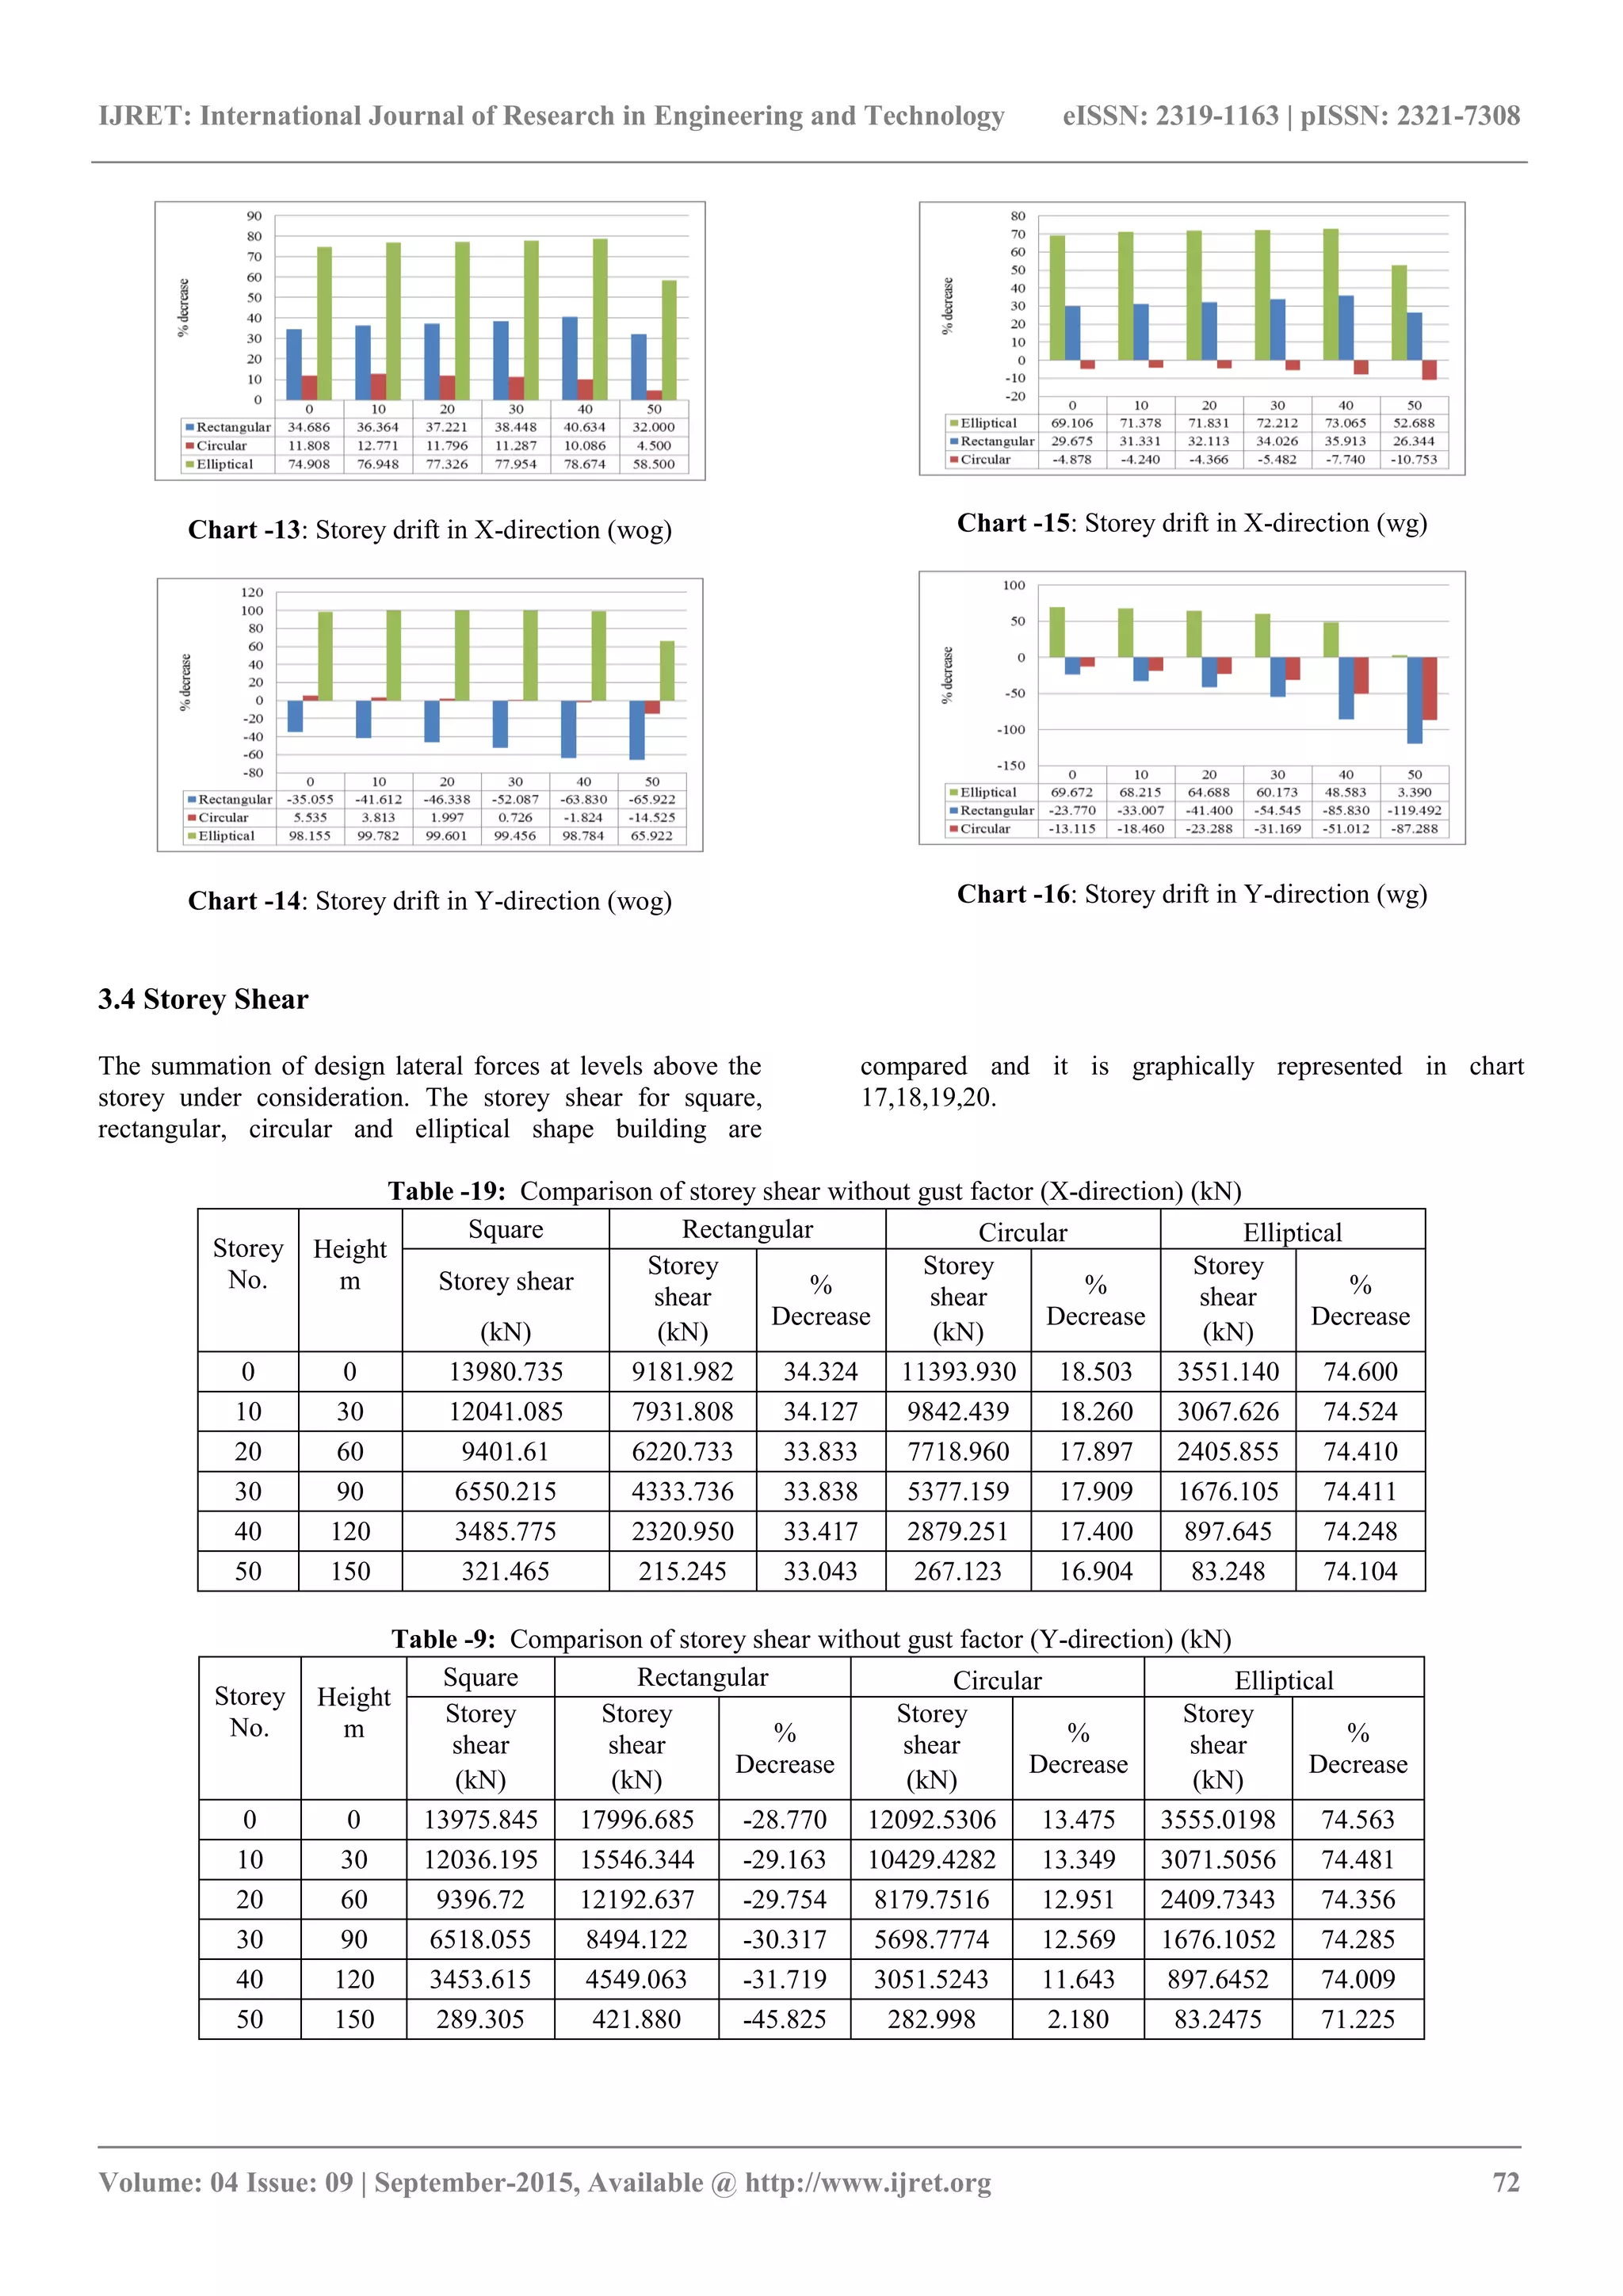
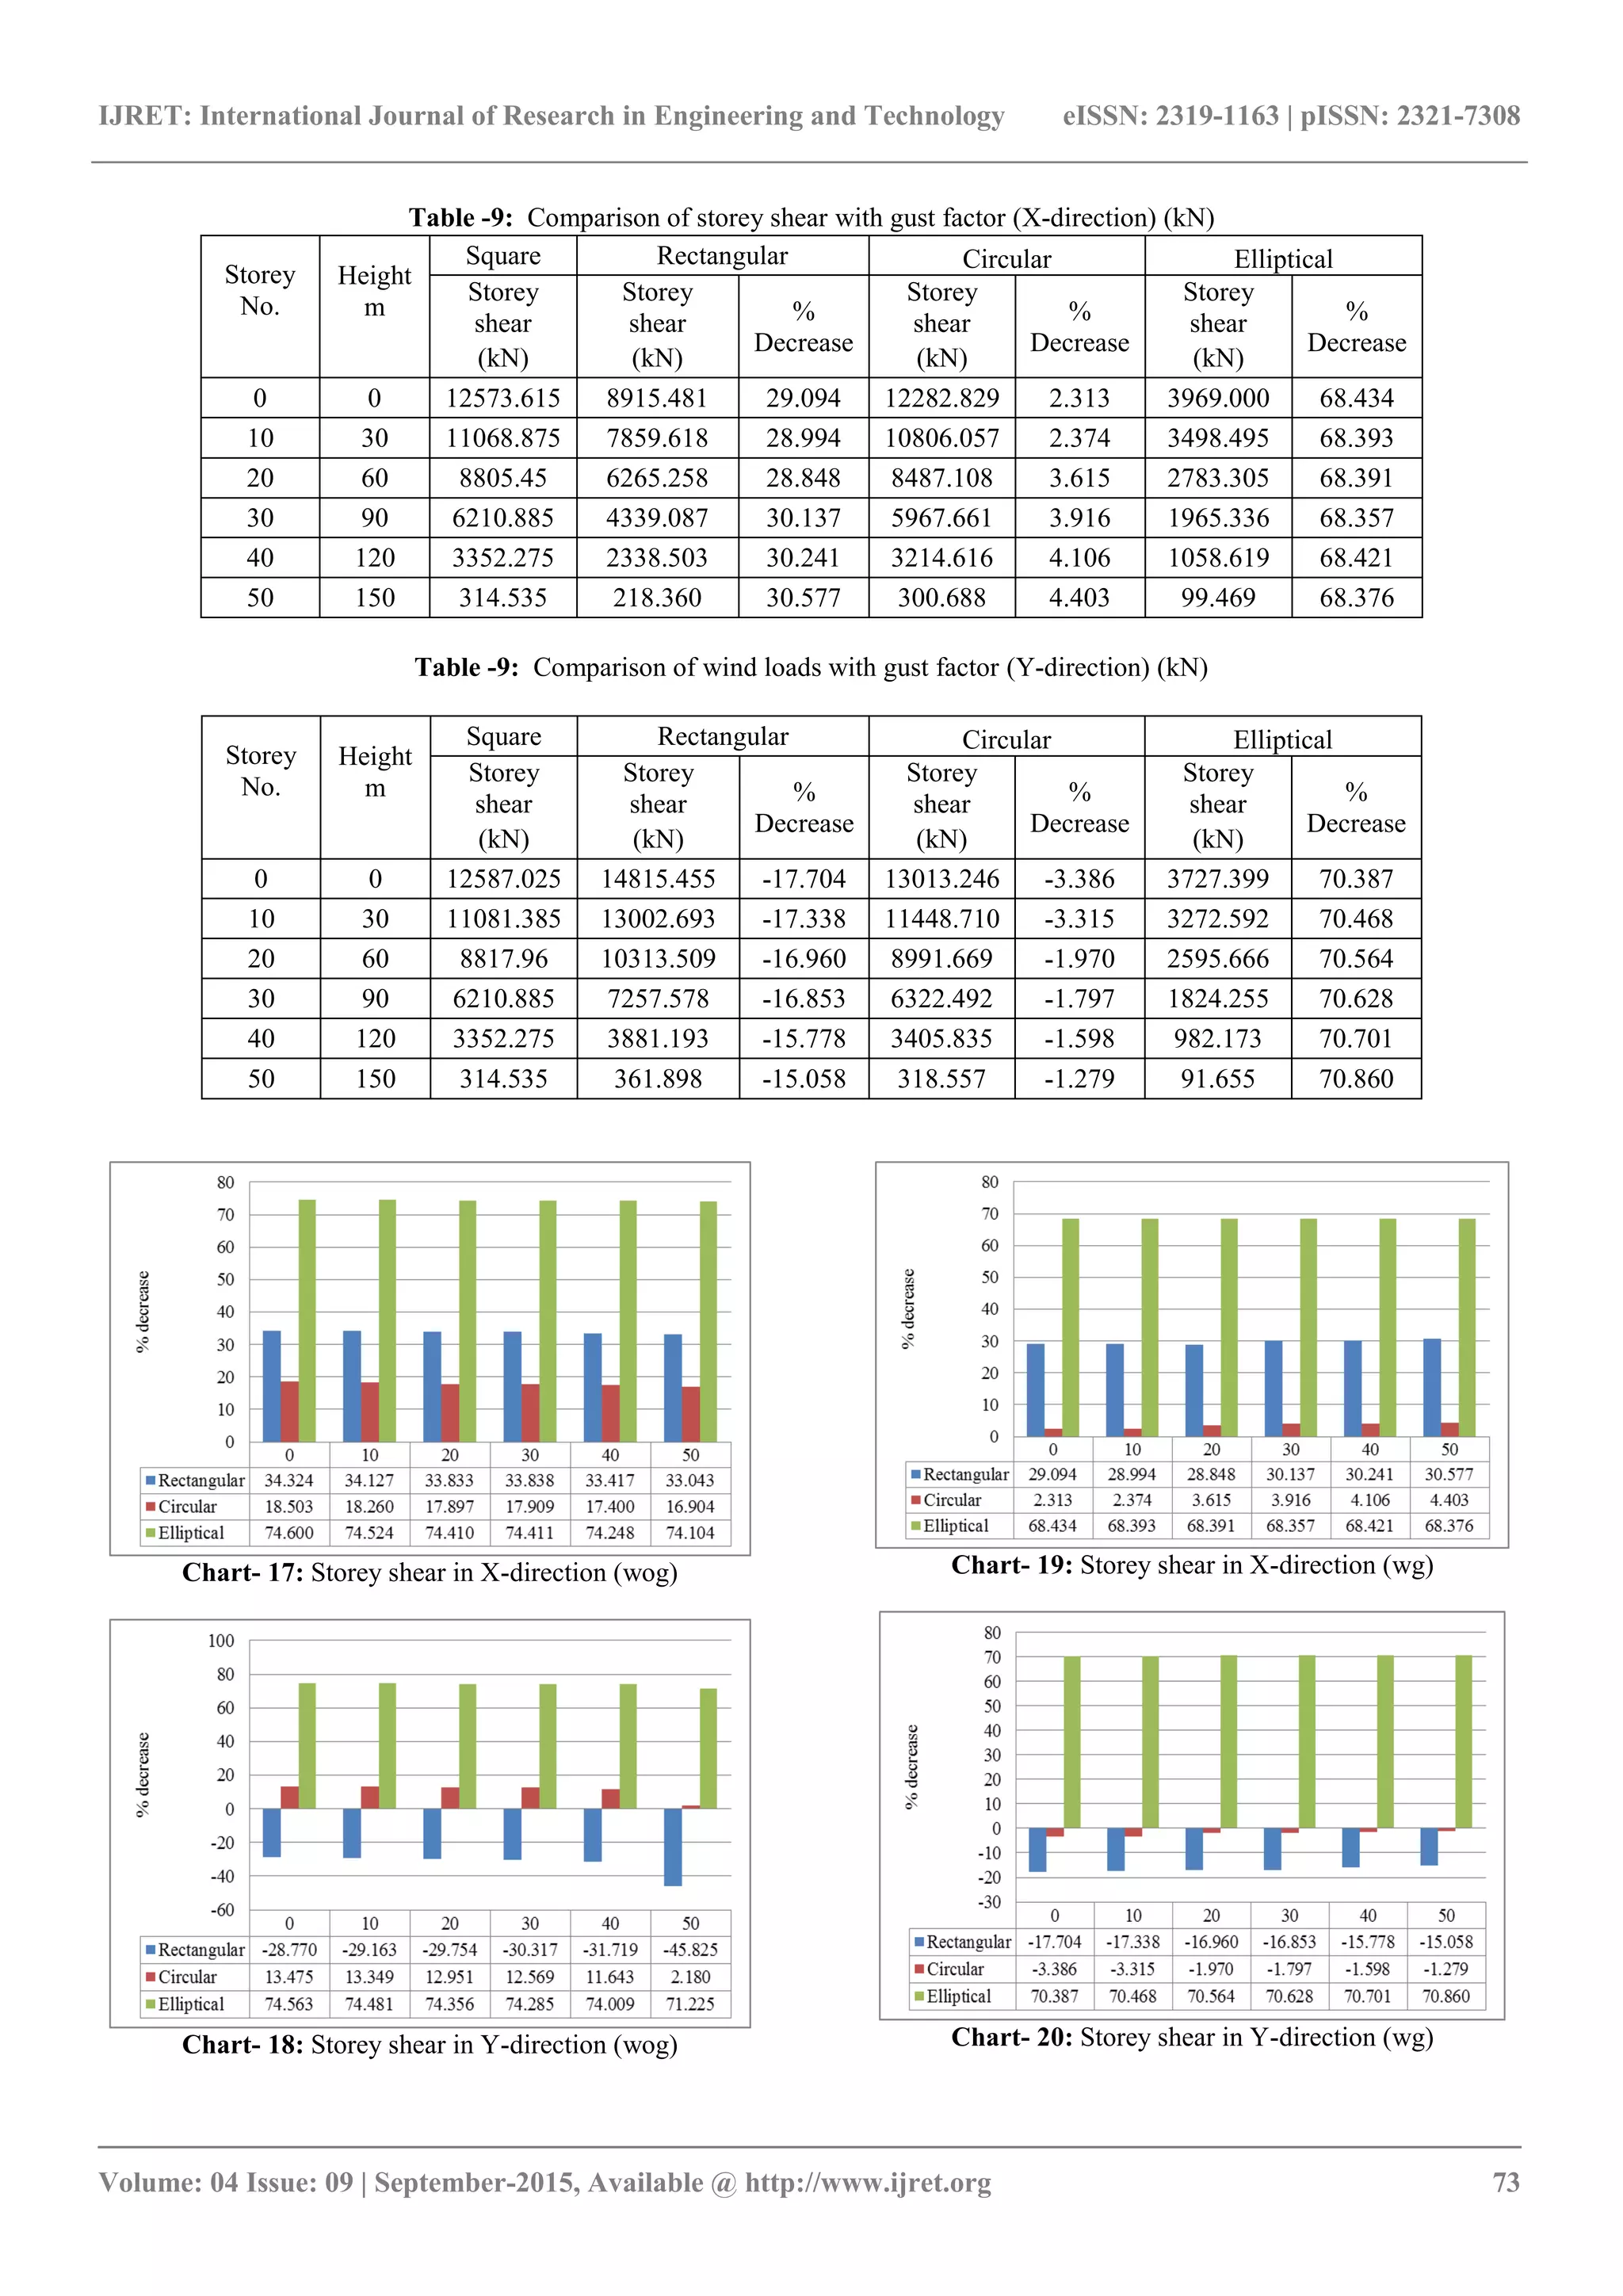
4. The percentage reduction in peak storey shear in
circular building is 16.90 %, 74.10 % in elliptical
building , 33 % in rectangular building without gust
factor and 30.57 % in rectangular building,4.40 % in
elliptical building and 68.37 % in circular building
with gust factor in longitudinal direction when
compared with square building. The percentage
reduction in peak drift in circular building is 2.18
%,71.22 % in elliptical building and it is more by
45.85 % for rectangular building without gust factor
and it decreased by 70.86 % in elliptical building, it is
more by 14 % in rectangular, 1.27 % in circular
building when compared with square building with
gust factor in transverse direction.
5. The gust factor method uses the statistical concepts of
a stationary time series to calculate the response of
structure to a gusty wind. Hence it is important for the
estimation of wind loads on the flexible structures.
6. Buildings having circular or elliptical plan forms have
a smaller surface perpendicular to the wind direction,
the wind pressure is less than in prismatic buildings.
7. From the above results, with the change in shape of
building from square to elliptical the wind intensity,
storey drifts, the lateral displacements, storey shear of
the building decreased. Hence it is conclude that wind
load is reduced by maximum percentage with an
elliptical plan.
REFERENCES
[1] J. A. Amin and A. K. Ahuja “Experimental study of
wind-induced pressures on buildings of various
geometries” Journal of engineering, science and
technology Vol. 3, No. 5, 2011, pp. 1-19.
[2] Prof. Sarita Singla, Taranjeet Kaur, Megha Kalra and
Sanket Sharma “Behaviour of R.C.C. tall buildings
having different shapes subjected to wind load”
Journal on civil and environmental engineering 02,
2012, 3-17.
[3] P. Harikrishna, A. Abraham, S. Arunachalam, S. Selvi
Rajan and G. Ramesh Babu “Pressure measurement
studies on a model of a tall building with different plan
shapes along the height” ,The seventh Asia-Pacific
conference on wind engineering, Taipei, Taiwan,
November 8-12, 2009.
[4] Hemil Chauhan, Manish Pomal, Gyayak Bhuta “A
comparative study of wind forces on high-rise
buildings as per IS 875(III)-1987 and proposed draft
code (2011)” Global research analysis, ISSN no.2277-
8160, Vol. 2, No. 5, May 2013.
[5] ETABS nonlinear Version 9.1.6, Extended 3D
analysis of the building systems, Computer and
Structures.
[6] IS: 875-1987(part 3) “Code of practices for design
loads (other than earth quake) for buildings and
structures”. Bureau of Indian standards, New Delhi
[7] Explanatory handbook on “Indian Standard Code
Practice for Design Loads” (other than earthquake) for
buildings and structures part 3 wind loads [IS 875
(PART 3): 1987]”, Bureau of Indian standards, New
Delhi.
BIOGRAPHIES
1. M. R. Wakchaure, Professor, Civil Engineering
Department, Amrutvahini College Of Engineering,
Sangamner, Maharashtra, India.
2. Sayali J. Gawali, Post Graduate Student,Civil
Engineering Department, Amrutvahini College Of
Engineering, Sangamner, Maharashtra