About Subsurface investigation, Depth of foundation, Significant depth, Types of investigation, Steps involved, Methods of boring, Types of samples and samplers, Core recovery and RQD.
The dynamic behavior of structures is an important topic in many fields. Aerospace engineers must understand dynamics to simulate space vehicles and airplanes, while mechanical engineers must understand dynamics to isolate or control the vibration of machinery. In civil engineering, an understanding of structural dynamics is important in the design and retrofit of structures to withstand severe dynamic loading from earthquakes, hurricanes, and strong winds, or to identify the occurrence and location of damage within an existing structure.
International Bridge Design Standards and ApproachesAIT Solutions
Workshop under the Capacity Building Programme of the Southern Road Connectivity Project / Expressway Connectivity Improvement Plan Project, March 2016
Concrete Gravity Dam Components
A gallery is a small passage in a dam for providing an access to the interior of the dam.
The gallery is usually rectangular in shape with its top and bottom either flat or semi circular.
For a gallery with its top and bottom flat, it is necessary that all the corners should be rounded. The width of gallery generally varies from 1.5 to 1.8 m. The height of the gallery in between 2.2 to 2.4 m, so that a person can easily walk inside it.
To provide drainage of the dam section.
2. To provide space for equipment required for drilling holes and grouting the hole to form a grout curtain in the foundation.
3. To provide space for header and return pipes for post cooling of concrete.
4. A gallery provide an access to the interior of the dam for inspection ard maintenance.
5. A Gallery also provides space for installing various instruments in the dam to study its structural behaviour.
6. A gallery can provide space for the mechanical and electrical equipment required for the operation of gates for spillways and outlets.
A shaft is a vertical opening provided in a dam. Shafts are required for locating headers of the post cooling system and for locating measuring devices.
Shafts are also required for the movement of elevators and the hoisting equipment. Sometimes shafts are constructed inclined to connect two galleries or the same gallery at two different elevations by a staircase or a lift arrangement.
A plumb line shaft is constructed at the maximum section of the dam to make observations of the deflection of the dam under loads.
A plumb bob is suspended by a wire fixed at the top of the shaft. As the dam deflects relative to the base, the plumb bob also moves by the same amount.
A stilling well shaft is a special shaft used to record fluctuations of the water level in the reservoir. The shaft is connected to the reservoir at a point below the minimum reservoir level.
There is a floating mechanism in the stilling well shaft which records fluctuations in the water level.
The spillway in a gravity dam is called overflow section. Spillway is provided to dispose of surplus water from the reservoir to the downstream.
Spillways are provided for all dams as a safety measure against overtopping and the consequent damages, and failure. spillway may be located either in the middle of the dam or at the end of the dam near abutment.
It must have adequate discharge capacity.
It must be hydraulically and structurally safe.
The surface of the spillway must be erosion resistant.
It should be provided with some device for the dissipation of excess energy
The portion of the gravity dam other than the spillway is a non-overflow section, a road is located on the non-overflow section of the dam.
At the one end of a gravity dam a power house is located. Water from the reservoir passes tnrough penstock and rotates the turbine provided at power elevations to produce electricity.
Water flowing over a spillway has a ver
this presentation describes in details the sinking operation of well foundations in different conditions and situations. the content here is suitable only for basic knowledge and educational purposes.
Earth and rockfill dams
Dam Classification
Gravity Dam
Arch Dam
Buttress Dam
Earth Dam
Rockfill Dam
Components of Earth Dams
Design Criterion of earth dams
La Gestión Administrativa Y Su Incidencia En El Compromiso Laboral De La Poli...inventionjournals
The research was framed in an analytical - descriptive study on the incidence of administrative management in the commitment of human police talent, with the purpose of giving a significant contribution to the organizational development of the Ecuadorian National Police. The purpose of the investigation is to contribute significantly to the police personnel at all levels of hierarchy and organization within the national territory of Ecuador. In my study is the quantitative approach, which shows the relationship between the two variables: administrative management and the commitment of human police talent. The present investigation begins with the identification of the problem of study, for which a previous investigation of field was used in some police units of the city of Quito, in order to determine punctually the problem. Then with the technical study the size of the sample under study is highlighted that are 400 surveyed nationwide. The study starts with the exploratory research where the necessary bibliography was collected to support the development of the thesis, such as the research question, the content of the information gathering instrument that is the survey, and the method of analysis employed for The effect. But fundamentally the bibliography served to have a wide spectrum around the administration and the commitment of the people, which was put into practice in the operationalization of the variables, which determined the questions of diagnosis and management performed and, The proposal of the management proposal. For the analysis of the information and data collected, we used the deductive, inductive and statistical methods, in order to go through a process of scientific investigation. The field investigation was carried out in several police units in the city of Quito, with the application of 2 types of survey: the diagnosis, and the management proposal, where a good amount of information related to the incidence was obtained Of these 2 variables, where it was determined that if there is a high incidence of administrative management in people, since the existing malaise around this issue was identified by police
In this work, the author builds a search algorithm for large Primes. It is shown that the number constructed by this algorithm are integers not representable as a sum of two squares. Specified one note of Fermat. Namely, we prove that there are infinitely many numbers of Fermat. It is determined that the first number of Fermat exceeding the number 2 1 4 2 satisfies the inequality n 17 .
Post-Yugoslav Cinema and Politics: Films, Lies and Video Tapeinventionjournals
The article discusses politics of post-Yugoslav cinema in its extra-cinematic domain. Development of cinematography in post-Yugoslav states has often drawn on common cultural connections. Plurality of identities, cultures and political beliefs were developed during this period. It was also accepted that parts of the post-Yugoslav societies share common cultures and have many similarities in their identities. Thus post-Yugoslav cinema and space are defined in addition to remaining unanswered issues of what national cinema means in the post-Yugoslav cinema. The films produced in this period are classified in three categories: films for national audiences, films for regional, post-Yugoslav audiences and films targeting international audiences. Politics was heavily involved in film making throughout this period. The resulting cinema can be used for the analysis of cultural and identity developments and nation-building processes. Finally, the article proves existence of post-Yugoslav cinema as part of post-Yugoslav culture that is imaginary culture without geopolitical space
New technology like (IoT) in recent years rapidly developing in a computing world. The Internet of things will change the real world, activities and objects from simple to most complex. Beside areas as Business, Cities, Transportation, Healthcare, Agriculture and different areas, The IoT will also have a major implication in institute/college. In digital era our College campus need of IoT technology for classy environment to utilize secured & modern technology for e-campuses activities in academic course of action. In general, campuses spread over a fairly large area and it’s very difficult to control for management to track everything happens.This project focuses on need of adopting IoT technology in campus using Secured for (e-Educational)- Campus academics. In near future drastically make changes for students in highly enabled IoT. Starting from needs and advantages ending with a possible architecture based on smart objects.
The Role of Tourism in Sustainability of the Rural Settlementfabrics: Cumalık...inventionjournals
The aim of this research is to examine the role of tourism activities on the sustainability of original rural settlement fabrics in the particular example of Cumalıkızık destination. In this research qualitative method has been used and research data were collected using interviews with local directors and observations. In this frame firstly the original fabric of Cumalıkızık destination within the boundaries of Bursa was examined. Then the effects of economic, social and cultural interactions which result from tourism activities on Cumalıkızık destination were considered both with positive and negative aspects. Finally, the effects of tourism activities to the destination on the preservation process of the original fabric were investigated. The data collected were analysed using descriptive analysis technique. From the analysis it was concluded that tourism activities had a significant effect on the sustainability of the original rural settlement fabrics.
Manuscript is handwritten old document. This paper highlights the types of manuscripts that are usually found in India and also the different initiatives adopted for cataloguing the Indian manuscripts. It focuses on the guidelines for storing and also handling of the manuscripts
Learning English “enjoyment or need” for the Students in Omaninventionjournals
: The purpose of this study is to identify whether students in Oman enjoy learning English. To find whether students learn English as an enjoyment or they just learn English out of necessity. The study identifies the % of students who love to learn English and who hate to learn. The study also endeavours to find out whether learning English is essential in Oman. This paper highlights the findings of a study conducted in Global college of Engineering (GCET), Muscat, Sultanate of Oman. The subjects used in this study are the third semester Foundation Studies students of GCET. Questionnaire comprising two parts, viz. Part-A and Part-B was administered to collect the information. The findings of the study highlight various benefits in learning English as enjoyment and not as compulsory subject under pressure
Intertextuality of Rumi’s Masnavi with Quran: Author’s intentional effort and...inventionjournals
The notion of intertextuality emphasized that all literary texts are related to or influenced by the texts prior them. However in some cases the intertextual relation between the former and the later text is specifically intentional. This specific intertextual relationship is the one that Gerad Genette called hypertextuality, which although like all intertextual relationships is depended on the relation between two concepts of the later text, hypertext and the earlier one, hypotext, pays special attention to the intentionality of the intertextual relationship. Being sensible toward this sort of deliberate relationships that the author of a hypertext crated in his/her work is one of the essentialities of translation practices. It seems that in some of the recent English translations of Rumi’s poetry the noted sensitivity on the hypertextual relationships was totally neglected and caused the text to be located in a different context. This article by shedding light on the concept of intertextual relationship between Rumi’s Masnavi and Quran, aimed to demonstrate the real context of Rumi’s poetry to those Rumi’s audiences who read his poetry in another language other than Persian.
Exploring the Cultural Differences in Polish and Turkish Companiesinventionjournals
Cultural differences are of crucial importance for conducting the international business. The general regularities seem not to account for the particularities of single countries. Thus, the purpose of the present research was to study business culture in Poland and Turkey due to their strengthening position as regional leaders. The research relied on the semi-structured interviews performed in tourism companies amongst Polish and Turkish business practitioners in 2016. The data was analyzed using the thematic analysis approach. Polish entrepreneurs were found to prove more pro-transactional approach while Turkish respondents emphasized pro-partnership one. In Poland the opinion on the business partner was formulated based on his/hers competences while in Turkey the role of good manners, politeness and the knowledge of culture, art and geopolitical situation was dominant. Polish respondents claimed high punctuality while one third of Turkish stated that it is possible for their business partners to wait for them even if they have no excuse for being late. The qualitative research presented in the paper requires to be followed by the extensive quantitative one. The paper attempts to fill the gap concerning the cultural differences in conducting business in Poland and Turkey.
Trainee Psychological Counselors’ Understanding of Ethicsinventionjournals
The Personal values and professional ethical codes are primary resources for practicing psychological counselors. Ethical dilemmas occur when personal values and professional ethical rules are incompatible. We examined the trainee counselors’ understanding of professional ethics. This qualitative study used vignette analysis with 68 undergraduate Turkish students. Using vignettes, the trainees indicated their approaches towards confidentiality, romantic relationships with former clients, curiosity, relationship boundaries, information sharing, self-disclosure, respect for privacy, and reports to third parties. Results revealed the need for ethics education and showed that many trainees would have difficulty with regard to identifying ethical dilemmas.
Architecture and Illusion in the works of Sheikh Bahaiinventionjournals
This paper investigates on the identification and evaluation of the architectural works of Sheikh Baha’i from the prospective of illusionism. Sheikh Baha’i built various urban and architectural monuments in the Safavid period (1501-1722) in Iran, mostly located in Isfahan. The Safavid era was a turning point in Iranian cultural history, which made significant transformations in Iranian architecture. Safavid architecture and urban design followed human centered, rational and at the same time spiritual notions and mostly reflected in the buildings and urban spaces of the period in Isfahan This period witnessed the most creative developments in art and culture and science, metaphysics and spiritual philosophy. Parallel to this as a combination of science, metaphysics and art, illusionism and its knowledge and implementation raised during this period. Illusion relates to what is unexplainable by common law or phenomena. The illusion is something unusual and fabulous. It is often perceived to be supernatural or magical phenomena, as it does not adhere to commonly experienced circumstances. According to this definition, identification of the intriguing and unusual architectural and urban works of Sheikh Baha’i as examples of ilussionism in architecture is possible. Defining diverse methods of implementing illusion in architecture, this article investigates and analysis some works of Sheikh Baha’i according to these methods. Shah (Imam) Mosque, Sheikh Lotf Allah Mosque,Ali Qapo Palace, which is located in Naghshe Jahan square in Isfahan. Also,Minar Jonban (Shaking Minarets) and Si-o-Seh pol are samples of the architectural works of Sheikh Baha’i which used as case studies in this article.
Achievements and Implications of HIV Prevention Programme among Transport Wor...inventionjournals
Background: HIV prevention programs across the world have considered drivers of articulated vehicles, especially those travelling long distances, as an important bridge population for the transmission of HIV to the general population and are thus a major target for HIV reduction programming. This paper therefore presents achievements of HIV prevention programme among transport workers in Bayelsa State, Nigeria including its implications for future programming. Methods: A total of three civil society organizations were engaged by Bayelsa State Agency for the Control of AIDS and funded to provide HIV prevention programmes under the HIV/AIDS fund (HAF) II project. A total of 3900 transport workers were the estimated sample size for this intervention and purposive sampling was used in selecting participants. The minimum prevention package intervention (MPPI) was adopted in the implementation of this project and data collected were entered into District Health Information Software (DHIS) 2 before being exported and analyzed using Microsoft Excel. Results: A total of 35 community dialogues were held and 172 influencers participated within the duration of the intervention. The number of peers registered were 3786 out of which, 462 (12.2%) were registered in the first quarter. The duration of the programme witnessed the distribution of a total number of 39194 condoms which represented 73.5% of the total number of condoms required. A total of 2381 (62.9%) of the registered peers were reached with all the three stages of MPPI and 2878 (76.0%) were reached with only HCT. Among these, 81 (2.8%) were tested positive to HIV. Conclusion: This study showed that the HIV prevalence was 2.8% among the participants. However, many of the registered peers were missing during HCT. Efforts to develop appropriate IEC materials for drivers and in particular to improve the sustainability of outreach and peer education activities within key communities, should be maintained and reinforced. Also, flexible approaches to condom distribution need to be developed and promoted.
Relations of Domination on Bourdieu’s Perspective between Food Handlers and T...inventionjournals
Restaurants, as social spaces, are scenarios of interaction between food handlers and bosses in the daily preparation of the meals offered to customers. Ensuring food safety, and therefore, the prevention of the occurrence of foodborne disease outbreaks, is the responsibility of both parties. However, some structural and social aspects are seen as elements that may act to depreciate food safety. A qualitative ethnographic study was carried out with the use of participant observation in commercial restaurants in two Brazilian cities. Thus, this article seeks to present several points of conflict between food handlers and their bosses and their implications for food safety.
“Niveles de Rendimiento Académico en estudiantes de las carreras de Hotelería...inventionjournals
El propósito de la investigación fue determinar la incidencia de niveles de rendimiento académico de estudiantes de la carrera de hotelería y turismo, comunicación social de la universidad Técnica de Babahoyo Extensión Quevedo-Ecuador, año 2014. Desde la perspectiva de una investigación de nivel aplicativo se llevó a cabo un conjunto de actividades utilizando conceptos teóricos de rendimiento académico en estudiantes de las carreras. Se eligió una muestra de del III A y B 40 estudiantes y 40 estudiantes y 12 docentes de los III y IV ciclo. Con la presente actividad se logró conocer la incidencia del nivel de rendimiento académico. El tipo de investigación fue descriptivo correlacional bajo un diseño no experimental de campo; para la recolección de datos se utilizaron cuestionarios para Docentes y Estudiantes, para la segunda variable se realizó una ficha de recojo de información para los promedios de notas de diversos cursos de las carreras. Palabras Claves: Rendimiento académico, niveles de rendimiento, educación. SUMMARY: The purpose of the research was to determine the incidence of academic achievement levels of students of the hotel and tourism career, social communication of the Technical University of Babahoyo Extension Quevedo-Ecuador, year 2014. From the perspective of an application level research; Was carried out a set of activities using the theoretical concepts academic achievement of the students of the races. A sample of III A and B was chosen 40 students and 40 students of IV A and B are 70 students and 08 teachers of cycles III and IV cycle. With the present activity, it was possible to know the level of incidence of the level of academic achievement. The type of research was descriptive correlational, under a non-experimental field design; For data collection, a questionnaire was used for Teachers and Students. For the second variable, a data collection form was used for the average scores of the various courses of the courses
The Community Perception About Colíder’s Colonization In Brazilinventionjournals
This article aims to register the history of Colíder’s colonization in order to understand the meanings that the settlers community has in relation to three aspects: publicity, encountered difficulties and the confrontation with the “Settler”. This register was made through the three settlers’ testimony: José Afonso Pereira, Gema Ignês Postal Barbiero and Helena Maria Miranda, who arrived in the region from 1974. Colíder city is located in the midwest region of Brazil and it was colonized by a private company called "Colonization, Industrialization and Rural Development". The settlers’ migration to the new city in searching of better conditions was compromised by the non-compliance of the colonizing company in providing the necessary documentation of the land possession. The reality is richer and more complex, and what has been presented is a simplification. Therefore, the study is justified, since it is hoped that the registration of these informations will help the future generations to understand how was Gleba Cafezal’s occupation, now Colíder.
The Effects of Income, Income Distribution and Health Expenditures on Under-F...inventionjournals
The level of development of a country is explained together with the income, education and health level of the people living in that country. Health level is measured by health status indicators. In this study, the relationship between income level, income distribution, health expenditures and under five mortality rate, which is one of the most important health status criteria, is discussed. So, the aim of this study is to find out how international level income levels, income distribution and health expenditures could influence the underfive mortality rate. For this purpose, the explanatory power of the economic indicators of 190 countries for 2013 on the under-five mortality rate was examined by multiple regression analysis. According to analysis results, the increase in health expenditures and income levels has a positive effect on the under-five mortality rate, also the income distribution deterioration has the negative impact the under-five mortality. Moreover, the increase in the share of private health expenditures in the health sector, especially in low-income countries, has been reached as a negative impact on the under-five mortality rates.
Dark Side of a Global Community: Girl Trafficking in the Southeast of Mexicoinventionjournals
Each day, hundreds of girls and women become victims of girl trafficking. International organized crime groups recruit them in forms of sexual exploitation. The trafficking process begins with the demand for girls to be used in prostitution. Sex trafficking has become a significant problem in global communities like Tabasco, a state in the southeast of Mexico. The state of Tabasco is a source, destination and transit place for girl trafficking as commercial sexual exploitation. In this place, there is trafficking within the state and a large number trafficked come from a region known as the Northern Triangle. The method performed to approach these qualitative investigation entailed classical approaches involving newspaper sources, as well as direct, and Geographic analysis. Findings show that girl trafficking has been intensified in the poorest municipalities of Tabasco. It was also realized that girl trafficking as sexual exploitation is practiced within the Southeast of Mexico. Tabasco is exposed as a recruitment site for traffickers. Proactive and police measures are necessary for containing the phenomenon
Sibling Birth Spacing Influence on Extroversion, Introversion and Aggressiven...inventionjournals
Sibling spacing refers to the birth interval between consecutive children in the family. The family is the basic unit of socialization. Family interactions and other dynamics such as birth order and sibling spacing shape the personality of children. This study investigated the relationship between sibling birth spacing and, extroversion and introversion characteristics of adolescents in Nairobi, Kenya. The study adopted mixed methods research paradigm with the correlation design. Purposive and simple random sampling techniques were used to select three schools for the study sample and participants. From each of the three schools, twenty five students were selected to make a total sample of 75 participants. The data collection instruments for the study were standardized questionnaires and observation guides. Data was collected and analyzed using Pearson correlation analysis and Analysis of Variance. The study concluded that close sibling spacing tends to produce extraverted and highly aggressive children while wide sibling spacing tends to produce introverted and less aggressive children. The study further found that the only children, ranked highest in introversion and, lowest in aggressiveness and extraversion. The study recommended that sibling spacing knowledge should be used by school career guidance masters as locally available method of predicting personality.
Evolving Priority in Developing Nations: to Prevent Personal Bias in Social W...inventionjournals
Health remains an important goal for society.‘Health for all’ is the motto of the world health organization. All hospitals spend only on allopathic drugs &modernization despitethe benefits of exercise medicine being well proven Actually, If there is a single remedy which can prevent & treat a host of lifestyle diseases like hypertension, diabetes, cardiac disease,osteoporosis, depression,etc it is only 30 minutes of exercise a day. More so it is free., Probably realizing these benefits there was a move to introduce a holistic exercise Suryanamaskar by the Indian government in year 2015 in all schools. After resistance from few organizations this path breaking decision was unfortunately withdrawn.This paper focuses on the importance of simple, economical health inventions& exercises like Suryanamaskar&the need to remove personal choices & viewpoints from theirintroduction for benefit of all.For large & populous countries like India which can barely afford to spend 3 % of GDP on health, disease prevention by exercise medicine is a good solution.To allow personal bias of a few people to hamper progress of the majority is an alarming & regrettable trend.As is said “one can count the seeds in an apple but not the apples in a seed “Only time will tell the far reaching losses & effects of these myopic & vote bank appeasing decisions.
Seismic pounding between adjacent rc buildings with and without base isolatio...eSAT Journals
Abstract Among the possible structural damages during an earthquake, the seismic induced pounding also has been one of the commonly observed phenomena. This is because the separation gap between many adjacent buildings is inadequate to accommodate the relative motions, so buildings vibrate out of phase and collides. Despite the fact that the seismic pounding between nearby structures is considered in the codal procurements, the act of development is still an issue in numerous metropolitan zones where the structures are built with no adequate partition separation which brings about their pounding. In this study E-Tabs nonlinear software is used for simulation of adjacent multi-storeyed RC frame buildings of G+14 and G+9 storey, the provisions that may reduce the effects of pounding like the separation distance, addition of shear walls, lateral bracings and variation in storey height of the buildings have been considered for analysis. And the responses like storey-displacement and pounding force by considering both fixed base and base-isolated conditions are arrived. Keywords: Seismic pounding, RC frame building, Separation distance, Gap elements, Storey-displacement Pounding force, Fixed-base, Base isolation.
Effect of Seismic Joint in the Performance of Multi-Storeyed L-Shaped BuildingIOSR Journals
The choices of building shapes and structural systems have significant effect on their seismic performance. While symmetrical buildings result in a fairly uniform distribution of seismic forces throughout its components. Unsymmetrical buildings result in highly indeterminate distribution of forces making the analysis and prediction more complicated. L-shaped buildings are among those unsymmetrical structures which are most commonly found in practice in the form of school, office, commercial buildings. In this work three dimensional models of L-shaped buildings are investigated for their seismic performance, varying bay length and storey height. These models were analysed for three conditions viz with gap, with seismic joint and with neither of these. The modeling of structures analysis is carried out using STAAD Pro V8i, also the performance is analysed providing brick infill and compared with, without infill condition. Performances is measured in terms of displacements, axial forces, bending moments, shear forces and compared for those conditions mentioned in the identified column viz., corner, intermediate and interior
International Journal of Engineering Research and Applications (IJERA) is an open access online peer reviewed international journal that publishes research and review articles in the fields of Computer Science, Neural Networks, Electrical Engineering, Software Engineering, Information Technology, Mechanical Engineering, Chemical Engineering, Plastic Engineering, Food Technology, Textile Engineering, Nano Technology & science, Power Electronics, Electronics & Communication Engineering, Computational mathematics, Image processing, Civil Engineering, Structural Engineering, Environmental Engineering, VLSI Testing & Low Power VLSI Design etc.
PERFORMANCE BASED ANALYSIS OF VERTICALLY IRREGULAR STRUCTURE UNDER VARIOUS SE...Ijripublishers Ijri
In the recent years a lot of attention has been given to the earthquake analysis of structure it is one of the most devastating
natural calamity and which causes severe damage not only to the properties but also to the lives. This is the
reason there has been a lot of focus on the structures to be earthquake resistant. Buildings get damaged mostly due
to the earthquake ground motions. In an earthquake, the building base experiences high frequency movements, which
results in the inertial force on the building and its components and this problem gets worse when a structure is irregular
in shape, size etc,. Therefore, there is a lot to work on the seismic behavior of the irregular building which might not
respond the way regular building does. It makes the irregular building quite more complex and unpredictable during
the course of an earthquake.
Dynamic Analysis of Multi-Storeyed Frame-Shear Wall Building Considering SSIIJERA Editor
The structural system of a high-rise building often has a more pronounced effect than a low rise building on the
total building cost and the architecture aspect of building. Shear walls are lateral load resisting structural
systems which provide stability to structures from lateral loads like wind and seismic Loads. The design of multi
storey building is to have good lateral load resisting System along with gravity load system for safety of
occupant and for better performance of structure even in most adverse condition. The main scope of this project
is to apply class room knowledge in the real world by designing a multi-storied residential building. Shear walls
are more efficient in resisting lateral loads in multi storied buildings. Steel and reinforced concrete shear walls
are kept in major positions of multi storied buildings which are made in consideration of seismic forces and
wind forces. To solve this purpose shear walls are a very powerful structural elements, if used judiciously can
reduce deflections and stresses to a very great extent. Our project contains a brief description of building with
shear wall and without shear wall thoroughly discussed structural analysis of a building to explain the
application of shear wall. The design analysis of the multi storied building in our project is done through
STAAD-PRO, most popular structural engineering software. It is featured with some ultimate power tool,
analysis and design facilities which make it more users friendly.
EFFECT OF POUNDING ON GLOBAL RESPONSES OF BUILDINGS CONSTRUCTED IN A ROWIAEME Publication
Pounding is very complex phenomenon and it has been observed very often in metropolitan cities, during an earthquake, where series of buildings in a row without any seismic gaps are in abundance. Due to pounding during strong ground motion, the acceleration at pounding level considerably increases and generates extra pounding force which causes major structural damages or sometime results into building collapse.
This paper deals with the study of effects on global response of structures due to pounding during an earthquake. Time history analysis has been done to evaluate the pounding effects for different models of building when subjected to various ground motions into two different cases. The study have shown the effect of pounding on global response of adjacent structures in terms of acceleration, and impact forces which get amplified in many times.
Quality defects in TMT Bars, Possible causes and Potential Solutions.PrashantGoswami42
Maintaining high-quality standards in the production of TMT bars is crucial for ensuring structural integrity in construction. Addressing common defects through careful monitoring, standardized processes, and advanced technology can significantly improve the quality of TMT bars. Continuous training and adherence to quality control measures will also play a pivotal role in minimizing these defects.
Automobile Management System Project Report.pdfKamal Acharya
The proposed project is developed to manage the automobile in the automobile dealer company. The main module in this project is login, automobile management, customer management, sales, complaints and reports. The first module is the login. The automobile showroom owner should login to the project for usage. The username and password are verified and if it is correct, next form opens. If the username and password are not correct, it shows the error message.
When a customer search for a automobile, if the automobile is available, they will be taken to a page that shows the details of the automobile including automobile name, automobile ID, quantity, price etc. “Automobile Management System” is useful for maintaining automobiles, customers effectively and hence helps for establishing good relation between customer and automobile organization. It contains various customized modules for effectively maintaining automobiles and stock information accurately and safely.
When the automobile is sold to the customer, stock will be reduced automatically. When a new purchase is made, stock will be increased automatically. While selecting automobiles for sale, the proposed software will automatically check for total number of available stock of that particular item, if the total stock of that particular item is less than 5, software will notify the user to purchase the particular item.
Also when the user tries to sale items which are not in stock, the system will prompt the user that the stock is not enough. Customers of this system can search for a automobile; can purchase a automobile easily by selecting fast. On the other hand the stock of automobiles can be maintained perfectly by the automobile shop manager overcoming the drawbacks of existing system.
Industrial Training at Shahjalal Fertilizer Company Limited (SFCL)MdTanvirMahtab2
This presentation is about the working procedure of Shahjalal Fertilizer Company Limited (SFCL). A Govt. owned Company of Bangladesh Chemical Industries Corporation under Ministry of Industries.
CFD Simulation of By-pass Flow in a HRSG module by R&R Consult.pptxR&R Consult
CFD analysis is incredibly effective at solving mysteries and improving the performance of complex systems!
Here's a great example: At a large natural gas-fired power plant, where they use waste heat to generate steam and energy, they were puzzled that their boiler wasn't producing as much steam as expected.
R&R and Tetra Engineering Group Inc. were asked to solve the issue with reduced steam production.
An inspection had shown that a significant amount of hot flue gas was bypassing the boiler tubes, where the heat was supposed to be transferred.
R&R Consult conducted a CFD analysis, which revealed that 6.3% of the flue gas was bypassing the boiler tubes without transferring heat. The analysis also showed that the flue gas was instead being directed along the sides of the boiler and between the modules that were supposed to capture the heat. This was the cause of the reduced performance.
Based on our results, Tetra Engineering installed covering plates to reduce the bypass flow. This improved the boiler's performance and increased electricity production.
It is always satisfying when we can help solve complex challenges like this. Do your systems also need a check-up or optimization? Give us a call!
Work done in cooperation with James Malloy and David Moelling from Tetra Engineering.
More examples of our work https://www.r-r-consult.dk/en/cases-en/
Welcome to WIPAC Monthly the magazine brought to you by the LinkedIn Group Water Industry Process Automation & Control.
In this month's edition, along with this month's industry news to celebrate the 13 years since the group was created we have articles including
A case study of the used of Advanced Process Control at the Wastewater Treatment works at Lleida in Spain
A look back on an article on smart wastewater networks in order to see how the industry has measured up in the interim around the adoption of Digital Transformation in the Water Industry.
Sachpazis:Terzaghi Bearing Capacity Estimation in simple terms with Calculati...Dr.Costas Sachpazis
Terzaghi's soil bearing capacity theory, developed by Karl Terzaghi, is a fundamental principle in geotechnical engineering used to determine the bearing capacity of shallow foundations. This theory provides a method to calculate the ultimate bearing capacity of soil, which is the maximum load per unit area that the soil can support without undergoing shear failure. The Calculation HTML Code included.
Immunizing Image Classifiers Against Localized Adversary Attacksgerogepatton
This paper addresses the vulnerability of deep learning models, particularly convolutional neural networks
(CNN)s, to adversarial attacks and presents a proactive training technique designed to counter them. We
introduce a novel volumization algorithm, which transforms 2D images into 3D volumetric representations.
When combined with 3D convolution and deep curriculum learning optimization (CLO), itsignificantly improves
the immunity of models against localized universal attacks by up to 40%. We evaluate our proposed approach
using contemporary CNN architectures and the modified Canadian Institute for Advanced Research (CIFAR-10
and CIFAR-100) and ImageNet Large Scale Visual Recognition Challenge (ILSVRC12) datasets, showcasing
accuracy improvements over previous techniques. The results indicate that the combination of the volumetric
input and curriculum learning holds significant promise for mitigating adversarial attacks without necessitating
adversary training.
About
Indigenized remote control interface card suitable for MAFI system CCR equipment. Compatible for IDM8000 CCR. Backplane mounted serial and TCP/Ethernet communication module for CCR remote access. IDM 8000 CCR remote control on serial and TCP protocol.
• Remote control: Parallel or serial interface.
• Compatible with MAFI CCR system.
• Compatible with IDM8000 CCR.
• Compatible with Backplane mount serial communication.
• Compatible with commercial and Defence aviation CCR system.
• Remote control system for accessing CCR and allied system over serial or TCP.
• Indigenized local Support/presence in India.
• Easy in configuration using DIP switches.
Technical Specifications
Indigenized remote control interface card suitable for MAFI system CCR equipment. Compatible for IDM8000 CCR. Backplane mounted serial and TCP/Ethernet communication module for CCR remote access. IDM 8000 CCR remote control on serial and TCP protocol.
Key Features
Indigenized remote control interface card suitable for MAFI system CCR equipment. Compatible for IDM8000 CCR. Backplane mounted serial and TCP/Ethernet communication module for CCR remote access. IDM 8000 CCR remote control on serial and TCP protocol.
• Remote control: Parallel or serial interface
• Compatible with MAFI CCR system
• Copatiable with IDM8000 CCR
• Compatible with Backplane mount serial communication.
• Compatible with commercial and Defence aviation CCR system.
• Remote control system for accessing CCR and allied system over serial or TCP.
• Indigenized local Support/presence in India.
Application
• Remote control: Parallel or serial interface.
• Compatible with MAFI CCR system.
• Compatible with IDM8000 CCR.
• Compatible with Backplane mount serial communication.
• Compatible with commercial and Defence aviation CCR system.
• Remote control system for accessing CCR and allied system over serial or TCP.
• Indigenized local Support/presence in India.
• Easy in configuration using DIP switches.
Explore the innovative world of trenchless pipe repair with our comprehensive guide, "The Benefits and Techniques of Trenchless Pipe Repair." This document delves into the modern methods of repairing underground pipes without the need for extensive excavation, highlighting the numerous advantages and the latest techniques used in the industry.
Learn about the cost savings, reduced environmental impact, and minimal disruption associated with trenchless technology. Discover detailed explanations of popular techniques such as pipe bursting, cured-in-place pipe (CIPP) lining, and directional drilling. Understand how these methods can be applied to various types of infrastructure, from residential plumbing to large-scale municipal systems.
Ideal for homeowners, contractors, engineers, and anyone interested in modern plumbing solutions, this guide provides valuable insights into why trenchless pipe repair is becoming the preferred choice for pipe rehabilitation. Stay informed about the latest advancements and best practices in the field.
Final project report on grocery store management system..pdfKamal Acharya
In today’s fast-changing business environment, it’s extremely important to be able to respond to client needs in the most effective and timely manner. If your customers wish to see your business online and have instant access to your products or services.
Online Grocery Store is an e-commerce website, which retails various grocery products. This project allows viewing various products available enables registered users to purchase desired products instantly using Paytm, UPI payment processor (Instant Pay) and also can place order by using Cash on Delivery (Pay Later) option. This project provides an easy access to Administrators and Managers to view orders placed using Pay Later and Instant Pay options.
In order to develop an e-commerce website, a number of Technologies must be studied and understood. These include multi-tiered architecture, server and client-side scripting techniques, implementation technologies, programming language (such as PHP, HTML, CSS, JavaScript) and MySQL relational databases. This is a project with the objective to develop a basic website where a consumer is provided with a shopping cart website and also to know about the technologies used to develop such a website.
This document will discuss each of the underlying technologies to create and implement an e- commerce website.
Student information management system project report ii.pdfKamal Acharya
Our project explains about the student management. This project mainly explains the various actions related to student details. This project shows some ease in adding, editing and deleting the student details. It also provides a less time consuming process for viewing, adding, editing and deleting the marks of the students.
1. International Journal of Humanities and Social Science Invention
ISSN (Online): 2319 – 7722, ISSN (Print): 2319 – 7714
www.ijhssi.org ||Volume 6 Issue 2||February. 2017 || PP.70-96
www.ijhssi.org 70 | Page
Effects in Buildings Due To Seismic Pounding
MA khaliq , Md quayyum,Mohammed Jalaluddin,
Assistant Professor, B-TECH (Civil Engineering), M.E
Department Of Civil Engineering, Jayaprakash Narayan College Of Engineering,
Mahabubnagar.Pin-509001 Contact- +91-9030956278
I. INTRODUCTION
1.1 General
Investigations of past and recent earthquake damage have illustrated that the building structures are
vulnerable to severe damage and/or collapse during moderate to strong ground motion. An earthquake with a
magnitude of six is capable of causing severe damages of engineered buildings, bridges, industrial and port
facilities as well as giving rise to great economic losses. Several destructive earthquakes have hit Egypt in both
historical and recent times from distant and near earthquakes. The annual energy release in Egypt and its
vicinity is equivalent to an earthquake with magnitude varying from 5.5 to 7.3. Pounding between closely
spaced building structures can be a serious hazard in seismically active areas. Investigations of past and recent
earthquakes damage have illustrated several instances of pounding damage (Astaneh-Asl et al.1994, Northridge
Reconnaissance Team 1996, Kasai& Maison 1991) in both building and bridge structures. Pounding damage
was observed during the 1985 Mexico earthquake, the 1988 Sequenay earthquake in Canada, the 1992 Cairo
earthquake, the 1994 Northridge earthquake, the 1995 Kobe earthquake and 1999 Kocaeli earthquake.
Significant pounding was observed at sites over 90 km from the epicenter thus indicating the possible
catastrophic damage that may occur during future earthquakes having closer epicenters. Pounding of adjacent
buildings could have worse damage as adjacent buildings with different dynamic characteristics which vibrate
out of phase and there is insufficient separation distance or energy dissipation system to accommodate the
relative motions of adjacent buildings. Past seismic codes did not give definite guidelines to preclude pounding,
because of this and due to economic considerations including maximum land usage requirements, especially in
the high density populated areas of cities, there are many buildings worldwide which are already built in contact
or extremely close to another that could suffer pounding damage in future earthquakes. A large separation is
controversial from both technical (difficulty in using expansion joint) and economical loss of land usage) views.
The highly congested building system in many metropolitan cities constitutes a major concern for eismic
pounding damage. For these reasons, it has been widely accepted that pounding is a desirable phenomenon that
should be prevented or mitigated zones in connection with the corresponding design ground acceleration values
will lead in many cases to earthquake actions which are remarkably higher than defined by the design codes
used up to now. The most simplest and effective way for pounding mitigation and reducing damage due to
pounding is to provide enough separation but it is sometimes difficult to be implemented due to detailing
problem and high cost of land. An alternative to the seismic separation gap provision in the structure design is to
minimize the effect of pounding through decreasing lateral motion (Kasaiet al. 1996, Abdullah et al. 2001,
Jankowski et al 2000, Ruangrassamee & Kawashima 2003,Kawashima & Shoji 2000), which can be achieved
by joining adjacent structures at critical locations so that their motion could be in-phase with one another or by
increasing the pounding buildings damping capacity by means of passive structural control of energy dissipation
system or by seismic retrofitting.
The focus of this study is the development of an analytical model and methodology for the formulation
of the adjacent building-pounding problem based on the classical impact theory, an investigation through
parametric study to identify the most important parameters is carried out. The main objective and scope are to
evaluate the effects of structural pounding on the global response of building structures; to determine the
minimum seismic gap between buildings and provide engineers with practical analytical tools for predicting
pounding response and damage. A realistic pounding model is used for studying the response of structural
system under the condition of structural pounding during elcentro earthquakes for medium soil condition at
seismic zone V. Two adjacent multi-story buildings are considered as a representative structure for potential
pounding problem. Dynamic and pushover analysis is carried out on the structures to observe displacement of
the buildings due to earthquake excitation. The behavior of the structures under static loads is linear and can be
predicted. When we come to the dynamic behaviors, we are mainly concerned with the displacements, velocity
and accelerations of the structure under the action of dynamic loads or earthquake loads. Unpredictability in
structural behaviors is encountered when the structure goes into the post-elastic or non-linear stage. The concept
of push over analysis can be utilized for estimating the dynamic needs imposed on a structure by earthquake
ground motions and the probable locations of the failure zones in a building can be ascertained by observing the
2. Effects in Buildings Due To Seismic Pounding
www.ijhssi.org 71 | Page
type of hinge formations. The strength capacity of the weak zones in the post-elastic range can then be increased
by retrofitting.
For the purpose of this study, SAP2000 has been chosen, a linear and non-linear static and dynamic
analysis and design program for three dimensional structures. The application has many features for solving a
wide range of problems from simple 2-D trusses to complex 3-D structures. Creation and modification of the
model, execution of the analysis, and checking and optimization of the design are all done through this single
interface. Graphical displays of the results, including real-time animations of time-history displacements, are
easily produced.
1.2 Seismic Pounding Effect between Buildings
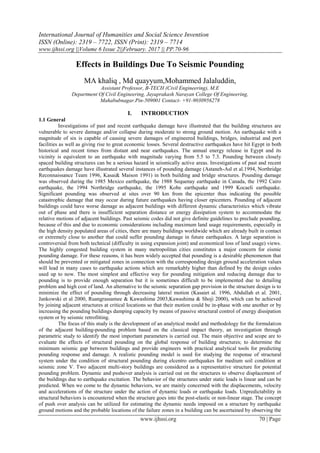
Pounding is one of the main causes of severe building damages in earthquake. The non-structural
damage involves pounding or movement across separation joints between adjacent structures. Seismic pounding
between two adjacent buildings occur
during an earthquake
different dynamic characteristics
adjacent buildings vibrate out of phase
at-rest separation is insufficient
Fig 1.1 Seismic Pounding between Adjacent Buildings.
A separation joint is the distance between two different building structures - often two wings of the same facility
- that allows the structures to move independently of one another.
A seismic gap is a separation joint provided to accommodate relative lateral movement during an
earthquake. In order to provide functional continuity between separate wings, building utilities must often
extend across these building separations, and architectural finishes must be detailed to terminate on either side.
The separation joint may be only an inch or two in older constructions or as much as a foot in some newer
buildings, depending on the expected horizontal movement, or seismic drift. Flashing, piping, fire sprinkler
lines, HVAC ducts, partitions, and flooring all have to be detailed to accommodate the seismic movement
expected at these locations when the two structures move closer together or further apart. Damage to items
crossing seismic gaps is a common type of earthquake damage. If the size of the gap is insufficient, pounding
between adjacent buildings may result in damage to structural components the buildings.
3. Effects in Buildings Due To Seismic Pounding
www.ijhssi.org 72 | Page
Fig 1.2 A diagram of a Roman house from the first century AD.
1.2.1 Required Seismic Separation Distance To Avoid Pounding
Seismic pounding occurs when the separation distance between adjacent buildings is not large enough
to accommodate the relative motion during earthquake events. Seismic codes and regulations worldwide specify
minimum separation distances to be provided between adjacent buildings, to preclude pounding, which is
obviously equal to the relative displacement demand of the two potentially colliding structural systems. For
instance, according to the 2000 edition of the International building code and in many seismic design codes and
regulations worldwide, minimum separation distances (Lopez Garcia 2004) are given by ABSolute sum (ABS)
or Square Root of Sum of Squares (SRSS) as follow:
S = Ua + U b ABS (1)
S = (Ua2 + U b2 ) SRSS (2)
where S = separation distance and Ua , U b = peak displacement response of adjacent structures A and B,
respectively.
Bureau Of Indian Standards clearly gives in its code IS 4326 that a Separation Section is to be provided
between buildings. Separation Section is defined as `A gap of specified width between adjacent buildings or
parts of the same building, either left uncovered or covered suitably to permit movement in order to avoid
hammering due to earthquake `. Further it states that ` For buildings of height greater than 40 meters, it will be
desirable to carry out model or dynamic analysis of the structures in order to compute the drift at each storey,
and the gap width between the adjoining structures shall not be less than the sum of their dynamic deflections at
any level.`
Thus it is advised to provide adequate gap between two buildings greater than the sum of the expected
bending of both the buildings at their top, so that they have enough space to vibrate. Separation of adjoining
structures or parts of the same structure is required for. Structures having different total heights or storey heights
and different dynamic characteristics. This is to avoid collision during an earthquake. Minimum width of
separation gaps as mentioned in 5.1.1 of IS 1893 : 1984, shall be as specified in Table 1.1 The design seismic
coefficient to be used shall be in accordance with IS 1893 : 1984
SL No. Type of Constructions Gap Width/Storey, n mm for
Design Seismic Coefficient �h =0.12
i). Box system or frames with shear walls 15.0
ii). Moment resistant reinforced concrete frame 20.0
iii). Moment resistant steel frame 30.0
Table 1.1: Minimum width of separation gaps as mentioned in 5.1.1 of IS 1893 : 1984
NOTE: Minimum total gap shall be 25 mm. For any other value of �h the gap width shall be determined
proportionately.
1.3 Methods of Seismic Analysis of a Structure
Various methods of differing complexity have been developed for the seismic analysis of structures. The three
main techniques currently used for this analysis are:
1. Dynamic analysis.
Linear Dynamic Analysis.
Non-Linear Dynamic Analysis.
4. Effects in Buildings Due To Seismic Pounding
www.ijhssi.org 73 | Page
2. Push over analysis.
1.3.1 Dynamic Analysis
All real physical structures, when subjected to loads or displacements, behave dynamically. The
additional inertia force from, Newton‘s second law, are equal to the mass times the acceleration. If the loads or
displacements are applied very slowly then the inertia forces can be neglected and a static load analysis can be
justified. Hence, dynamic analysis is a simple extension of static analysis.
The force equilibrium of a multi-degree-of-freedom lumped mass system as a function of time can be expressed
by the following relationship:
F(t)i + F (t)d + F (t)s=F (t) (1)
in which the force vectors at time t are
F(t)i is a vector of inertia forces acting on the node masses
F (t)d) is a vector of viscous damping, or energy dissipation, forces
F (t)s is a vector of internal forces carried by the structure
F (t) is a vector of externally applied loads
Equation (1) is based on physical laws and is valid for both linear and nonlinear systems if equilibrium is
formulated with respect to the deformed geometry of the structure.
For many structural systems, the approximation of linear structural behavior is made in order to convert the
physical equilibrium statement, Equation (1), to the following set of second-order, linear, differential equations:
M u.. (t)a + C u. (t)a + K u (t)a =F (t) (2)
in which M is the mass matrix (lumped or consistent C), is a viscous damping matrix (which is normally
selected to approximate energy dissipation in the real structure) and K is the static stiffness matrix for the
system of structural elements.
The time-dependent vectors u (t)a, u. (t)a) and u.. (t)a are the absolute node displacements, velocities
and accelerations, respectively.
For seismic loading, the external loading F(t) is equal to zero. The basic seismic motions are the three
components of free-field ground displacements (u(t)ig )that are known at some point below the foundation level
of the structure. Therefore, we can write Equation (12.2) in terms of the displacements u (t)a, velocities u. (t)a
and Accelerations u.. (t)a that are relative to the three components of free-field ground displacements. Therefore,
the absolute displacements, velocities and accelerations can be eliminated from Equation (2) by writing the
following simple equations:
u (t)a = u (t)a + Ix u (t)xg + I y u (t)yg + I z u (t)zg
u. (t)a = u. (t)a + Ix u. (t)a xg + I y u. (t)a yg + I z u. (t)a u (t)zg
u.. (t)a = u.. (t)a + Ix u.. (t)a xg + I y u.. (t)a yg + I z u.. (t)a u (t)zg
where Ii is a vector with ones in the ―i‖ directional degrees-of-freedom and zero in all other positions. The
substitution of Equation (3) into Equation (2) allows the node point equilibrium equations to be rewritten as
M u.. (t)a +C u. (t)a + K u (t)a =(- Mx u.. (t)a xg - Myu.. (t)a yg - Mz u.. (t)a zg )
The simplified form of Equation is possible since the rigid body velocities and displacements
associated with the base motions cause no additional damping or structural forces to be developed.
1.3.1.1 Response Spectrum Analysis
The response spectrum technique is really a simplified special case of modal analysis. The modes of
vibration are determined in period and shape in the usual way and the maximum response magnitudes
corresponding to each mode are found by reference to a response spectrum. The response spectrum method has
the great virtues of speed and cheapness. The basic mode superposition method, which is restricted to linearly
elastic analysis, produces the complete time history response of joint displacements and member forces due to a
specific ground motion loading [1,2]. There are two major disadvantages of using this approach. First, the
5. Effects in Buildings Due To Seismic Pounding
www.ijhssi.org 74 | Page
method produces a large amount of output information that can require an enormous amount of computational
effort to conduct all possible design checks as a function of time. Second, the analysis must be repeated for
several different earthquake motions in order to assure that all the significant modes are excited, since a
response spectrum for one earthquake, in a specified direction, is not a smooth function.
There are significant computational advantages in using the response spectra method of seismic
analysis for prediction of displacements and member forces in structural systems. The method involves the
calculation of only the maximum values of the displacements and member forces in each mode using smooth
design spectra that are the average of several earthquake motions. In this analysis, the CQC method to combine
these maximum modal response values to obtain the most probable peak value of displacement or force is used.
In addition, it will be shown that the SRSS and CQC3 methods of combining results from orthogonal earthquake
motions will allow one dynamic analysis to produce design forces for all members of the structure.
1.3.2 Nonlinear Dynamic Analysis
Nonlinear Dynamic analysis can be done by direct integration of the equations of motion by step by
step procedures. Direct integration provides the most powerful and informative analysis for any given
earthquake motion. A time dependent forcing function (earthquake accelerogram) is applied and the
corresponding response–history of the structure during the earthquake is computed. That is, the moment and
force diagrams at each of a series of prescribed intervals throughout the applied motion can be found. Computer
programs have been written for both linear elastic and non-linear inelastic material behavior using step-by-step
integration procedures. One such program is SAP2000 in which three–dimensional non-linear analyses can be
carried out taking as input the three orthogonal accelerogram components from a given earthquake, and
applying them simultaneously to the structure.
1.3.3 Push over Analysis
The non-linear static procedure or simply push over analysis is a simple option for estimating the
strength capacity in the post-elastic range. This procedure involves applying a predefined lateral load pattern
which is distributed along the building height. The lateral forces are then monotonically increased in constant
proportion with a displacement control node of the building until a certain level of deformation is reached. The
applied base shear and the associated lateral displacement at each load increment are plotted. Based on the
capacity curve, a target displacement which is an estimate of the displacement that the design earthquake will
produce on the building is determined. The extent of damage experienced by the building at this target
displacement is considered representative of the damage experienced by the building when subjected to design
level ground shaking
The most frequently used terms in pushover analysis as given in ATC-40 are:
1.3.3.1 Capacity �curve
It is the plot of the lateral force V on a structure, against the lateral deflection d, of the roof of the
structure. This is often referred to as the ‗push over‘ curve. Performance point and location of hinges in various
stages can be obtained from pushover curves as shown in the fig. The range AB is elastic range, B to IO is the
range of immediate occupancy IO to LS is the range of life safety and LS to CP is the range of collapse
prevention.
Fig 1.3 Different stages of plastic hinge
1.3.3.2 Capacity-spectrum
It is the capacity curve transformed from shear force vs. roof displacement (V vs. d) coordinates into spectral
acceleration vs. spectral displacement (Sa vs. Sd) coordinates.
6. Effects in Buildings Due To Seismic Pounding
www.ijhssi.org 75 | Page
1.3.3.3 Demand
It is a representation of the earthquake ground motion or shaking that the building is subjected to. In
nonlinear static analysis procedures, demand is represented by an estimation of the displacements or
deformations that the structure is expected to undergo. This is in contrast to conventional, linear elastic analysis
procedures in which demand is represented by prescribed lateral forces applied to the structure.
1.3.3.4 Demand - Spectrum
It is the reduced response spectrum used to represent the earthquake ground motion in the capacity spectrum
method.
1.3.3.5 Displacement-based analysis
It refers to analysis procedures, such as the non linear static analysis procedures, whose basis lies in
estimating the realistic, and generally inelastic, lateral displacements or deformations expected due to actual
earthquake ground motion. Component forces are then determined based on the deformations.
1.3.3.6 Elastic response spectrum
It is the 5% damped response spectrum for the (each) seismic hazard level of interest, representing the
maximum response of the structure, in terms of spectral acceleration Sa, at any time during an earthquake as a
function of period of vibration T.
1.3.3.7 Performance level
A limiting damage state or condition described by the physical damage within the building, the threat
to life safety of the building‘s occupants due to the damage, and the post earthquake serviceability of the
building. A building performance level is that combination of a structural performance level and a nonstructural
performance level
1.3.3.8 Performance point
The intersection of the capacity spectrum with the appropriate demand spectrum in the capacity
spectrum method (the displacement at the performance at the performance point is equivalent to the target
displacement in the coefficient method). To have desired performance, every structure has to be designed for
this level of forces. Desired performance with different damping ratios have been shown below:
1.3.3.9 Yield (effective yield) point
The point along the capacity spectrum where the ultimate capacity is reached and the initial linear elastic force-
deformation relationship ends and effective stiffness begins to decrease.
7. Effects in Buildings Due To Seismic Pounding
www.ijhssi.org 76 | Page
1.3.3.10 Building Performance levels
A performance level describes a limiting damage condition which may be considered satisfactory for a
given building and a given ground motion. The limiting condition is described by the physical damage within
the building, the threat to life safety of the building‘s occupants created by the damage, and the post earthquake
serviceability of the building.
1.3.3.10.1 Immediate occupancy
The earthquake damage state in which only very limited structural damage has occurred. The basic
vertical and lateral forces resisting systems of the building retain nearly all of their pre- earthquake
characteristics and capacities. The risk of life threatening injury from structural failure is negligible.
1.3.3.10.2 Life safety
The post-earthquake damage state in which significant damage to the structure may have occurred but
in which some margin against either total or partial collapse remains. Major structural components have not
become dislodged and fallen, threatening life safety either within or outside the building. While injuries during
the earthquake may occur, the risk of life threatening injury from structural damage is very low. It should be
expected that extensive structural repairs will likely be necessary prior to reoccupation of the building, although
the damage may not always be economically repairable.
1.3.3.10 Collapse prevention level
This building performance level consists of the structural collapse prevention level with no consideration of
nonstructural vulnerabilities, except that parapets and heavy appendages are rehabilitated.
1.3.3.11 Primary elements
Refer to those structural components or elements that provide a significant portion of the structure‘s
lateral force resisting stiffness and strength at the performance point. These are the elements that are needed to
resist lateral loads after several cycles of inelastic response to the earthquake ground motion.
1.3.3.12 Secondary elements
Refer to those structural components or elements that are not, or are not needed to be, primary elements
of the lateral load resisting system. However, secondary elements may be needed to support vertical gravity
loads and may resist some lateral loads.
1.4 Objectives of Study
This Thesis aims at computing the minimum seismic gap between buildings for rigid floor diaphragm
idealizations by dynamic and pushover analysis using SAP2000 Nonlinear. The principal objectives of the study
are as follows:
1. Generation of three dimensional models of buildings for rigid floor diaphragm idealization to analyze
dynamic and pushover analysis using SAP2000 Nonlinear
2. Performing linear and non-linear dynamic analysis of rigid floor diaphragm idealization for medium soil at
Zone V.
3. Analyzing the displacement of buildings for Four Storey (G+4) and Eight Storey(G+8) building cases to
permit movement, in order to avoid pounding due to earthquake by Linear and Non-linear Dynamic
Analysis.
4. Performing Pushover analysis for rigid floor diaphragm idealization for three lateral load pattern on the
models.
5. Comparison of pushover curves and capacity spectrums of rigid floor diaphragm idealizations for pushover
analyses.
6. Comparison of displacement profiles for frames at different locations for rigid floor diaphragm idealization.
1.5 Organization of Thesis
The thesis is reported in five chapters. Chapter 1 aims at giving a glimpse of general concepts and
objectives of the present study. Chapter 2 presents the available literature. Chapter 3 gives the details of the
model under study, modeling aspects considered and discusses the procedure for rigid floor idealizations of
buildings using dynamic and pushover analyses. Chapter 4 presents the results of rigid floor diaphragm
idealizations for dynamic and pushover analysis. Chapter 5 outlines the conclusions and scope for future work
8. Effects in Buildings Due To Seismic Pounding
www.ijhssi.org 77 | Page
II. REVIEW OF LITERATURE
2.1 General
A series of integrated analytical and experimental studies has been conducted to investigate the seismic
gap between adjacent buildings located in regions of high seismic risk. When a building experiences earthquake
vibrations its foundation will move back and forth with the ground. These vibrations can be quite intense,
creating stresses and deformation throughout the structure making the upper edges of the building swing from a
few mm to many inches dependent on their height size and mass. This is uniformly applicable for buildings of
all heights, whether single storeyed or multi-storeyed in highrisk earthquake zones. In Mexico earthquake it was
observed that buildings of different sizes and heights vibrated with different frequencies. Where these were
made next to each other they created stresses in both the structures and thus weakened each other and in many
cases caused the failure of both the structures. Pounding produces acceleration and shear at various story levels
that are greater than those obtained from the no pounding case. Pounding between closely spaced building
structures can be a serious hazard in seismically active areas. Also, increasing gap width is likely to be effective
when the separation is sufficiently wide practically to eliminate contact.
After a brief evaluation of methods currently standard in engineering practice to estimate seismic gap
between buildings, nonlinearities in the structure are to be considered when the structure enters into inelastic
range during devastating earthquakes. To consider this nonlinearity effects inelastic time history analysis is a
powerful tool for the study of structural seismic performance. A set of carefully selected ground motion records
can give an accurate evaluation of the anticipated seismic performance of structures. Despite the fact that the
accuracy and efficiency of the computational tools have increased substantially, there are still some reservations
about the dynamic inelastic analysis, which are mainly related to its complexity and suitability for practical
design applications. Moreover, the calculated inelastic dynamic response is quite sensitive to the characteristics
of the input motions, thus the selection of a suite of representative acceleration time-histories is mandatory. This
increases the computational effort significantly. Nonlinear static procedures are enlightened due to their
simplicity and, its accuracy is towards time history analysis.
Viviane Warnotte summarized basic concepts on which the seismic pounding effect occurs between adjacent
buildings. He identified the conditions under which the seismic pounding will occur between buildings and
adequate information and, perhaps more importantly, pounding situation analyzed. From his research it was
found that an elastic model cannot predict correctly the behaviors of the structure due to seismic pounding.
Therefore non-elastic analysis is to be done to predict the required seismic gap between buildings.
Robert Jankowski addressed the fundamental questions concerning the application of the nonlinear analysis
and its feasibility and limitations in predicting seismic pounding gap between buildings. In his analysis,
elastoplastic multi-degree-offreedom lumped mass models are used to simulate the structural behavior and non-
linear viscoelastic impact elements are applied to model collisions. The results of the study prove that pounding
may have considerable influence on behavior of the structures.
Shehata E. Abdel Raheem developed and implemented a tool for the inelastic analysis of seismic pounding
effect between buildings. They carried out a parametric study on buildings pounding response as well as proper
seismic hazard mitigation practice for adjacent buildings. Three categories of recorded earthquake excitation
were used for input. He studied the effect of impact using linear and nonlinear contact force model for different
separation distances and compared with nominal model without pounding consideration.
ANAGNOSTOPOULOS SA, SPILIOPOULOS KV studied the earthquake induced pounding between
adjacent buildings. They idealized the building as lumped-mass, shear beam type, multi-degree-of-freedom
(MDOF) systems with bilinear forcedeformation characteristics and with bases supported on translational and
rocking springdashpots. Collisions between adjacent masses can occur at any level and are simulated by means
of viscoelastic impact elements. They used five real earthquake motions to study the effects of the following
factors: building configuration and relative size, seismic separation distance and impact element properties. It
was found that pounding can cause high overstresses, mainly when the colliding buildings have significantly
different heights, periods or masses. They suggests a possibility for introducing a set of conditions into the
codes, combined with some special measures, as an alternative to the seismic separation requirement.
Hasan et al. [17] presented a simple computer based pushover analysis technique for performance
based design of building frameworks subject to earthquake loading. The concept is based on conventional
displacement method of elastic analysis. To measure the degree of plastification the term plasticity factor was
used. The standard elastic and geometric stiffness matrices for frame elements are progressively modified to
9. Effects in Buildings Due To Seismic Pounding
www.ijhssi.org 78 | Page
account for non-linear elastic-plastic behavior under constant gravity loads and incrementally increasing lateral
loads.
Korkmaz and Sari [24] studied the performance of structures for various load patterns and variety of
natural periods by performing pushover and nonlinear dynamic time history analysis and concluded that for
taller structures pushover analysis is underestimating seismic demands.
ATC-40 Vol. 1, 2 [1] provides step by step procedures for seismic evaluation of new and existing RC buildings
using nonlinear static procedures.
FEMA-273 [13] provides guidelines for seismic rehabilitation of buildings (both new and existing).
FEMA-274 [14] gives commentary for FEMA-273.
FEMA-356 [15] provides guidelines for seismic rehabilitation of buildings
2.2 Outcomes of Literature Review
From the available literature it was observed that most of the studies are confined on study of 2D
frames and simple 3D structures with one story and one bay. The relative areas in which the dynamic and
pushover analysis can be applied were discussed. Only a limited number of published works on comparison of
use of dynamic and pushover analysis to find out the seismic gap between buildings.
Thus, after reviewing the existing literature it was felt that a comparative study on seismic pounding effect on
buildings by dynamic and pushover analysis is required.
III. STRUCTURAL MODELING AND ANALYSIS
3.1 General
In order to evaluate the Seismic gap between buildings with rigid floor diaphragms using dynamic and pushover
procedures two sample building was adopted The details of the building are reproduced in section 3.2.
The finite element analysis software SAP2000 Nonlinear [31] is utilized to create 3D model and run all
analyses. The software is able to predict the geometric nonlinear behavior of space frames under static or
dynamic loadings, taking into account both geometric nonlinearity and material inelasticity. The software
accepts static loads (either forces or displacements) as well as dynamic (accelerations) actions and has the
ability to perform eigenvalues, nonlinear static pushover and nonlinear dynamic analyses.
3.2 Details of the Models
The models which have been adopted for study are asymmetric four storey(G+4) and eight storey
(G+8) buildings. The buildings are consist of square columns with dimension 500mm x 500mm, all beams with
dimension 350mm x 250mm. The floor slabs are taken as 125mm thick. The foundation height is 1.5m and the
height of the all four stories is 3m. The modulus of elasticity and shear modulus of concrete have been taken as
E = 2.55 ×10⁷ kN/m2 and G = 1.06 ×10⁷ kN/m2.
Three models have been considered for the purpose of the study.
1. Four storey(G+4) adjacent building with equal floor levels.
2 Eight storey(G+8) adjacent buildings with Unequal floor levels.
11. Effects in Buildings Due To Seismic Pounding
www.ijhssi.org 80 | Page
3.2.1 Defining the material properties, structural components and modeling the structure:
Beam, column and slab specifications are as follows:
Column 500mm x 500mm
Beam 350mm x 250mm
Slab thickness 125mm
Reinforcement
Columns 8-25 mm bars
Beams 4-20 mm bars at both top and bottom
The required material properties like mass, weight density, modulus of elasticity, shear modulus and design
values of the material used can be modified as per requirements or default values can be accepted.
Beams and column members have been defined as ‗frame elements‘ with the appropriate dimensions and
reinforcement.
Soil structure interaction has not been considered and the columns have been restrained in all six degrees of
freedom at the base.
Slabs are defined as area elements having the properties of shell elements with the required thickness. Slabs
have been modeled as rigid diaphragms.
12. Effects in Buildings Due To Seismic Pounding
www.ijhssi.org 81 | Page
3.2.2 Assigning loads.
After having modeled the structural components, all possible load cases are assigned. These are as follows:
3.2.2.1 Gravity loads
Gravity loads on the structure include the self weight of beams, columns, slabs, walls and other
permanent members. The self weight of beams and columns (frame members) and slabs (area sections) is
automatically considered by the program itself. The wall loads have been calculated and assigned as uniformly
distributed loads on the beams.
Wall load = unit weight of brickwork x thickness of wall x height of wall.
Unit weight of brickwork = 20KN/m3
Thickness of wall = 0.125m
Wall load on roof level =20 x 0.125 x 1=2.50KN/m (parapet wall height = 1m)
Wall load on all other levels = 20 x 0.125 x 3 = 7.50KN/m (wall height = 3m)
Live loads have been assigned as uniform area loads on the slab elements as per IS 1893(Part 1) 2002
Live load on roof 2 KN/m2
Live load on all other floors 3.0 KN/m2
As per Table 8, Percentage of Imposed load to be considered in Seismic weight calculation, IS 1893 (Part 1)
2002, since the live load class is up to 3 KN/m2 , 25% of the imposed load has been considered.
Quake loads have been defined considering the response spectra for medium soil as per IS 1893 (Part 1) 2002.
3.2.2.1.1 Defining load combinations:
According to IS 1893 (Part 1) 2002 for the limit state design of reinforced and prestressed concrete structures,
the following load combinations have been defined
13. Effects in Buildings Due To Seismic Pounding
www.ijhssi.org 82 | Page
1.5(DL+LL) DL- Dead Load
1.2(DL+LL+EL) LL- Live load
1.2(DL+LL-EL) EL- Earthquake load.
1.5(DL+EL)
1.5(DL-EL)
0.9DL+1.5EL
0.9DL-1.5EL
3.2.2.2 Earthquake lateral loads
The design lateral loads at different floor levels have been calculated corresponding to fundamental
time period and are applied to the model. The method of application of this lateral load varies for rigid floor and
flexible floor diaphragms. In rigid floor idealization the lateral load at different floor levels are applied at centre
of rigidity of that corresponding floor in the direction of push in order to neglect the effect of torsion.
While idealizing the floor diaphragms as flexible, the design lateral load at all floors is applied such
that the lateral load at each floor is distributed along the length of the floor in proportion to the mass
distribution.
In our case, the slabs have been modeled as rigid diaphragms and in this connection, the centre of rigidity at
each floor level has been determined and the earthquake lateral loads have been applied there.
Fig. 3.4 Lateral loads for rigid floor diaphragm
3.2.3 ANALYSIS OF THE STRUCTURE
Namely three types of analysis procedures have been carried out for determining the various structural
parameters of the model. Here we are mainly concerned with the behavior of the structure under the effect of
ground motion and dynamic excitations such as earthquakes and the displacement of the structure in the
inelastic range.
The analyses carried out are as follows:
Response Spectrum Analysis
Time History Analysis.
Pushover analysis.
3.2.3.1 Response Spectrum Analysis
Here we are primarily concerned with observing the deformations, forces and moments induced in the
structure due to dead, live loads and earthquake loads. The load case ‗Dead‘ takes care of the self weight of the
frame members and the area sections. The wall loads have been defined under a separate load case ‗Wall‘ and
the live loads under the case ‗Live‘. Analysis is carried out for all three cases for obtaining the above mentioned
parameters.
14. Effects in Buildings Due To Seismic Pounding
www.ijhssi.org 83 | Page
Modal analysis is carried out for obtaining the natural frequencies, modal mass participation ratios and other
modal parameters of the structure. Response spectrum analysis of the three models are done in the zone V where
Z = 0.36 considering zone factor v
I = 1.0 considering residential building.
R = 5.0 considering special RC moment resistant frame (SMRF)
Sa/g = 2.5
For the Seismic pounding effect between adjacent buildings, response spectrum analysis is carried out using the
spectra for medium soil as per IS 1893 (Part 1) 2002.
The spectral acceleration coefficient (Sa/g) values are calculated as follows.
For medium soil sites,
Sa/g = 1 + 15T, (0.00 �T �0.10), (T= time period in seconds)
= 2.50, (0.10 �T �0.55)
= 1.36/T, (0.55 �T �4.00)
The values of the spectral acceleration coefficient (Sa/g) for the time periods of 0.00 to 4.00 seconds calculated
as per the above equations and the plot of spectral acceleration coefficient (Sa/g) Vs. Period are as shown.
16. Effects in Buildings Due To Seismic Pounding
www.ijhssi.org 85 | Page
3.2.3.1.1 Response spectrum analysis in SAP 2000
The step by step procedure is as follows
Defining quake loads under the load type ‗quake‘ and naming it appropriately.
Defining response spectrum function as per IS 1893 (Part 1) 2002. The values of Sa/g Vs. T shown in Table
3.1 can be linked in the program in the form of a data file.
Modifying the quake analysis case with the appropriate analysis case type, applied loads and scale factors.
Running the analysis.
17. Effects in Buildings Due To Seismic Pounding
www.ijhssi.org 86 | Page
3.2.3.2 Time History Analysis of the structure
Time Hisotrey analysis has been carried out using the Imperial Valley Earthquake record of May 18,
1940 also known as the Elcentro earthquake for obtaining the various floor responses. The record has 1559 data
points with a sampling period of 0.02 seconds. The peak ground acceleration is 0.319g. Newmark‘s direct
integration method has been adopted and the mass and stiffness proportional coefficients have been calculated
taking into account the frequency of the structure in two consecutive modes in the same direction.
3.2.3.2.1 Time history analysis in SAP 2000
The step by step procedure is as follows
Defining a time history function by adding a function from file. In our case, the Elcentro earthquake record
of 1940 has been linked to the program.
Defining a separate analysis case under the load type ‗quake‘ with the appropriate analysis case type i.e.
linear direct integration time history.
Applying earthquake acceleration values from the defined time history function.
Specifying the damping coefficients by calculating the mass and stiffness proportional coefficients as per
the equations mentioned above or inputting the frequency or time periods of two consecutive modes of the
structure in the same direction whereby the program itself calculates the required damping coefficients.
Specifying a direct integration method in the program. In our case, we have adopted Newmark‘s direct
integration method.
Running the analysis.
3.3.3.3 Push over analysis
18. Effects in Buildings Due To Seismic Pounding
www.ijhssi.org 87 | Page
Push over analysis is a static, non-linear procedure that can be used to estimate the dynamic needs
imposed on a structure by earthquake ground motions. In this procedure a predefined lateral load pattern is
distributed along the building height. The lateral forces are then monotonically increased in constant proportion
with a displacement control at the control node of the building until a certain level of deformation is reached.
For this analysis nonlinear plastic hinges have been assigned to all of the primary elements. Default
moment hinges (M3-hinges) have been assigned to beam elements and default axial-moment 2-moment3 hinges
(PMM-hinges) have been assigned to column elements. The floors have been assigned as rigid diaphragms by
assigning diaphragm constraint.
3.3.4.3.1 Lateral load calculations
From Modal analysis fundamental time period of the structure have been found to be in mode 1—
0.550391 sec and in mode 2—0.5034076 sec.The base shear has been calculated by running the response
spectrum analysis. The lateral loads for rigid floor diaphragms have been calculated using parabolic lateral load
patterns as adopted from IS 1893(part1)2002Para], triangular and uniform lateral load patterns from ATC-40
[1].
3.3.4.3.2 Seismic Weight of the Building
The Seismic Weight of the whole building is the sum of the seismic weights of all the floors. The
seismic weight of each floor is its full dead load plus appropriate amount of imposed load. While computing the
seismic weight of each floor, the weight of columns and walls in any storey shall be equally distributed to the
floors above and below the storey.
floor height from ground level in m Seismic weight Wi in KN
13.5 2636.0
10.5 2636.0
7.5 2636.0
4.5 1600.5
Table 3.2 Seismic weight of the Four Storey Building
Total Seismic weight of the Model 1 Building W=9508.5 KN
floor height from ground level in m Seismic weight Wi in KN
25.5 2636.0
22.5 2636.0
19.5 2636.0
16.5 2636.0
13.5 2636.0
10.5 2636.0
7.5 2636.0
4.5 1600.5
Table 3.3 Seismic weight of the Model 2Building
Total Seismic weight of the Model 2 Building W=20,052.5 KN
3.3.4.3.3 Base shear calculations
The total design lateral force or design Seismic base shear (Vb) have been obtained from SAP2000 using
Response Spectrum Analysis as per IS1893 (part 1)- 2002[19].
The response spectrum ordinates used are for type (medium soil) for 5%damping and for seismic zone-v. The
design seismic base shear (Vb) has been calculated using procedure given in IS 1893(part 1)-2002 as follows.
Vb =Ah W
Where Ah is the design horizontal seismic coefficient and is given by
ZI {Sa / g}
Ah
=
2R
19. Effects in Buildings Due To Seismic Pounding
www.ijhssi.org 88 | Page
Where Z = Zone factor given in table 2 of IS 1893-2002
I = Importance factor given in table 6 of IS 1893-2002
R = Response reduction factor given in table 7 of IS 1893-2002
Sa/g =Average response acceleration coefficient.
CALCULATION
For Four Storey Building
As per clause 7.1 of IS 1893(part 1) 2002 the fundamental time period of vibration (Ta) is
Ta = .075h0.75 Where h = height of the building
Ta =0.075x12.75
=0 .484 sec
From the response spectrum graph (fig 3.8), Average response acceleration coefficient
(Sa/g) is found to be 2.5
ZI {Sa / g}
Ah
=
2R
.36x1.0x2.5
=
2x5.0
= 0.09
Here Z = 0.36 considering zone factor v
I = 1.0 considering residential building.
R = 5.0 considering special RC moment resistant frame (SMRF)
Sa/g = 2.5
The design base shear in x-direction have been calculated using code provisions is
Vb =Ah W
=0.09x9508.5
=855.765 KN
For Eight Storey Building
As per clause 7.1 of IS 1893(part 1) 2002 the fundamental time period of vibration (Ta) is
Ta = .075h0.75 Where h = height of the building
Ta =0.075x24.75
=0 .8132 sec
From the response spectrum graph (fig 3.8), Average response acceleration coefficient (Sa/g) is found to be 1.65
ZI {Sa / g}
Ah
=
2R
.36x1.0x1.65
=
2x5.0
= 0.059706
Here Z = 0.36 considering zone factor v
I = 1.0 considering residential building.
R = 5.0 considering special RC moment resistant frame (SMRF)
Sa/g = 1.65
The design base shear in x-direction have been calculated using code provisions is
Vb =Ah W
20. Effects in Buildings Due To Seismic Pounding
www.ijhssi.org 89 | Page
=0.059706x20,052.5
=1,197254 KN
3.3.4.3.4 Lateral load profiles
IS 1893 (Part 1) 2002 parabolic lateral load (PLL) at floor ‗i‘ is given by--
Wi h i
2
Qpi=Vb n
�Wj hj 2
j=1
Triangular lateral load (TLL) at floor ‗i‘ is given by
Wi h i
Qpi=Vb n
�Wj hj
j=1
Uniform lateral load (ULL) at floor ‗i‘ is given by
Wi
Qpi=Vb n
�Wj
j=1
where Q= lateral loads as per IS: 1893-2002 and ATC-40 at each floor level
W = total seismic weight the structure
W= seismic weight of floor i
h= height of floor measured from base
n = is the number of levels at which the masses are lumped.
Lateral force calculations in each storey
Vertical distribution of lateral forces as per IS 1893-2002 presented in table 3.4
Vertical distribution of lateral forces as per IS: 1893-2002 and ATC-40 are presented in
Table 3.4-3.5.
3.3.4.3.5 Push over analysis in SAP2000
21. Effects in Buildings Due To Seismic Pounding
www.ijhssi.org 90 | Page
The step by step procedure for buildings with rigid floor diaphragm is as follows:
A three dimensional computer model was generated.
Linear static, modal and response spectrum analysis were performed for specified response spectrum.
The base shear from response spectrum analysis is used for calculating the design lateral loads.
Centers of rigidity at various floor levels are calculated and are applied to the model.
The calculated lateral load is distributed along the height of the building.
The lateral loads at different floor levels are applied at centre of rigidity of the respective floor level.
The rigid floor condition is given to the floors at different levels.
The primary elements are identified and plastic hinges are assigned. The beam elements are assigned with
plastic hinge as given in ATC-40 and FEMA – 273, 356. The beam elements are assigned with moment
(M3) hinges and the column elements are assigned with axial load, moment in 2 and 3 – directions (PMM)
hinges.
Pushover analysis cases are then defined. The first case is for dead and live loads starting from zero initial
conditions (unstressed state). The second case is defined for the calculated lateral loads and starts from the
end conditions of the previous state. Non-linear parameters are defined as per requirements or default
values are accepted.
Analysis is then run and pushover curves are obtained.
For the model with bracings, default axial hinges are defined in the bracings keeping the other parameters
same and push over analysis is carried out.
3.3.4.3.6 Pushover Cases
Gravity and lateral push cases are considered for analysis. A set of lateral loads PUSH_IS, PUSH_TRI, and
PUSH_UNI are given in Table 5.1 as per IS: 1893-2002, ATC – 40 and FEMA – 356 and are applied at
corresponding floor levels.
3.3.4.3.7 Load Combinations for Pushover Analysis
Pushover analysis has been performed for lateral pushes in two orthogonal directions for parabolic load pattern
as per IS: 1893-2002 and FEMA-356 along the height of the building. Lateral load combinations for different
load cases are shown in Table 5.1.
IV. RESULTS AND DISCUSSION
4.1 General
SAP2000 is used to compute the response of a four (G+4) and eight storey (G+8) buildings for rigid floor
diaphragm Linear Dynamic (response spectrum), Non Linear Dynamic (time history) and push over analysis.
Results from Response Spectrum analysis are observed for the natural frequencies and modal mass
participation ratios and Displacements of the joints to determine the seismic pounding gap between adjacent
structures of two models.
Results from time history analysis have been used to observe and compare the floor responses of all the
two models. Pushover curves and capacity spectrum curves results have been used to observe and compare the
displacement of the buildings in the performance point for three different lateral load patterns.
4.2. Response spectrum analysis
Response spectrum analysis has been carried out as per the response spectra mentioned in IS 1893(part1) 2002.
The displacements for a particular joint at the top floor for two models have been tabulated as below
4.2.1 Analysis of Four storey buildings (G+4)
22. Effects in Buildings Due To Seismic Pounding
www.ijhssi.org 91 | Page
4.2.2 Analysis of Eight storey buildings (G+8)
Conclusion
Response spectrum result for pounding case is observed. From the above result it have been seen that
considering equal floor levels between adjacent buildings the maximum displacement is for Four storey
buildings (G+4) is 0.046m against the 0.08m seismic gap between the adjacent buildings provided as per IS
4326-2005 and for Eight storey buildings (G+8) is 0.096 which is much less then the seismic gap provided
between the adjacent buildings as per IS 4326-2005.
4.3 Time History Analysis
23. Effects in Buildings Due To Seismic Pounding
www.ijhssi.org 92 | Page
Time history analysis has been carried out using the Imperial Valley Earthquake record of May 18, 1940 also
known as the Elcentro earthquake for obtaining the various floor responses.
4.3.1 Analysis of Four storey building (G+4)
Peak roof displacement of four storey building as obtained from time history analysis in SAP2000 is 0.009437m
4.3.2 Analysis of Eight storey building (G+8)
Peak roof displacement of eight storey building as obtained from time history analysis in SAP2000 is
0.009947m
Conclusion
From the above records, it can be observed that all the three models have exhibited amplified responses for the
top floor. The eight storey building has exhibited maximum response between the two models.
4.4 Pushover Analysis
Pushover analysis of an asymmetric building with rigid floor idealization for three different lateral load
patterns; parabolic, triangular and uniform is carried out. All the analyses are performed for different nonlinear
cases and the results namely; pushover curves, capacity spectrums, displacement are compared.
4.4.1 Pushover curves for four storey building
24. Effects in Buildings Due To Seismic Pounding
www.ijhssi.org 93 | Page
Pushover curve is a plot of base shear vs. roof displacement (V vs. D). It is also known as capacity
curve. This curve gives idea about the base shear induced in the structure at performance point. The pushover
curves for different lateral load cases for rigid floor idealization for four storey buildings are plotted and are
shown in Figs. 4.4– 4.6
4.4.3 Comparison of pushover curves
Fig. 4.10-4.11 shows the comparison of pushover curves for different lateral load distributions based on
rigid floor diaphragm assumption. It is observed that the pushover curve is influenced by lateral load pattern.
Fig. 4.11 Pushover curves of rigid floor diaphragm for different lateral load patterns of eight storey building.
25. Effects in Buildings Due To Seismic Pounding
www.ijhssi.org 94 | Page
It is observed that for any base shear, the displacement using rigid floor diaphragm idealization for parabolic
load pattern more than that triangular and uniform lateral load pattern.
4.4.4 Capacity spectrum
Capacity spectrum is the capacity curve transformed from base shear vs. roof displacement coordinates
into spectral acceleration vs. spectral displacement (Sa vs. Sd ) co-ordinates. The performance point is obtained
by superimposing demand spectrum on capacity curve transformed into spectral coordinates. To have desired
performance, every structure has to be designed for the spectral acceleration corresponding to the performance
point.
The capacity spectrum for four storey building is shown in fig 4.12-4.14
26. Effects in Buildings Due To Seismic Pounding
www.ijhssi.org 95 | Page
From Table 4.3 it is evident that for rigid floor diaphragm idealization the base shear, displacement, spectral
acceleration and spectral displacement at performance point are governed by the lateral load profile. For
parabolic load pattern displacement is greater than triangular load pattern which has again larger displacement
than uniform load pattern.
The capacity spectrum for eight storey building are shown in fig 4.15-4.17
27. Effects in Buildings Due To Seismic Pounding
www.ijhssi.org 96 | Page
From the table 4.4 it is shown that displacement due to parabolic load pattern is maximum as compared to other
load pattern. At the performance point the maximum displacement is found to be 0.188m for parabolic load
pattern.
Base shear is an estimate of the maximum expected lateral force that will occur due to seismic ground motion at
the base of a structure. Base reaction is greater in uniform load pattern. Therefore the displacement at the
performance point of the buildings is minimum among the three lateral load patterns. From the analysis results,
it is observable that the model 1 with four storey building has a maximum displacement is 0.095 and for model
2 with eight storey building has a maximum displacement is 0.188m at the performance point.
V. CONCLUSION
The purpose of this study has been to analyze seismic pounding effects between buildings and to
observe the structural behaviour in the post elastic range. For this, SAP2000, a linear and non-linear static and
dynamic analysis and design program for three dimensional structures has been used. Dynamic analysis has
been carried out to know about the deformations, natural frequencies, and time periods, floor responses
displacements. The non-linear static procedure or simply push over analysis is carried out to estimate the
displacement at the performance point of the structure in the post-elastic range. The models that have been
studied are 1. Four storey (G+4) building 2. Eight storey (G+8) buildings of which have been created in
SAP2000.
The first phase of the study involves the creation and analysis of the model and Linear dynamic
analysis(Response Spectrum Analysis) for medium soil condition has been carried out on those models to
observe displacement at the joint of the structure. Depending upon the analysis results, modification of the same
for the purpose of no pounding is carried out on those models. Based on the observations from the analysis
results, the following conclusions can be drawn. Response Spectrum analysis gives result that the two models
have displacement within the permissible limit for seismic pounding between adjacent buildings with the
seismic gap provided as per IS 4326-2005. It was found that minimum seismic gap can be provide 0.012m per
storey between two four storey building and two eight storey building for no seismic pounding between
buildings.
In the second phase of the project Nonlinear dynamic analysis with Elcentro earthquake excitation data
as input is carried out on those models to observe the behaviour of the structure under earthquake excitation.
The floor responses due to earthquake excitation in the Eight storey building is higher than the Four Storey
building.
In pushover analysis three different lateral load patterns are used; parabolic, triangular and uniform.
Based on the results obtained from these analyses, the following conclusions are drawn for the buildings under
study. From the pushover curves obtained for three lateral load pattern shows displacement of the both buildings
is maximum for parabolic lateral load pattern among all three lateral load pattern. Similarly, the displacements
at performance point obtained from capacity spectrum for three lateral load patterns on the two buildings with
rigid floor diaphragm follow the same trend. The maximum displacements of the buildings obtained from
pushover analysis are higher than the results obtain