Download to read offline
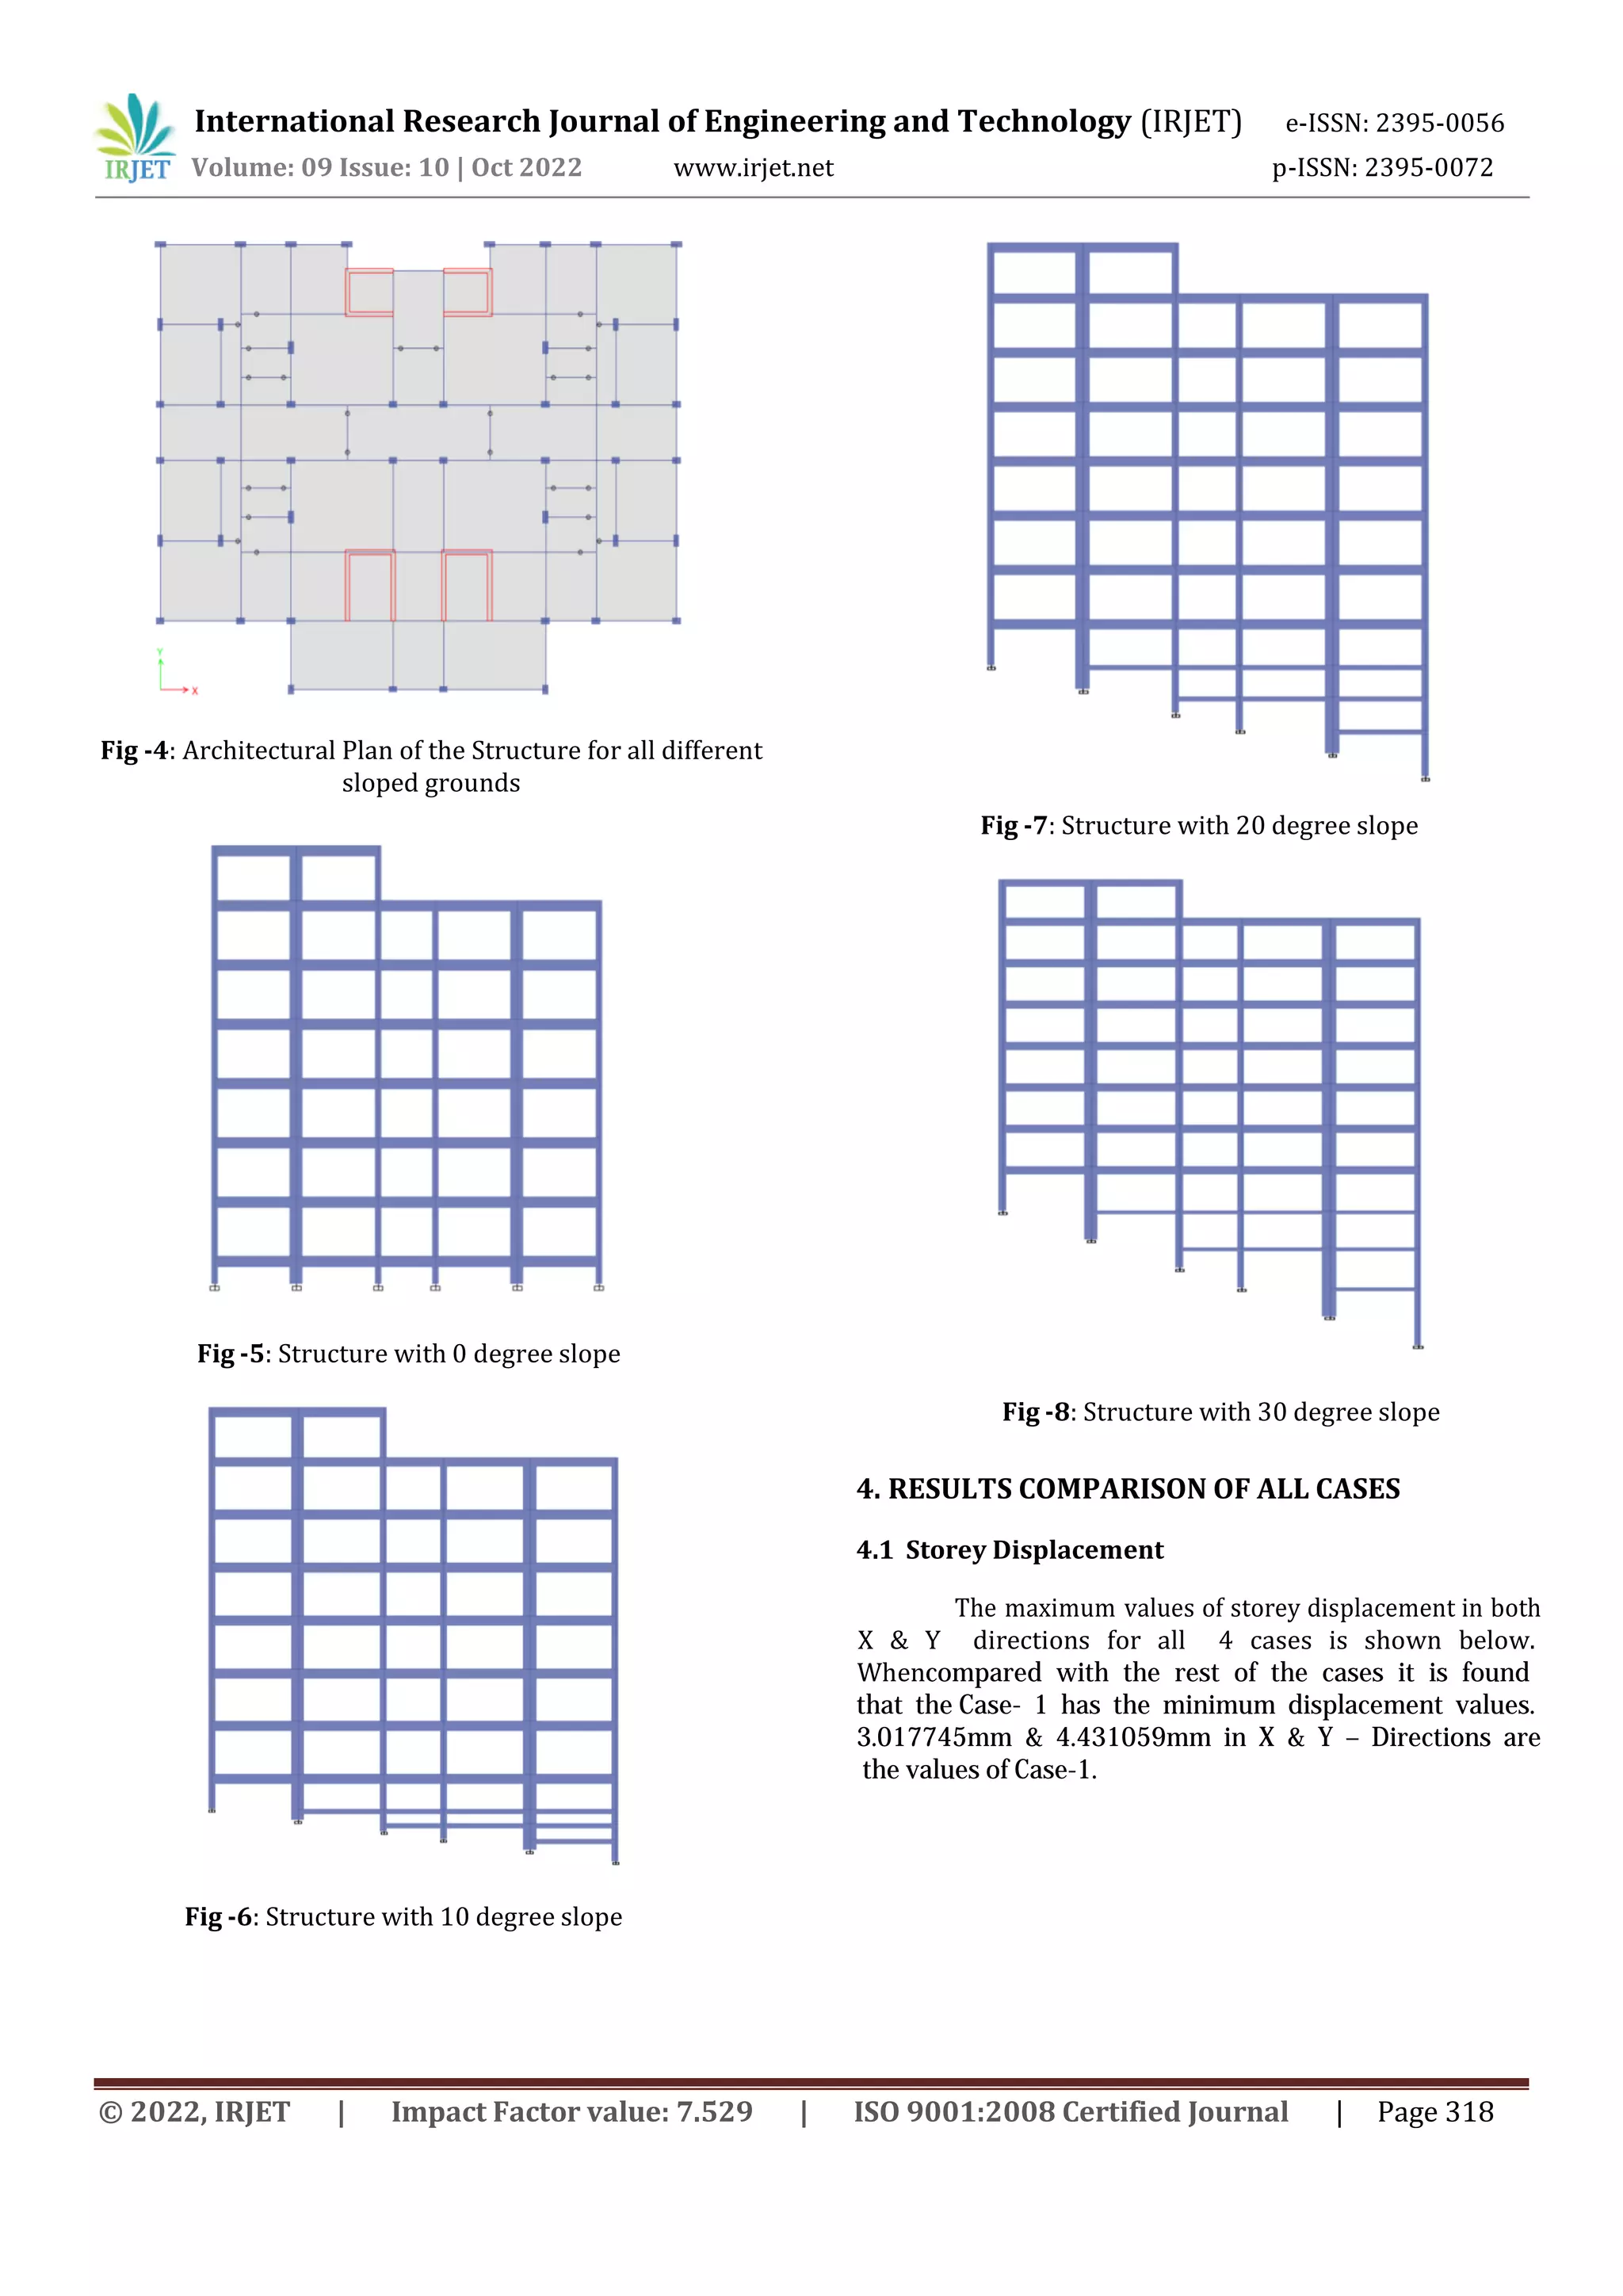
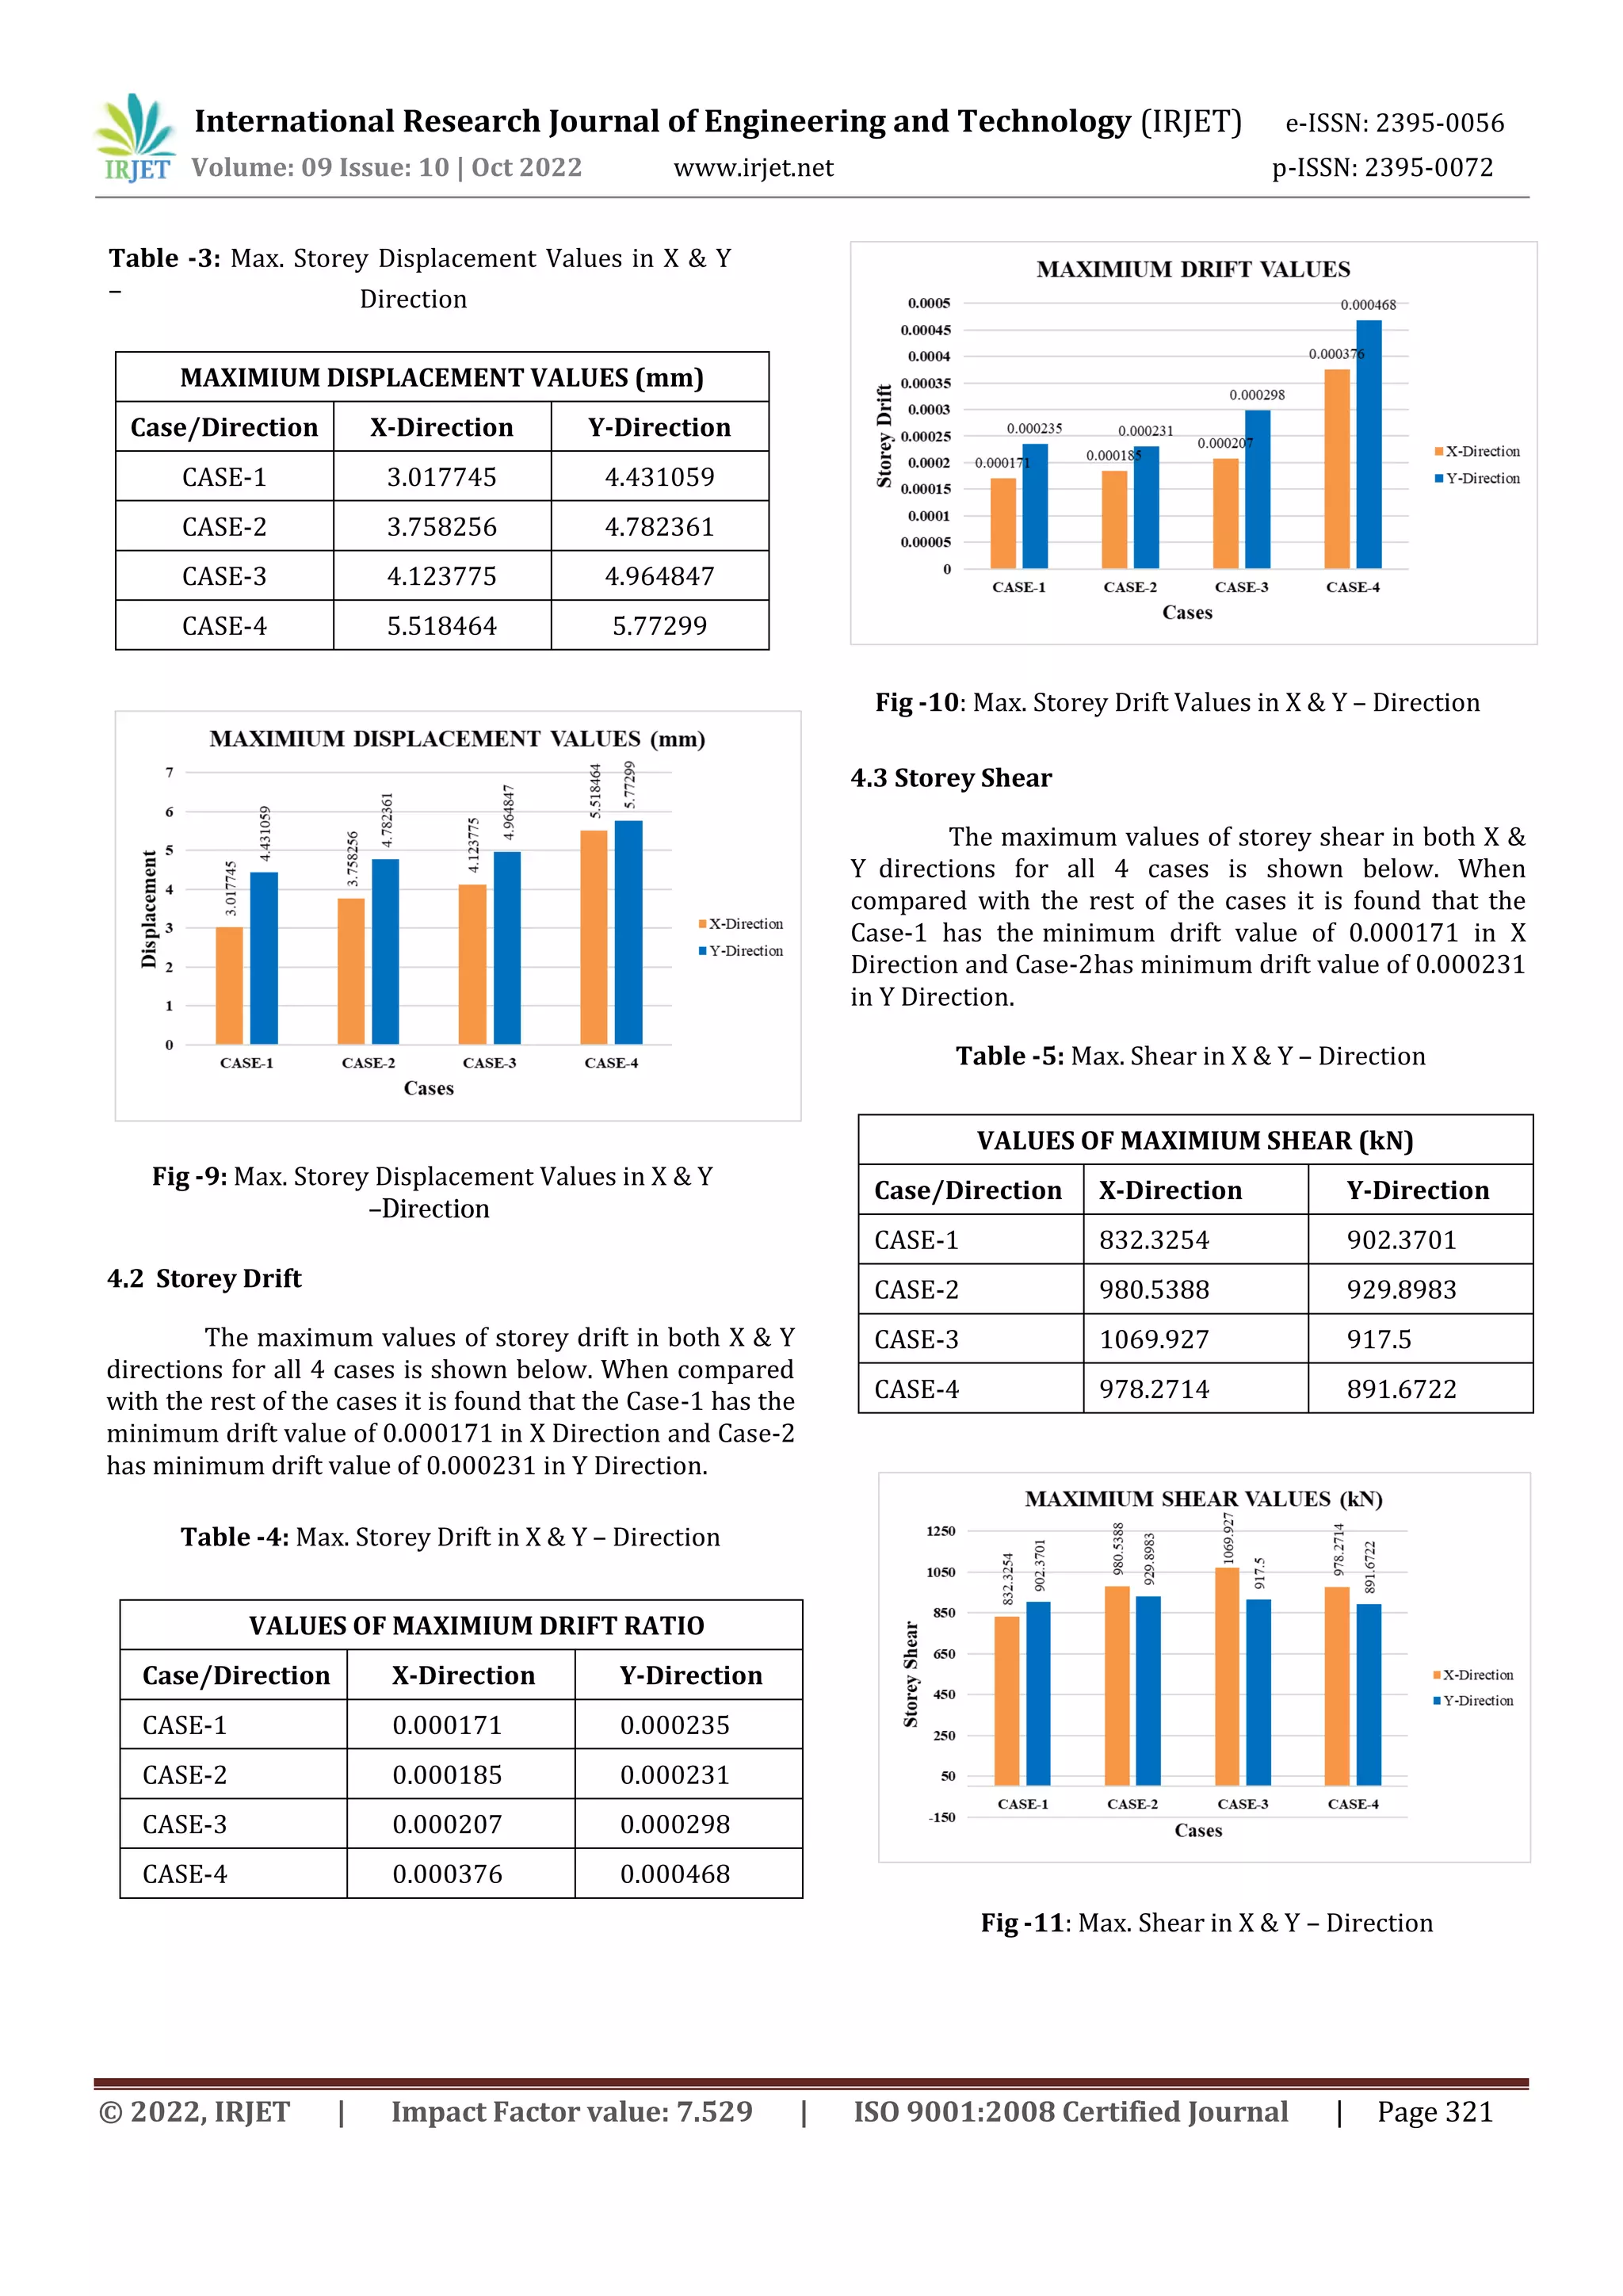

This document presents a comparison of seismic analysis of multistory buildings resting on sloped ground with different slope angles and shear walls using ETABS software. It models and analyzes reinforced concrete structures with slopes of 0, 10, 20, and 30 degrees considering factors like story drift, displacements, and shear forces. The study aims to understand how slope influences building behavior. It loads the structures, performs response spectrum analysis, and compares parameters. Results show the 0 degree slope structure has minimum displacement, drift, and shear values, indicating it performs best under earthquake loads. This research helps evaluate building performance on sloped sites.


