Effectiveness of using Geotextiles in Flexible Pavements and Life-Cycle Cost Analysis International Journal for Modern Trends in Science and Technology

Using geotextiles in between the pavement layers (generally at the interface of subgrade and sub-base) to stabilize weak subgrades has been a well-accepted practice over the past few decades. However, from an economical point of view, a complete life cycle cost analysis (LCCA), which includes not only costs to agencies but also costs to users, is urgently needed to assess the benefits of using geotextile in flexible pavement. Two comparative methods were used to quantify the improvements of using geotextiles in pavements. One is Life Cycle Cost Analysis (LCCA) and the other is Economic Analysis. LCCA is a tool which is generally used after the agency has taken decision to implement the project and seeking to determine the most cost-effective means to accomplish the project's objectives. Unlike LCCA, EA considers the benefits of an improvement as well as its costs and therefore can be used to compare design alternatives that do not yield identical benefits, as well as to compare projects that accomplish different objectives. In this study, a comprehensive life cycle cost analysis framework was developed and used to quantify the benefits of using geotextile at subgrade level in economic terms. For this, a case study of Dhanbad city in Jharkhand was selected where six roads of different hierarchy are being developed with World Bank funding. As per the soil and material investigations, the CBR value of existing subgrade soil was 4%. However, after using geotextile at subgrade level the equivalent strength was found to be around 8%. Forming both as two alternative case scenarios, both Economic Analysis (using HDM-IV developed by the World Bank) and Life Cycle Cost Analysis was conducted. The study concludes that geotextile layer plays a key role in increasing the pavement CBR value from 4% to 8%. Additionally, it also results in economic benefits as increase of average 1%-1.5% in EIRR value can be noted as compared to the pavement without geotextile layer. The results of LCCA shows that initial construction cost of the alternative with 4% CBR (without geotextile layer) as well as life cycle cost is more than the corresponding cost for the second alternative with 8% CBR (with geotextile layer).Hence, the second alternative (CBR 8%-with geotextile layer) is recommended based on both Economic Analysis as well as LCCA. Hence, for an optimum road flexible pavement design with geotextile incorporated in the system, a life cycle cost analysis that includes user cost as well as economic analysis must be performed. ABSTRACT

Recommended
Recommended
More Related Content
What's hot
What's hot (20)
Similar to Effectiveness of using Geotextiles in Flexible Pavements and Life-Cycle Cost Analysis International Journal for Modern Trends in Science and Technology
Similar to Effectiveness of using Geotextiles in Flexible Pavements and Life-Cycle Cost Analysis International Journal for Modern Trends in Science and Technology (20)
Recently uploaded
Recently uploaded (20)
Effectiveness of using Geotextiles in Flexible Pavements and Life-Cycle Cost Analysis International Journal for Modern Trends in Science and Technology
- 1. 60 International Journal for Modern Trends in Science and Technology Effectiveness of using Geotextiles in Flexible Pavements and Life-Cycle Cost Analysis Yasodhara Vegesana1 | P.S.Nadiu2 | PMS Satish Kumar2 1PG Scholar, Department of Civil Engineering, Sanketika Institute of Technology and Management , Visakhapatnam, Andhra Pradesh, India. 2Assistant Professor, Department of Civil Engineering, Sanketika Institute of Technology and Management, Visakhapatnam, Andhra Pradesh, India. 3Head of the Department, Department of Civil Engineering, Sanketika Institute of Technology and Management, Visakhapatnam, Andhra Pradesh, India. To Cite this Article Yasodhara Vegesana, P.S.Nadiu and PMS Satish Kumar, “Effectiveness of using Geotextiles in Flexible Pavements and Life-Cycle Cost Analysis”, International Journal for Modern Trends in Science and Technology, Vol. 03, Issue 10, October 2017, pp: 60-71. Using geotextiles in between the pavement layers (generally at the interface of subgrade and sub-base) to stabilize weak subgrades has been a well-accepted practice over the past few decades. However, from an economical point of view, a complete life cycle cost analysis (LCCA), which includes not only costs to agencies but also costs to users, is urgently needed to assess the benefits of using geotextile in flexible pavement. Two comparative methods were used to quantify the improvements of using geotextiles in pavements. One is Life Cycle Cost Analysis (LCCA) and the other is Economic Analysis. LCCA is a tool which is generally used after the agency has taken decision to implement the project and seeking to determine the most cost-effective means to accomplish the project’s objectives. Unlike LCCA, EA considers the benefits of an improvement as well as its costs and therefore can be used to compare design alternatives that do not yield identical benefits, as well as to compare projects that accomplish different objectives. In this study, a comprehensive life cycle cost analysis framework was developed and used to quantify the benefits of using geotextile at subgrade level in economic terms. For this, a case study of Dhanbad city in Jharkhand was selected where six roads of different hierarchy are being developed with World Bank funding. As per the soil and material investigations, the CBR value of existing subgrade soil was 4%. However, after using geotextile at subgrade level the equivalent strength was found to be around 8%. Forming both as two alternative case scenarios, both Economic Analysis (using HDM - IV developed by the World Bank) and Life Cycle Cost Analysis was conducted. The study concludes that geotextile layer plays a key role in increasing the pavement CBR value from 4% to 8%. Additionally, it also results in economic benefits as increase of average 1%-1.5% in EIRR value can be noted as compared to the pavement without geotextile layer. The results of LCCA shows that initial construction cost of the alternative with 4% CBR (without geotextile layer) as well as life cycle cost is more than the corresponding cost for the second alternative with 8% CBR (with geotextile layer).Hence, the second alternative (CBR 8% - with geotextile layer) is recommended based on both Economic Analysis as well as LCCA. Hence, for an optimum road flexible pavement design with geotextile incorporated in the system, a life cycle cost analysis that includes user cost as well as economic analysis must be performed. Keywords: HDM (Highway Development and Maintenance), CBR, Geotextiles, LCCA (Life Cycle Cost Analysis). ABSTRACT Available online at: http://www.ijmtst.com/vol3issue10.html International Journal for Modern Trends in Science and Technology ISSN: 2455-3778 :: Volume: 03, Issue No: 10, October 2017
- 2. 61 International Journal for Modern Trends in Science and Technology Yasodhara Vegesana, P.S.Nadiu and PMS Satish Kumar : Effectiveness of using Geotextiles in Flexible Pavements and Life-Cycle Cost Analysis Copyright © 2017 International Journal for Modern Trends in Science and Technology All rights reserved. I. INTRODUCTION 1.1 General Road transportis vital to economic enhancement, trade and social integration. Reduction in transportation costs may lead to economies of scale which can be exploited in form of extension and specialization of market. Efficient transport and logistic systems have become an absolute imperative in the delivery chain due to global competition. Roadways is a form transport has earned increasingly higher share (among other transport modes) of both passenger and freight traffic due to factors such as accessibility, flexibility of operations, door-to-door service and reliability. As per the latest available data, Road transport has emerged as the dominant segment in India’s transportation sector with a share of 4.5%of India’s GDP in 2005-06. During 2000-01 to 2005-06, the road transport sector GDP grew at annual average of 9.5% which was much higher than the overall GDP growth of 6.5%. Robust growth in road transport has been attained despite significant barriers to inter-State freight and passenger movement compared to inland waterways, railways and air which do not face rigorous enroute checks/barriers. The present scenario in India demands maximum transit facilities to be developed at a low cost within shortest feasible time. India being predominantly rural in nature, road links are found to have distinct advantage over other modes of communication. However, economy, time, environmental constraints and several other factors make a highway professional’s job more challenging in delivering a safe and cost-effective road network to its users. One of the major problems faced by the engineers in highway construction, in plains and coastal areas of India is the presence of soft/loose soil at ground level. 1.2 Study Area The selected project is being undertaken by Government of Jharkhand through Jharkhand Urban Infrastructure Development Company Limited (JUIDCO) who intends to develop urban infrastructure in different towns of the State including Dhanbad. Dhanbad is one of the largest industrial towns of Jharkhand and is known as the Coal Capital of India, with nearly half of area under Dhanbad Municipal Corporation (DMC) is allocated for coal mines. This project is being funded by World Bank. Part of proceeds of a proposed Loan from the World Bank is meant for the development of roads, and other urban infrastructure of Dhanbad. This project is conceived in two phases. As mentioned in the scope of study, this study focuses only in the roads selected for development in Phase 1. The roads included in Phase 1 of the Project are listed in Table 1.1. Map showing all the project roads is given in Figure 1.1. Table I.1: Details of Project Roads Road ID Road Name Length (km) Existing Configuration Proposed Configuration Phase 1 11A Kanko Chowk - Vinod Vihari Chowk 11.700 2 Lane 4 Laning with Cycle Track and Service Roads 11B Vinod Vihari Chowk - Memco Gol Building Chowk 8.291 2 Lane 4 Laning with Cycle Track and Service Roads 12 Bekar Bandh Chowk - Gandhi /Combined Building Chowk 0.585 2 Lane 4 Laning with Cycle Track and Auto-rickshaw Lane 13 Birsa Munda Chowk (NH 32)- Purana Bazar Chowk - Jorapathak Chowk - Dhansar Chowk 1.861 2 Lane 4 Laning + Hawker Zone 14 Jharia Market Road (No. 4 Main Road) 0.924 Intermediate Lane 2 Lane + Hawker Zone 15 Telipada Mode (NH32) - Telipada - Law College Mode 1.210 Single Lane 2 Lane 16 Hatia Mode (NH 32) - Hatia - 4.787 Single 2 Lane + Hawker Zone
- 3. 62 International Journal for Modern Trends in Science and Technology Yasodhara Vegesana, P.S.Nadiu and PMS Satish Kumar : Effectiveness of using Geotextiles in Flexible Pavements and Life-Cycle Cost Analysis Road ID Road Name Length (km) Existing Configuration Proposed Configuration ROB - Old Railway Station - Purana Bazar Chowk /Intermediate Lane Total Length (Km) 29.358 ’ Figure 1.1 Map Showing Location of Project Roads 1.3 Pavement Design Pavement costs about half of civil works and hence adequate emphasis was given to the pavement and subgrade investigations. And options analysis was carried out to find out the cost-effective pavement option for the project roads. The existing CBR values of soil samples collected from surrounding areas of project influence area was found to be 4%. After due consideration, the Design Subgrade CBR is taken as 8% (with use of geo-textile layer between the interface of subgrade and subbase), design period as 15 years for asphalt pavement, and 30 years for concrete pavement. Concrete pavement requires PQC 280 mm for Road 11 and 250 mm for all other roads supported on 150 mm DLC and 150 mm GSB. Pavement layer thickness charts given in IRC 37–2012 from Plate no. 1 to Plate no. 20 have been referenced for pavement Design and are presented in Table 1.2 Table I.2: Pavement Design for New Construction /Widening Section S. No Road ID Design CBR, (%) Traffic (msa) Pavement Composition BC DBM WMM GSB 1 11 8 40 40 90 250 200 2 12 8 20 40 80 250 200 3 13 8 20 40 80 250 200 4 14 8 20 40 80 250 200 5 15 8 20 40 80 250 200 6 16 8 20 40 80 250 200 7 Service Road 8 10 40 60 250 200 8 Cycle Track 8 - - 80 / 90 250 200 Source: Vasuprada Consultants LLP, New Delhi 1.4 Objectives The main aim of this study is to evaluate the cost-effectiveness of using geotextiles (the most used geosynthetic in pavements) at the subgrade level in pavement. For achieving the above-mentioned aim, fulfilment of following objectives is imperative. To investigate the improvement of the pavement system due to the use of geotextiles; To carry out Life Cycle Cost Analysis and Economic Analysis for an alternative case scenario of using geotextiles in subgrade layer as oppose to typical pavement design for selected case study; and To carry out sensitivity analysis to examine the influence of several cost parameters on the case study in both base and alternative scenario.
- 4. 63 International Journal for Modern Trends in Science and Technology Yasodhara Vegesana, P.S.Nadiu and PMS Satish Kumar : Effectiveness of using Geotextiles in Flexible Pavements and Life-Cycle Cost Analysis 2. LITERATURE STUDY 2.1 Existing Literature The first state of the art volume on use of Geosynthetics in India-Experiences and potential was brought out by the Central Board of Irrigation and Power in 1989 by Mr. Rao and Saxena. This was a compilation of the field trails in the country, which helped other engineers to gain confidence in the use of Geotextiles. [1] Ghosal and Som (1989) have reported the first major use of a non-woven fabric in a heavy-duty construction yard in Haldia. It has been found to decrease the pavement thickness to the extent of 30%. [2] The focus of discussion in the 3-day National workshop on Engineering with Geosynthetics, organized in the Delhi chapter of the Indian Geotechnical society by Venkatappa Rao and Raju in 1990. [3] Aziz et al, 1994, who also reported substantial increase in the CBR values of a clayey subgrade, when compacted with two layers of JGT interposed within the soil at varying Moisture Contents. [4] The various causes of Erosion and different Geo synthetics solutions available are detailed in “Erosion Control With Geo synthetics” published by the CBIP, Venkatappa Rao, 1995. [5] Use of Geogrids in a flexible pavement overlay is found to improve the overall behavior. Non -Woven Geotextiles and bi-oriented geogrids have been successfully utilized in Maharashtra (1997) in the state Highways by the PWD for strengthening the road pavements in Black Cotton soils. [6] The Four R’s – Restoration, resurfacing, recycling and reconstruction. Each of the four types of rehabilitation measures and treatments are presented in a paper which is published by Hall, 2001 [7] Jute Geotextile is a fabric which is ground in abundance in Iriclia. It also displays some advantageous intrinsic properties like high tenacity, non-toxicity, biodegradability etc. had also been found to be ecofriendly by Chattopadhyay et al, 2003. [8] LCCA is an analysis technique used to evaluate long term economic efficiency and is a decision support tool from several commutative alternatives it includes all current and further cost associativewhich is given by (FWHA ,2002; Hass et al., 1993; Hickas Epps 2002). [9] 2.2 Present Study This study focusses on assessing the cost effectiveness using geotextile in pavement layer, preferably at subgrade. This study follows the methodology of reviewing existing literature and recent works being conducted in this research area. For this, existing work in the form of written journal articles, books and manuals were studies as a part of literature study. Once this was done, Objectives, Research Methodology, Scope of Study and limitation work defined for this study which is discussed. After formulating, objectives, it was decided to take an ongoing case study and apply the acquired knowledge to strengthen the study of pavement using Geotextile layer. 3. BACKGROUND KNOWLEDGE 3.1 Geosynthetics Geosynthetics is a planar product which is manufactured from polymeric material and used with soil, rock, earth or other geotechnical engineering related material as an integral part of a man-made project, structure, or system (ASTM Committee D35 on Geosynthetics). The main functions of geosynthetics in the pavement industry are separation, reinforcement, filtration, and drainage. The major product uses in this area are geotextiles, geogrids, geosynthetic clay liners, geo-composites, and geonets. The main purpose of using geosynthetic materials is to have better performance and to save money. Functions and Applications of Geosynthetic Geosynthetics serve the following principal functions (refer Figure 3. 1) i) Separation - in which a geosynthetic placed between two dissimilar geotechnical materials, prevents intermixing; ii) Filtration - in which a geotextile allows passage of fluids from a soil while simultaneously preventing the uncontrolled passage of soil particles; iii) Drainage - in which a geosynthetic may collect and transport fluids in its own plane; iv)Reinforcement - in which, a geosynthetic resists stresses and contains deformations in geotechnical structures by the tensile characteristics; and v) Barrier - in which a geosynthetic acts as a barrier to liquid/gas. In addition, geotextiles serve the following functions:
- 5. 64 International Journal for Modern Trends in Science and Technology Yasodhara Vegesana, P.S.Nadiu and PMS Satish Kumar : Effectiveness of using Geotextiles in Flexible Pavements and Life-Cycle Cost Analysis vi)Protection or cushioning - in which a geotextile serves as a localized stress reduction layer to prevent or reduce damage to a given surface or layer; and vii) Surficial erosion control - in which a geotextile may prevent the surface erosion of soil particles due to surface water run-off and/or wind forces. Figure 0.1: Various Applications of Geo-synthetics Table 0.1: Geosynthetic Application Summary Application Primary Function Products Subgrade/Pavement Stabilization Separation Reinforcement Filtration Geotextile/geogrid Railroad Track-bed Stabilization Drainage Separation Filtration Geotextile/geogrid Asphalt Overlay Stress relieving layer Water proofing Geotextile/geogrid Soil Reinforcement Embankment Reinforcement Geotextile/geogrid Steep Slopes Reinforcement Geotextile/geogrid Verticals Walls Reinforcement Geotextile/geogrid Subsurface Drainage (French drains) Filtration Fluid transmission Prefabricated drainage Composites Erosion Control Filter Filtration Separation Geotextile Surface Erosion Control Turf reinforcement Erosion control mats Fabric forming mats Canal/pond lining Moisture barrier Geomembrane Landfills Separation Filtration Drainage Reinforcement Barrier Geotextiles/geogrids/ Geomembranes/ Geosynthetic clay liners Geomembrane protection Protection/cushion Geotextile Pavement The conventional way of constructing a road in an area having very soft subgrade is to spread a carpet of unbound aggregate over soft deposit to act as a load dispersing medium, when forming a roadway to keep distress within tolerable limits. When a wheel load traffics over such an unprotected formation soil it imposes dynamic stress. When shear strength of the subgrade is inadequate then this ongoing trafficking will initiate a bearing capacity failure by creating progressively deeper ruts.
- 6. 65 International Journal for Modern Trends in Science and Technology Yasodhara Vegesana, P.S.Nadiu and PMS Satish Kumar : Effectiveness of using Geotextiles in Flexible Pavements and Life-Cycle Cost Analysis This causes subsequent losses on original fill thickness with a portion of the underlying soil being squeezed upwards into the voids of the granular fill and some of the aggregate penetrating into the subgrade. If this contamination remains unattended then ultimately a stage is reached when the fill diminishes in thickness to such a degree that unacceptable rutting occurs and the formation can no longer serve as trafficable one. Figure 0.2: Schematic diagram showing beneficial effect of using Geosynthetic Extensive studies are being carried out in laboratory and semi-infinite model pavement to study the role of geosynthetic in pavements and overlays and are continuing in several institutions around the world. 3.2 Types of Geosynthetics and its manufacturing methods Information on different varieties of geosynthetics that are in use and its manufacturing methods as compiled by Rao, 2007 are explained below. Geosynthetic is defined by the International Geosynthetic Society as a planner, polymeric (synthetic or natural) material that are synthesized for use in contact with soil/rock and/or any other geotechnical material in civil engineering applications. It is a generic term which includes: Geotextiles; Geogrids; Glasstex; Geonets; Geomembranes; Geo-composites; Prefabricated vertical drain (PVD); Geosynthetic clay liner (GCL); and Geomat 3.3 Use of Natural Geo-textile in Civil Engineering applications With the growing awareness of using environment friendly products wherever possible natural geotextile made of jute and coir is now becoming very prospective for road construction in our country. 3.4 Life Cycle Cost Analysis In the National Council of Highway Research Programs (NCHRP) Synthesis of Highway Practice, Peterson (1985) defined LCCA as follows: To evaluate the economics of a paving project, an analysis should be made of potential design alternatives, each capable of providing the required performance. If all other things are equal, the alternative that is the least expensive over time should be selected. According to FHWA recommendations, an analysis period of at least 35 years should be used. The different economic indicators commonly used in the LCCA procedure are present worth (PW), method (of benefits, costs, benefits and costs-NPV), equivalent uniform annual cost (EUAC), internal rate of return (IRR), and the benefit cost ratio (BCR). 3.5 Agency Cost Agency cost typically consists of fees for initial preliminary engineering, contract administration, construction supervision, construction, maintenance and rehabilitation, and costs associated with administrative needs (FHWA, 1998). When considering agency costs, routine annual maintenance costs and sink value are usually neglected. Because sink value does not affect decision making and routine maintenance costs when discounted to the present value, the cost differences will have a negligible effect on the net present value (NPV). 3.6 User Cost According to FHWA Life Cycle Cost Analysis in Pavement Design (1998), user cost is usually classified into two categories: (i) normal operation user cost, and (ii) work zone user cost. The normal operation user cost
- 7. 66 International Journal for Modern Trends in Science and Technology Yasodhara Vegesana, P.S.Nadiu and PMS Satish Kumar : Effectiveness of using Geotextiles in Flexible Pavements and Life-Cycle Cost Analysis reflects highway user costs related to using a facility during free construction, maintenance, and/or rehabilitation activities that restrict the capacity of the facility. This type of user cost is a function of different pavement performance (roughness) of the facility. Another type of user cost is referred to as work zone user cost, which is associated with using a facility during construction, maintenance, and/or rehabilitation activities that restrict the capacity of the facility and disrupt the normal traffic flow. 3.7 User Delay Cost Generally, travel time costs vary by vehicle class, trip type (urban or interurban) and trip purpose (business or personal). The work zone user delay costs may be significantly different for different rehabilitation alternatives, depending on traffic control plans associated with the alternatives. Therefore, the work zone delay costs should take into consideration not only average daily traffic volumes but also daily and hourly variations in traffic volume. The NCHRP Project 7-12, “Microcomputer Evaluation of Highway User Benefits,” recommends a typical traffic volume distribution value for urban or rural roadways. 4. METHODOLOGY 4.1 General In the present study, following tests were conducted on a natural soil obtained from the surrounding area of project roads. Liquid and plastic limits were conducted on the sample based on IS: 2720 (Part- V)- 1970. Tests have been conducted on two soil sample. Particle size distribution of both soil samples was determined as per the procedure outlined in IS Code 2720, part- 4, 1987. Specific gravity of the soil specimens was determined by making use of the density bottle and as per the procedure out lined in IS 2720, part 3, sec1, 1980. The specific gravity value reported in the test results is the average of three specimen of each soil sample. 4.2 Economic Analysis Economic analysis, or cost-benefit analysis as it is also known, is to weigh the project benefits and costs to the society at large. And then decide whether investing on the project is worth or an alternative investment will give more benefits to the economy. Findings of the economic analysis carried out for all six road is presented in this chapter. This section is followed by traffic forecast, which essentially represents the demand side of the road infrastructure. Table 0.1: Standard load (kg) for respective penetration of plunger (mm) Penetration of plunger (mm) Standard load (kg) 2.5 1,370 5 2,055 7.5 2,630 10 3,180 12.5 3,600 Table 0.2: Average Annual Daily Traffic (motorised, in VPD) Vehicle Type Road ID - Sections 11 - I* 11 - II** 12 13 14 15 16 Two-Wheeler 4,967 4,856 16,244 10,698 6,677 3,809 6,178 Three-Wheeler 883 1,093 9,905 4,279 4,633 254 883 Car 3,201 3,642 10,697 4,493 1,499 914 1,236 LCV 221 364 792 214 136 51 88 2 Axle Truck 442 486 395 642 136 0 88 3 Axle Truck 442 728 390 856 273 51 177 Multi Axle Truck 221 121 402 214 0 0 88 Mini Bus 110 243 397 0 136 0 88 Bus 221 364 396 0 136 0 0 Tractor 331 243 0 0 0 0 0 Total 11,039 12,140 39,619 21,396 13,627 5,078 8,826 Source: Traffic Analysis by Vasuprada Consultants LLP Note: Road ID 11 is divided into two sections for Economic Analysis. These sections are: * 11-1: Kanko Chowk (Km 0.000) to Vinod Vihari Chowk (Km 11.700); and **11-2: Vinod Vihari Chowk (Km 11.700) to Gol Building Chowk (Km 19.991).
- 8. 67 International Journal for Modern Trends in Science and Technology Yasodhara Vegesana, P.S.Nadiu and PMS Satish Kumar : Effectiveness of using Geotextiles in Flexible Pavements and Life-Cycle Cost Analysis Table 0.3: Traffic (motorised) composition Vehicle Type Road ID - Section 11 - I* 11 - II** 12 13 14 15 16 Two-Wheeler 45% 40% 41% 50% 49% 75% 70% Three-Wheeler 8% 9% 25% 20% 34% 5% 10% Car 29% 30% 27% 21% 11% 18% 14% LCV 2% 3% 2% 1% 1% 1% 1% 2 Axle Truck 4% 4% 1% 3% 1% 0% 1% 3 Axle Truck 4% 6% 1% 4% 2% 1% 2% Multi Axle Truck 2% 1% 1% 1% 0% 0% 1% Mini Bus 1% 2% 1% 0% 1% 0% 1% Bus 2% 3% 1% 0% 1% 0% 0% Tractor 3% 2% 0% 0% 0% 0% 0% Total 100% 100% 100% 100% 100% 100% 100% Source: Traffic Analysis by Vasuprada Consultants LLP Overall, passenger vehicles are predominant (83%), and non-motorised traffic is around (6%) on the project roads. Primarily due to all six roads being in Urban/Built Up Area, motorcycles accounts for more than 50% of total traffic. Vehicle occupancy (persons traveling in or on a vehicle) at an aggregate level of project roads is as follows and are plausible in the Indian context: 37, buses; 3.1, cars and taxis (4W); 23, mini buses; 6, auto-rickshaws (3W); and 1.6, Scooters (2W). Table 0.4: Shadow Exchange Rate Factor Fiscal Year 2011-12 2012-13 2013-14 2014-15 2015-16 2016-17 Exports 14,660 16,343 19,050 18,963 17,164 18,523 Imports 23,455 26,692 27,154 27,371 24,903 25,774 Total Trade 38,115 43,035 46,204 46,334 42,067 44,297 Tax on Imports 1,391 1,586 1,674 1,933 2014 2232 Tax on Exports 103 63 77 85 69 68 Net Trade Taxes 1,288 1,523 1,597 1,848 1,945 2,164 SERF 1.034 1.035 1.035 1.040 1.046 1.049 Average SERF 1.040 Table 0.5: Vehicle and Tyre Prices (Financial Cost) Costs Vehicle Base Type New Vehicle Price (Rs) New Tyre Price (Rs) Overhead (Rs) Vehicle Utilization (km/year)** Hours /year Tyre Life (km) Car/Jeep/Van Medium Car 7,20,000 3,000 16,524 34,900 698 53,840 Mini Bus Mini Bus 12,00,000 6,000 27,540 45,000 1,125 41,983 Bus Medium Bus 23,00,000 16,000 52,785 76,911 1,923 55,290 Light Goods Vehicle LGV 8,10,000 6,000 18,590 41,881 1,047 41,983 Medium Truck 2- Axle Truck 18,00,000 15,000 41,310 1,00,909 2,523 74,666 Heavy Truck 3- Axle Truck 28,50,000 17,000 65,408 1,00,909 2,523 74,666 Very Heavy Multi Axle 35,00,000 17,000 80,325 90,114 2,253 56,000
- 9. 68 International Journal for Modern Trends in Science and Technology Yasodhara Vegesana, P.S.Nadiu and PMS Satish Kumar : Effectiveness of using Geotextiles in Flexible Pavements and Life-Cycle Cost Analysis Truck Truck Tractor Agricultural Tractor 8,00,000 16,000 18,360 20,940 700 -- 3-Wheeler Auto Rickshaw 3,00,000 950 6,885 23,000 550 -- 2-Wheeler Motor Cycle 62,000 1,100 1,423 9,000 200 -- Source: Vehicle and tyre prices, maintenance labor wages are based on market survey, and overhead as 3% of new vehicle prices. Vehicle utilization are based on "CRRI: Development of Road User Cost models for Highway Speed Corridors, September 2014". Number of hours per year based on vehicle utilization and assumed speeds. Table 0.6: Financial Costs of Crew Wages and Maintenance Labor Vehicle Base Type Crew Wages (Rs/hr) Maintenance Labour (Rs/hr) Car/Jeep/Van Medium Car 36 45 Mini Bus Mini Bus 56 45 Bus Medium Bus 75 60 Light Goods Vehicle LGV 56 45 Medium Truck 2- Axle Truck 94 75 Heavy Truck 3- Axle Truck 94 75 Very Heavy Truck Multi Axle Truck 100 80 Tractor Agricultural Tractor 36 45 3-Wheeler Auto Rickshaw 36 45 2-Wheeler Motor Cycle 0 45 Source: Crew Wages and maintenance labour are based on market Survey Table 0.7: Financial and Economic Costs of Fuel A: Price Build-up of Petrol at Delhi with effect from 3rd September 2017 S. No. Elements Unit Cost 1 C&F (Cost & Freight) Price of Gasoline (Petrol) BS III equivalent $/bbl. 65.48 2 Average Exchange Rate Rs/$ 64.08 3 Refinery Transfer Price (RTP) on landed cost basis for BS IV Petrol (Price Paid by the Oil Marketing Companies to Refineries) Rs/Ltr 26.65 4 Price Charged to Dealers (excluding Excise Duty and VAT) Rs/Ltr 30.05 5 Add: Specific Excise Duty @ Rs. 21.48/Ltr Rs/Ltr 21.48 6 Add: Dealer Commission Rs/Ltr 3.24 7 Add: VAT (including VAT on Dealer Commission) applicable for Delhi @ 27% Rs/Ltr 14.78 8 Retail Selling Price at Delhi- (Rounded) Rs/Ltr 69.55 Economic Price Rs/Ltr 30.05 B: Price Build-up of Diesel at Delhi with effect from 3rd September 2017 S. No. Elements Unit Cost 1 C&F (Cost & Freight) Price of Diesel III equivalent $/bbl. 63.61 2 Average Exchange Rate Rs/$ 64.08 3 Refinery Transfer Price (RTP) on landed cost basis for BS IV Petrol (Price Paid by the Oil Marketing Companies to Refineries) Rs/Ltr 26.00 4 Price Charged to Dealers (excluding Excise Duty and VAT) Rs/Ltr 29.31 5 Add: Specific Excise Duty @ Rs. 17.33/Ltr Rs/Ltr 17.33 6 Add: Dealer Commission Rs/Ltr 2.17 7 Add : VAT (including VAT on Dealer Commission) applicable for Delhi @ 16.75% + Pollution Cess of Rs 0.25/Ltr Rs/Ltr 8.47 8 Retail Selling Price at Delhi- (Rounded) Rs/Ltr 57.28 Economic Price Rs/Ltr 29.31 Source: Indian Oil Corporation website (www.iocl.com/Products/) accessed on 3rd September 2017
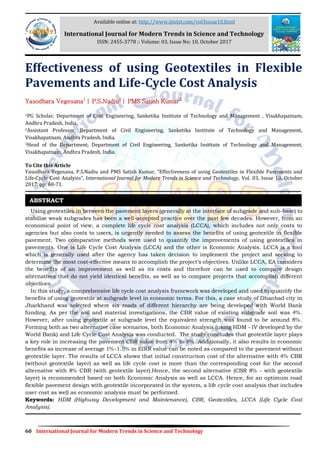
- 10. 69 International Journal for Modern Trends in Science and Technology Yasodhara Vegesana, P.S.Nadiu and PMS Satish Kumar : Effectiveness of using Geotextiles in Flexible Pavements and Life-Cycle Cost Analysis 5. APPLICATION OF METHODOLOGY 5.1 Methodology The methodology followed on how theprocess of effectiveness of Geotextiles in flexible pavements is analyzed is presented in Figure 5.1. Figure 0.1: Methodology 5.2 Compaction The compaction characteristic curve obtained from light compaction is shown in graph (Figure 5.23). It shows the optimum moisture content (OMC) and maximum dry density (Ƴd). Practically it is not possible to remove 100% air voids from the soil and hence the soil is partially saturated in OMC as well as on dry and wet of OMC. Compaction Characteristics of soil samples are presented in Table 5.6. The formula for calculation maximum dry density is given as follows: Table 0.1: Compaction Characteristic Description Unit 1 2 3 4 5 6 Weight of Mold (g) 3,735 3,735 3,735 3,735 3,735 3,735 Weight of Mold + Soil (g) 5,509 5,646 5,731 5,754 5,749 5,749 Weight of Soil (g) 1,774 1,911 1,996 2,019 2,014 2,014 Wet Density (g/cc) 1.77 1.91 2.00 2.02 2.01 2.01 Container No. 154 44 42 53 202 169 Weight of Container (g) 66.09 69.72 66.32 65.52 67.77 70.63 Weight of C + Wet Soil (g) 127.00 122.26 135.00 121.85 129.20 115.85 Weight of C + Dry Soil (g) 121.59 116.83 126.94 114.15 120 108.48 Weight of Wet Soil (g) 60.91 52.54 68.68 56.33 61.43 45.22 Weight of Dry Soil (g) 55.50 47.11 60.62 48.63 52.23 37.85 Weight of Moisture (g) 5.41 5.43 8.06 7.70 9.20 7.37 Moisture Content (%) 9.75 11.53 13.30 15.83 17.61 19.47 Dry Density (g/cc) 1.62 1.71 1.76 1.74 1.71 1.69 5.3 Result of Sample with Geotextile The compaction characteristic curve obtained from light compaction is shown in graph (Table 5.8). Table 0.2: Compaction Characteristics Description Units 1 2 3 4 5 Weight of Mold (g) 3,726 3,726 3,726 3,726 3,726 Weight of Mold + Soil (g) 5,619 5,690 5,768 5,754 5,747 Weight of Soil (g) 1,893 1,964 2,042 2,028 2,021 Wet Density (g/cc) 1.89 1.96 2.04 2.03 2.02 Container No. 13 116 62 104 143
- 11. 70 International Journal for Modern Trends in Science and Technology Yasodhara Vegesana, P.S.Nadiu and PMS Satish Kumar : Effectiveness of using Geotextiles in Flexible Pavements and Life-Cycle Cost Analysis Description Units 1 2 3 4 5 Weight of Container (g) 66.41 68.77 71.05 68.56 68.08 Weight of C + Wet Soil (g) 162.51 146.82 158.72 140.48 148.60 Weight of C + Dry Soil (g) 155.95 140.33 150.11 131.8 138.48 Weight of Wet Soil (g) 96.10 78.05 87.67 71.92 80.52 Weight of Dry Soil (g) 89.54 71.56 79.06 63.24 70.40 Weight of Moisture (g) 6.56 6.49 8.61 8.68 10.12 Moisture Content (%) 7.33 9.07 10.89 13.73 14.38 Dry Density (g/cc) 1.76 1.80 1.84 1.78 1.77 Figure 0.2: CBR value vs Dry Density - without geotextile 5.4 Project Costs The total project cost for economic analysis purposes include: Construction costs along with centages (environmental mitigation costs, supervision charges, agency costs etc.) and physical contingencies, and LARR Costs; but Excludes fiscal contingencies. 5.5 Cost Benefit Analysis The construction and LARR costs will be incurred as follows: 2018, 40%; and 2019, 60%. 5.6 Life Cycle Cost Analysis The two project alternatives considered for this project were compared in Economic Analysis and initial LCCA was conducted to decide on the option of using Rigid and Flexible pavement for the project. The result of initial LCCA is presented in the following sub section. 6. RESULTS AND CONCLUSIONS Summary Geotextiles have been used in pavements to either extend the service life of the pavement or to reduce the total thickness of the pavement system. However, the economic benefits of using this material are still not clear. In general, most of the geotextile related life cycle cost analysis studies only account for agency costs. In this study, a comprehensive life-cycle cost analysis of geotextile stabilized pavements, including initial construction, future maintenance, rehabilitation, and user costs is considered. In this study, a comprehensive life cycle cost analysis and economic analysis framework was developed and used to quantify the economic and social benefits. A 20year (plus 2 years construction period) analysis cycle was used to compute the cost-effectiveness ratio for the design methods. The costs which were considered in the LCCA and economic analysis process include agency costs and user costs. Findings and Conclusions A comprehensive economic analysis framework has been developed in this study to evaluate the economic benefit of using geotextiles in pavement. The resulting benefit has been quantified in terms of an economic internal rate of return. The findings in this study are limited to the design features, unit costs and performance models assumed in this analysis. Once the economic analysis was done, LCCA was also
- 12. 71 International Journal for Modern Trends in Science and Technology Yasodhara Vegesana, P.S.Nadiu and PMS Satish Kumar : Effectiveness of using Geotextiles in Flexible Pavements and Life-Cycle Cost Analysis conducted to strengthen the case of use of geotextile in Pavement layer at subgrade level. Both the economic analysis and LCCA have shown that the use of geotextile is better both from the point of view of increasing the strength of Pavement as well as cost effectiveness. Recommendations for Future Work This study is mainly intended to propose a cost-effectiveness analysis framework that can be used to operate similar analyses. It presented a framework on how to quantify engineering benefits into economic benefits by performing economic analyses. Included in this study are models that predict pavement performance, suggest rehabilitation designs, and predict user costs and accident rates at work zones. This model need to be improved by using more reliable parameters and be calibrated to specific local conditions. This is especially applicable to the pavement performance models. REFERENCES [1] American Association of State Highway and Transportation Officials AASHTO. Guide for Design of Pavement Structures. AASHTO, Washington, DC, 1993. [2] ASTM (1994), Annual Books of ASTM Standards, American Society Testing and Materials, Philadelphia, Pennsylvania. Volume 4.08 (1), Soil and Rock, Volume 4. No. (8), Soil and Rock, Geosynthetics, Volume 7, No. 1, Textiles. [3] Abdullah, A. B. M., A Hand book of Geotextiles Particularly natural geotextiles from jute and other vegetable fibers, FAO-2000 [4] Gregory, R. N., Barry, C. R., Geotextiles in Transportation Applications, Featured Short Course, 1998 [5] IRC 37:2001; Guidelines for the Design of Flexible Pavements. [6] Koerner, R. M., Designing with Geosynthetics, Third edition, Prentice Hall, 1993. [7] Rankilor, P. R., Membranes in Ground Engineering, John Wiley and Sons, New York, 1981 [8] Terzaghi, K. and Peck, R. B., “Soil Mechanics in Engineering Practice”, John Wiley & Sons, New York, 1967. [9] Beg M.A., Zhang Z., and Hudson W.R. (1998). “A Rational Pavement Type Selection Procedure” Report No:FHWA/TX-04/0-1734-S, Austin, TX [10]Berthelot et al. (1996). “Mechanistic-Probabilistic Vehicle Operating Cost Model” Journal of Transportation Engineering Vol:122 No:5, pp 337-341 [11] CDOT (2000). “Life Cycle Cost Analysis State-of-the-Practice” Report No:CDOT-R1-R-00-3, Colorado Department of Transportation, Aurora, CO [12] Chacko G.K. (1991) “Decision-making under uncertainty: an applied statistics approach” Praeger, New York [13]Christensen P.N., Sparks, G.A., and Kostuk K.J. (2005). “A method-based survey of life cycle costing literature pertinent to infrastructure design and renewal” Canadian Journal of Civil Engineering, Vol. 32: 250–259,Saskatoon, Canada [14]Cross S.A., and Parsons, R.L. (2002). “Evaluation of Expenditures on Rural Interstate Pavements in Kansas”, 81th Annual TRB Meeting, Washington, DC [15]Daniels G., Stockton W. R., and Hudley R. (2000). “Estimating Road User Costs Associated with Highway Construction Projects-Simplified Method” In Transportation Research Record: Journal of the Transportation Research Board, No. 1732, Washington DC, 2000, pp. 70-79 [16] Danish Road Institute (2002). “Economic Evaluation of Pavement Maintenance, PAV-ECO” Report 114, Denmark [17] Dewan, S.A., and Smith R. E. (2002). “Estimating International Roughness Index from Pavement Distress to Calculate Vehicle Operating Costs for the San Francisco Bay Area”. In Transportation Research Record: Journal of the Transportation Research Board, No. 1816, pp. 65-72, Washington, DC [18]FHWA (1999). “Asset Management Primer”, Office of Asset Management, Washington, DC [19] FHWA (2003). "Economic Analysis Primer", Office of Asset Management, Washington, DC [20]FHWA (2004). “Life-Cycle Cost Analysis, RealCost User Manual” Office of Asset Management, Washington, DC