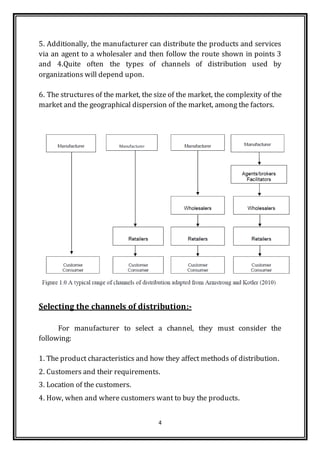
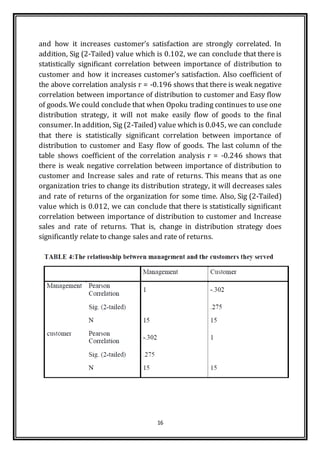
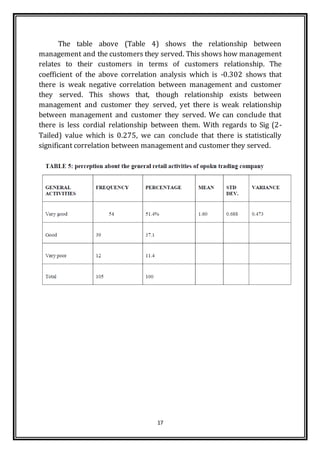
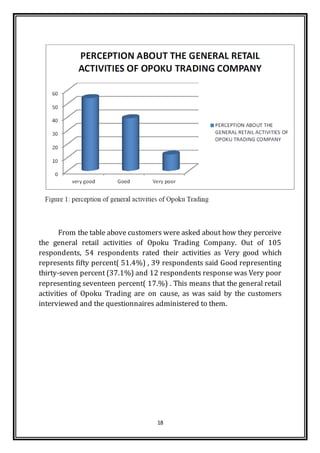
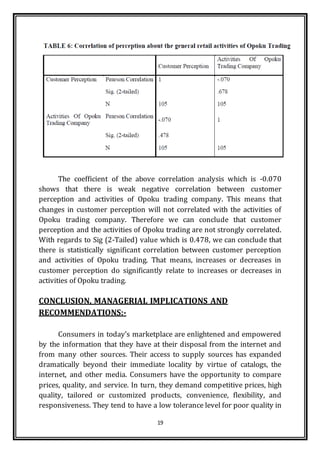
SlideShare a Scribd company logo
1
EFFECTIVE DISTRIBUTION MANAGEMENT
ABSTRACT:
Distribution plays a key role within the marketing mix, and the key to
success is its successful integration within the mix, ensuring that customers
get their products at the right place and at the right time. If the product
cannot reach its chosendestinationat the appropriate time, thenit can erode
competitive advantage and customer retention. The purpose of this paper is
to explore the best distribution strategy and other factors that help the
organization meet customer expectations in respect of delivery and service
promises the organization might make. The paper was qualitative and
empirical data were collected through questionnaire and in-depth interview.
SPSS was used in analyzing the data gathered from the sample (105
respondents). The study revealed that the best distribution strategy depends
on the target market and the operational environment. It also indicated that
the emergence and explosion of the internet and other information
communication technologies has greatly affected distribution. The study
concludes that effective distribution requires a high degree of management
skill, synchronization and integrationwith the overall organization, as it will
be one of the major components in achieving a sustainable competitive
advantage.
INTRODUCTION:
For any organization to be effective there should be effective
distribution management process to convey finished products from the
manufacturer to the final consumers. This is because without distribution
the best product will not be delivered and the marketing mix will break
down and fail. As a result of this, firms are increasingly adopting supply
chain management to reduce cost, increase market share and sales, and
build solid customer relations (Ferguson 2000). Supply chain management
can be viewed as a philosophy based on the belief that each firm in the
supply chain directly and indirectly affects the performance of all the other
supply chain members, as well as ultimately, overall supply chain
performance (Cooper et al, 1997). The effective use of this philosophy
2
requires that functional and supply-chain partner activities are aligned
with company strategy and harmonized with organizational structure,
processes, culture, incentive and people (Abell 1999). Distribution channel
consists of a group of individuals or organizations that assist in getting the
product to the right place at the right time. Distribution plays a vital role,
primarily because it ultimately affects the sales turnover and profitmargins
of the organization. If the product cannot reach its chosen destination at
the appropriate time, then it can erode competitive advantage and
customer retention. The retail industry isresponsible for the distribution of
finished products to the consumer as well as the public. The retail sector
comprises of general retailers (managed by individuals/families),
departmentalstores, specialty stores and discount stores. In practice, many
organizations use a mix of different channels; in particular, they may
complement a direct salesforce, calling on the larger accounts, with agents,
covering the smaller customers and prospects. However, the major
challenge now facing the retail industry is the power of the customers or
buyers. This is because the customers are becoming increasingly
knowledgeable, impatient, not wishing to wait for the suppliers’ products
for any period of time. This coupled with the fact that firms are now trying
to implement specific distribution strategy or practices based upon their
unique set of competitive priorities and business conditions to achieve the
desired level of performance, has led to an investigation into the various
distribution strategies and practices available with the view to establish the
strategy or practice which has the most influence on retail performance in
Ghana. The purpose of this exploratory study is to investigate the
relationship between distribution strategy and practice and retail
performance in the Fast Moving Consumer Goods in Ghana using Poku
Trading as a case. To do this, the paper is divided into five sections. This
introduction is followed by the review of related literature. Research
method and data analysis follow the literature review. The last section of
the paper looks at conclusion and recommendation.
LITERATURE REVIEW
Theoretical Framework:-
3
Most producersuse intermediaries to bring their products to market.
They use a set of interdependent organizations in the process of making a
product or service available for use or consumption by the consumer or
business user. This process is what has been known as distribution channel
(Philip Kotler 2001). Weiss and Gershon (2002) noted that, distribution
describes all the logistics involved in delivering a company's products or
services to the right place, at the right time, for the lowest cost. In the
unending efforts to realize these goals, the channel of distribution selected
by a business play a vital role in this process. Well-chosen channel
constitute a significant competitive advantage, while poorly conceived or
chosen channel can doom even a superior product or service to failure in
the market. Effective distribution provides customers with convenience in
the form of availability (what, where, when - the right product, at the right
place, at the right time), access (customers' awareness of the availability
and authorization to purchase), and support (e.g. pre-sales advice, sales
promotion and merchandising, post-service repairs).
The Distribution Channel and the Customer:-
There are many variations in respect of the distribution channel
structure however, intermediaries be deemed as appropriate in the
business environment, the following channel structures would be available
to you:
1. Passing of goods and services direct from the manufacturer to the
consumer.
2. Passing of goods and services via a retailer and then on to a consumer.
3. Passing of goods and services from the manufacturer via a wholesaler
and then directly on to the consumer.
4. Passing of goods and services from manufacturer via a wholesaler, then
on the retailer and consequently on to the consumer.
4
5. Additionally, the manufacturer can distribute the products and services
via an agent to a wholesaler and then follow the route shown in points 3
and 4.Quite often the types of channels of distribution used by
organizations will depend upon.
6. The structures of the market, the size of the market, the complexity of the
market and the geographical dispersion of the market, among the factors.
Selecting the channels of distribution:-
For manufacturer to select a channel, they must consider the
following:
1. The product characteristics and how they affect methods of distribution.
2. Customers and their requirements.
3. Location of the customers.
4. How, when and where customers want to buy the products.
5
5. The cost of distribution.
6. The legal and regulatory constraints of the distribution.
These are important issues and require significant levels of analysis
in order to gain an understanding of the situation. Clearly some of these
issues will form the basis of the marketing audit. Ideally the marketing mix
has a clear focus on achieving customer satisfaction and achieving the
profit objectives of the organization. Supermarkets have moved away from
just supplying food-based products to include fashions, music, electrical
goods, cosmetics, etc. All of this is focused on meeting all of the above
distribution factors. There are two perspectives of intermediary selection,
the strategic perspective and the operational perspective: strategic in
relation to looking at the ‘bigger picture’ and ‘operational’ looking at the
ability to implement the strategic marketing plan and distribution
strategy.(Armstrong& Kotler 2010).
Channel strategy:-
There are three types of market coverage:
1. Intensive
2. Selective
3. Exclusive
Intensive distribution means that as may available outlets as
possible hold this product, e.g. chocolate, newspapers, bread, etc. Intensive
distribution will mean convenience to the customer and increase customer
satisfaction. The sale of groceries in petrol and service stations is an
example of how intensive distribution has grown (Bowersox eta’l 1986).
Key characteristics include:
1. Maximum number of outlets covered to maximizeavailability.
2. Target outlets in as many as geographical regionsas possible.
3. Consumer convenienceproducts.
6
4. High number of purchasers.
5. High purchasefrequency.
6. Impulsivepurchase.
7. Low price.
Selective distribution is different in that some products are only
available from some outlets, e.g. electrical appliances, certain brands of
clothes and fashion products. Key characteristics include:
1. Medium levelof customers – but likely to be significant.
2. Less intensivedistribution of outlets.
3. Retailers may requirespecialist knowledge.
4. Shoppingbased products.
5. Medium number of shoppers.
6. Purchase is occasional.
7. Purchase is more likely to be planned.
8. Medium price.
Exclusive distribution is where possibly only one outlet in a certain
geographic area supplies a product. This method of distribution usually
relates to specialty products, e.g. special cars, specialist clothing, etc. often
exclusive distribution is relevant to niche products. Key characteristics
include:
1. Relatively few customers
2. Limited retail outlets
3. Close retailer/customer relationship
4. Special products
5. Infrequentpurchase
6. High involvementand planned purchase
7. High price
7
Channel decisions:-
There are six basic channel decisions to make. These are:
1. Whether to distribute direct to the customer or indirectly through
middlemen The advantages of going direct are that it enables firms to
exercise more control over marketing activities and it reduces the amount
of time spent in the channel. The disadvantages are that it is difficult to
obtain widespread distribution and more resources are required to
maintain distribution. Going direct is the method widely used by industrial
goods producers. In the case of consumer goods, examples of going direct
to the customer are to be found in marketing cosmetics and encyclopedias.
(Proctor 2001a).
2. Whether to adopt single or multiple channels of distribution The
advantages of using a single channel are that it guarantees a minimum level
of sales and the exclusivity of using a single channel guarantees attention to
the product. In the first case, intermediaries can be asked to accept a
minimum non-returnable order quantity. In the second case, the fact that a
product is only available from very specific outlets suggests that it is
difficult to obtain because it is exclusive. The harder it is to get, the more
people will want to know about it—or so the argument goes. On the other
hand, the disadvantage of using exclusivity is that it does limit sales.
(Proctor 2001b).
In contrast, the use of multiple channels should lead to increased sales and
a potential for wider distribution. It must be argued that the more
establishments put the product on view, the more likely it is that sales will
be substantial. Restricting the number of channels through which the
product is sold, restricts the number of people who can come into contact
with the product. On the other hand, there are disadvantages with using
multiple channels. First, greater investment, more sales people in the field,
more marketing effort in general and more administration are required.
(Proctor2001 c)
8
3. How long the channel of distribution should be? In determining the best
channel length to adopt, the followingfactors have to be taken into account:
(a) The financial strength of the producer—those in a strong position can
carry out the functions provided by intermediaries.
(b) Size and completeness of the product line—the costs of carrying out the
distribution function can be spread across the various items in the product
line. The more items, the more economical it might be to consider a shorter
distribution channel.
(c) The average order size—large orders may be distributed direct to
customers.
(d) The geographical concentration of customers—geographically
dispersed customers merit a longer distribution channel since servicing
them requires substantial investment of resources.
(e) The distance of the distributor from the market—geographical distance
makes it less attractive for the producer to want to supply direct.
( Ballou 1992) The above are guidelines and of course exceptions may be
encountered in practice.
4. The types of intermediaries to use. This effectively means choosing
between different types of retailer in the case of consumer goods, e.g.
supermarkets as opposed to cash and carry, and different types of
distributor in the case of industrial goods, e.g. whether to use franchised
dealerships or not.
5. The number of distributors to use at each level.
In principle, more distributors are required if:
(a) The unit value of the product is low and/or the physical quantity of
stock held is likely to be high.
(b) The product is purchased frequently.
(c) There is a high degree of technological complexity in the product.
(d) The service requirement is high.
(e) The inventory investment is high.
(f) Geographic concentration is low.
9
(g) Total market potential is high.
(h) The market share of the producer is high.
(i) Competition is intense(Goddard 1982)
6. Which intermediaries to use:
This is a qualitative decision and reflects whether the image of the
particular outlet, the way in which it performs and the deals which can be
struck with the distributor are satisfactory. It may mean choosing C&A
rather than Marks and Spencer, or Tesco rather than Finefare. Even when
strategies have been selected they have to be implemented and this
involves producers and intermediaries working together in the most
effective manner. (Proctor 2001d).
Physical distribution management (PDM):-
Physical distribution management (PDM) is the term used to
describe the management of every part of the distribution process. PDM
can be contracted out to a specialist or is best developed as a specialist
function within the organization. It is the process which ensure that the
correct customer within a given timescale, as cost-effectively as possible
(Little and Marandi2003). Part of PDM would include being aware of what
your competitors are offering, as suggested above.
Elementsfor consideration would include:
1. Costs involved
2. Methods of transport – road, rail, plane, shipping, etc.
3. Routes used
4. Stock, storage and stock control
5. Protection and delivery of stock
6. Timing – a key element
7. Evaluatingthe effectiveness of methods of distribution and being aware
of other alternatives.
10
Distribution is an integral part of the marketing mix. With the right
distribution strategy in place that is with the right mode of delivery the
right speed of delivery to the appropriate place of purchase, customer
satisfaction can be significantly increased. Failure to deliver these practical
pointswill result in the loss of ordersand income to the company and long-
term customer loyalty will decline (Drummond and Ensor 2001).
The key objective of PDM is to find the most cost-effective way of
meeting customer needs in relation to purchasing their product, whoever
they are and wherever they are.
Physical distribution management includes the following functions:
1. Customer services.
2. Order processing.
3. Materials handling.
4. Warehousing.
5. Stock/inventory management.
6. Transportation.
The key success factors of physical distribution management include
all elements of the marketing mix:
1. Product characteristics – how do they affect delivery requirements?
2. Packaging – can the product be transported?
3. Pricing – how much does distribution add to the cost of the product?
4. Promotional campaigns – creating an awareness of the product and
where and how it can be purchased.
5. Timing is a critical element of PDM, as many co
6. Companies work on the delivery of materials and components on a ‘Just
in Time’ basis (JIT).
11
JIT is just as it sounds; it means that the manufacturer of products, or
the supplier of raw materials, must deliver the necessary material or
components as and when required. For example, a window manufacturer,
who makes windows for office buildings, will be making windows to order
and will be require to deliver them at certain periodic times in the
construction of the building. Because storing glass and the metal or plastic
structures is difficult, the organization will deliver as and when the office
block construction company needs it. The concept of JIT was developed to
encourage maximized efficiency of manufacturing. The process will reduce
the storage space requirements, which is a direct cost saving to the
organization, but it also means that the organization will only pay for the
materials when they have taken delivery of them, rather than in a bulk
order at the beginning of the contract. Both save significant amounts of
money, which means that the cost saving can be passed onto the customer,
making products cheaper to purchase. JIT is much linked to qualify
applications and improvements. Should the organization take a mass
delivery of a component, and leave stock standing around, it could be
damaged or problems with the delivery may not be discovered until it is
too late. Therefore, quality assurance controls and measures can be
implemented as the components are dispatched which then aids the quality
improvement process. This then enables organization to work towards
zero defects, which means zero wastage of time and material, which means
cost effectiveness and quality improvement and ultimately a higher level of
customer satisfaction. Within the retail sector, JIT plays the same sort of
role. You will note that retail outlets very rarely run out of standards of
stock products, because they have good stock control processes and
systems that enable JIT delivery of those stock items (Joan Feldman 1984).
Most retailers now work with electronic point of sale system (EPOS). EPOS
registers your purchase at the point of sale, i.e. the payment checkout. The
product is scanned into the computer as sold and the computer
automatically registers this as a stock reduction. When the stock reduction
reaches a certain minimum level, the computer automatically generates a
message to place a stock order for that particular product to be in store by
a certain delivery date. The EPOS system allows retailers to monitor
frequency of purchase of certain products, which then enables them to
forecast demand of their stock products. This in turn helps them plan for
12
their stock requirement and come to appropriate agreements with their
suppliers on delivery and storage requirements (Jobber 2001).
RESEARCH METHODOLOGY:-
The research was inductive rather than standard quantitative survey
(deductive). This is due to the fact that the research seeks to build theory
rather than theory testing. In as much as this study aims at exploring the
best distribution strategy and its impact on competitiveness, its success
depends on perceptions of social actors within the stated specific context,
that is, upon how managers, customers and employees perceive the
concept of distribution management. Following grounded theory tradition,
the research started by explaining the methodology and research
perspective (Locke, 2000). The knowledge gained was then discussed in
the context of the literature. A review was conducted of the existing
literature, including how physical distribution management affects retail
operations (Ambler, 2003; Feldwick, 2002; Keller, 2003). Questionnaire
and interviews were used to collect all the necessary data from the
management, customers and employees of Opku Trading. These
respondents were chosen because they are well positioned to provide the
needed data for the research. They were selected by virtue of their
qualification, experience and their expertise in the area of corporate
governance. With regards to the questionnaire, both open-ended and close-
ended questions were used. This question style was adopted because it
facilitates ease understanding on the part of the respondents. It also
enables the researcher to have a direct visual impression of the trend of
events. The questionnaires were given to customers personally and those
who cannot read or write were assisted to fill. The first part of the
questionnaire contains questions on the organization and respondents’
characteristics. The second part of the questionnaire examine distribution
strategies, attitude and perception of customers and management using
three-point scale of 3-very good,2- good and 1 very poor. A total of one
hundred usable questionnaires were completed and used for the analysis.
In order to make the study detailed and concrete, a total number of one
hundred and five respondents made up of management, customers and
employees from Opoku Trading. Besides the questionnaire, the
13
respondents were interviewed (convergent depth interview) with a topic
guide and their responses transcribed. To get this respondents (sample-
105), purposive and quota sampling techniques were used. That is, the
selection of the respondents to be interviewed will be as a matter of
necessity. These techniques were used because they help in saving cost and
the cost saving may be used to improve the quality of the research through
increasing sample size. Again, the data, when compared to random
methods which are perhaps double the cost, has been proved to be
acceptable provided that the research is managed effectively. To gain an
indepth knowledge into the nature of distribution management, the
respondents were selected by triangulating (Flick, 1998; Blaikie, 1991).
Statistical tools or normal distribution curves and software packages such
as SPSS was used to analyze the data.
PRESENTATION, ANALYSIS AND FINDING(S) FROM DATA:-
Data collected from questionnaires and interviews were analyzed
accurately in this section. A total of one hundred and five (105)
questionnaires were administered to customers for their views. Those who
were unable to write were interviewed using the questionnaires as a guide.
TABLE 1: AGES OF RESPONDENTS:-
Source: Field Survey (Opoku Trading Company), August, 2012
Due to customers’ differences, the researcher targeted its customers
on their age group to know the impact that distribution have on the
14
purchasing behavior of Opoku Trading Company in the Kumasi Depot.
Table 1 indicates that 58 of the respondents fall within the ages of 18-24
years, 38 respondents’ fall within 25-34years, and 15 respondents’ fall
above 35 years. Therefore, it indicates greater number of respondent fall
within 18 to 24 yearswhich represents49 .5% and fellow by 25 to 34 years
which represent 36%. It is assumed that majority of the respondent fall
within the working force since the youth are also part of the force. And also
the mean of the respondent age was 1.65 it shows that average age of
respondent is between 18 and 26 ages. The standard deviation of their age
was 0.720 variance was 0.519
TABLE 2: The regression and correlation analysis of
respondents’ knowledge of distribution strategies:-
B Dependent Variable: intensive, selective, exclusive
** Correlation is significant at the 0.01 level (2-tailed).
Source: Field Survey (Opoku Trading Company), August, 2012
15
As shown in Table, a Pearson correlation coefficient of the test
indicates a strong positive relationship between the customers
understanding and distribution strategy (intensive distribution). As
indicate in the above table that (r= 0.779, p<.01). This means that changes
in distribution strategy will correlate with customer understanding. In
addition, Sig (2-Tailed) value which is 0.03, we can conclude that there is
statistically significant correlation between customers understanding and
distribution strategy (intensive distribution). The coefficient of the above
correlation analysis r = 0.572 shows that there is strong positive
correlation between customers understanding about distribution strategy
(selective distribution). This means that customer has knowledge about
selective distribution strategy. In addition, Sig (2-Tailed) value which is
0.021, we can conclude that there is statistically significant correlation
between customers understanding and selective distribution strategy. As
determined by one-way ANOVA (F= 156.77, p = .001), there is a statistically
significant differencebetween customers knowledge or understanding and
distribution strategy (intensive distribution).
TABLE 3: Correlations between distribution and its
importance to the firm:-
The coefficient of the above correlation analysis which is 0.160
shows that there is weak positive correlation between importance of
distribution to customer and how it increases customers satisfaction.
Therefore we could conclude that importance of distribution to customer
16
and how it increases customer’s satisfaction are strongly correlated. In
addition, Sig (2-Tailed) value which is 0.102, we can conclude that there is
statistically significant correlation between importance of distribution to
customer and how it increases customer’s satisfaction. Also coefficient of
the above correlation analysis r = -0.196 shows that there is weak negative
correlation between importance of distribution to customer and Easy flow
of goods. We could conclude that when Opoku trading continues to use one
distribution strategy, it will not make easily flow of goods to the final
consumer. In addition, Sig (2-Tailed) value which is 0.045, we can conclude
that there is statistically significant correlation between importance of
distribution to customer and Easy flow of goods. The last column of the
table shows coefficient of the correlation analysis r = -0.246 shows that
there is weak negative correlation between importance of distribution to
customer and Increase sales and rate of returns. This means that as one
organization tries to change its distribution strategy, it will decreases sales
and rate of returns of the organization for some time. Also, Sig (2-Tailed)
value which is 0.012, we can conclude that there is statistically significant
correlation between importance of distribution to customer and Increase
sales and rate of returns. That is, change in distribution strategy does
significantly relate to change sales and rate of returns.
17
The table above (Table 4) shows the relationship between
management and the customers they served. This shows how management
relates to their customers in terms of customers relationship. The
coefficient of the above correlation analysis which is -0.302 shows that
there is weak negative correlation between management and customer
they served. This shows that, though relationship exists between
management and customer they served, yet there is weak relationship
between management and customer they served. We can conclude that
there is less cordial relationship between them. With regards to Sig (2-
Tailed) value which is 0.275, we can conclude that there is statistically
significant correlation between management and customer they served.
18
From the table above customers were asked about how they perceive
the general retail activities of Opoku Trading Company. Out of 105
respondents, 54 respondents rated their activities as Very good which
represents fifty percent( 51.4%) , 39 respondents said Good representing
thirty-seven percent (37.1%) and 12 respondents response was Very poor
representing seventeen percent( 17.%) . This means that the general retail
activities of Opoku Trading are on cause, as was said by the customers
interviewed and the questionnaires administered to them.
19
The coefficient of the above correlation analysis which is -0.070
shows that there is weak negative correlation between customer
perception and activities of Opoku trading company. This means that
changes in customer perception will not correlated with the activities of
Opoku trading company. Therefore we can conclude that customer
perception and the activities of Opoku trading are not strongly correlated.
With regards to Sig (2-Tailed) value which is 0.478, we can conclude that
there is statistically significant correlation between customer perception
and activities of Opoku trading. That means, increases or decreases in
customer perception do significantly relate to increases or decreases in
activities of Opoku trading.
CONCLUSION, MANAGERIAL IMPLICATIONS AND
RECOMMENDATIONS:-
Consumers in today’s marketplace are enlightened and empowered
by the information that they have at their disposal from the internet and
from many other sources. Their access to supply sources has expanded
dramatically beyond their immediate locality by virtue of catalogs, the
internet, and other media. Consumers have the opportunity to compare
prices, quality, and service. In turn, they demand competitive prices, high
quality, tailored or customized products, convenience, flexibility, and
responsiveness. They tend to have a low tolerance level for poor quality in
20
products and or service. However, this is not the case of Opoku Trading as
the finding indicated that management has not done well to establish
cordial relationship with their customers. The paper also indicated that
there is statistically significant correlation between distribution and
customer satisfaction, easy flow of goods and sales. Again, the analysis and
discussions also indicated that most of the customers are between the ages
of 18 and 24 meaning they are youth who are fascinated by technology.
Besides, they also constitute the working population and do not have the
time to go to the shop floor to buy but prefer to shop online. However,
because the extent to which customers become satisfied and remain with a
particular supplier depends on how easily goods and information flow to
them, and how their specific needs are met promptly and with ease, one
can conclude that very soon most of Opoku Trading’s customers if not all
will switch because the company has not done enough to keep them. Again,
judging from the findings, one can say that the profit level of the company
will soon dwindle which can even lead to its collapse. From the above, I will
recommend that management of Opoku Trading should set up a very
efficient customer service department responsible for customer
satisfaction and complaints. They should also conduct frequent survey to
track. Customer satisfaction levels and effect remedial measures if the need
be. In as much as majority of the customer are workers and youth, Opoku
Trading should involve themselves in internet marketing and other social
media to provide convenience and 24 hour service to their customers. As a
result of this, there must be a high degree of management skill,
synchronization and integration with the overall organization, as it will be
one of the major components in achieving a sustainable competitive
advantage.
MANAGING EFFECTIVE DISTRIBUTION OF CHANNELS:-
Channelsof distribution moveproductsand services from businesses
to consumers and to other businesses. Also known as marketing channels,
channels of distribution consist of a set of interdependent organizations
21
involved in making a product or service available for use or consumption.
Channel members are assigned a set of distribution tasks by those
responsible for channel management.
For many products and services, their manufacturers or providers
use multiple channels of distribution. Personal computers, for example,
might be bought directly from the manufacturer—over the telephone, via
direct mail, or through the company's web site on the Internet —or
through several kinds of retailers, including independent computer stores,
franchised computer stores, and department stores. In addition, large and
small businesses may make their purchases through other outlets.
Channel structures range from two to five levels. The simplest is a
two-level structure in which goods and services move directly from the
manufacturer or provider to the consumer. Two-level structures occur in
some industries where consumers are able to order products directly from
the manufacturer and the manufacturer fulfills those orders through its
own physical distribution system.
In a three-level channel structure retailers serve as intermediaries
between consumers and manufacturers. Retailers order products directly
from the manufacturer, then sell those productsdirectly to the consumer. A
fourthlevel is added when manufacturers sell to wholesalers rather than to
retailers. In a four-level structure retailers order goods from wholesalers
rather than manufacturers. Finally, a manufacturer's agent can serve as an
intermediary between the manufacturer and its wholesalers, making a five-
level channel structure consisting of the manufacturer, agent, wholesale,
retail, and consumer levels. A five-level channel structure might also
consist of the manufacturer, wholesale, jobber, retail, and consumer levels,
whereby jobbers service smaller retailers not covered by the large
wholesalers in the industry.
BENEFITS OF INTERMEDIARIES IN CHANNELS OF
DISTRIBUTION:-
If selling from the manufacturer to the consumer were always the
most efficient way, there would be no need for channels of distribution.
Intermediaries, however, provide several benefits to both manufacturers
22
and consumers: improved efficiency, a better assortment of products,
routinization of transactions, and easier searching for goods as well as
customers.
The improved efficiency that results from adding intermediaries in
the channels of distribution can easily be grasped with the help of a few
examples. In the first examplethere are 5 manufacturersand 20 retailers. If
each manufacturer sells directly to each retailer, there are 100 contact
lines—one line from each manufacturer to each retailer. The complexity of
this distribution arrangement can be reduced by adding wholesalers as
intermediaries between manufacturers and retailers. If a single wholesaler
serves as the intermediary, the number of contacts is reduced from 100 to
25—5 contact lines between the manufacturers and the wholesaler, and 20
contact lines between the wholesaler and the retailers. Reducing the
number of necessary contacts brings more efficiency into the distribution
system by eliminating duplicate efforts in ordering, processing, shipping,
etc.
In termsof efficiency there is an effect of diminishingreturnsas more
intermediaries are added to the channels of distribution. If, in the example
above, there were 3 wholesalers instead of only 1, the number of essential
contacts increases to 75: 15 contacts between 5 manufacturers and three
wholesalers, plus 60 contacts between 3 wholesalers and 20 retailers. Of
course this example assumes that each retailer would order from each
wholesaler and that each manufacturer would supply each wholesaler. In
fact geographic and other constraints might eliminate some lines of contact,
making the channels of distribution more efficient.
Intermediaries provide a second benefit by bridging the gap between
the assortment of goods and services generated by producers and those in
demand from consumers. Manufacturers typically produce many similar
products, while consumers want small quantities of many different
products. In order to smooth the flow of goods and services, intermediaries
perform such functions as sorting, accumulation, allocation, and creating
assortments. In sorting, intermediaries take a supply of different items and
sort them into similar groupings, as exemplified by graded agricultural
products. Accumulation means that intermediaries bring together items
23
from a number of different sources to create a larger supply for their
customers. Intermediaries allocate products by breaking down a
homogeneous supply into smaller units for resale. Finally, they build up an
assortment of products to give their customers a wider selection.
A third benefit provided by intermediaries is that they help reduce
the cost of distribution by making transactions routine. Exchange
relationships can be standardized in terms of lot size, frequency of delivery
and payment, and communications. Seller and buyer no longer have to
bargain over every transaction. As transactions become more routine, the
costs associated with those transactions are reduced.
The use of intermediaries also aids the search processes of both
buyers and sellers. Producers are searching to determine their customers'
needs, while customers are searching for certain products and services. A
degree of uncertainty in both search processes can be reduced by using
channels of distribution. For example, consumers are more likely to find
what they are looking for when they shop at wholesale or retail institutions
organized by separate lines of trade, such as grocery, hardware, and
clothing stores. In addition producers can make some of their commonly
used products more widely available by placing them in many different
retail outlets, so that consumers are more likely to find them at the right
time.
WHAT FLOWS THROUGH THE CHANNELS OF DISTRIBUTION:-
Members of channels of distribution typically buy, sell, and transfer
title to goods. There are, however, many other flows between channel
membersin addition to physical possession and ownership of goods. These
include promotion flows, negotiation flows, financing, assuming risk,
ordering, and payment. In some cases the flow is in one direction, from the
manufacturer to the consumer. Physical possession, ownership, and
promotion flow in one direction through the channels of distribution from
the manufacturer to the consumer. In other cases there is a two-way flow.
Negotiations, financing, and the assumption of risk flow in both directions
between the manufacturer and the consumer. Ordering and payment are
24
channel flows that go in one direction, from the consumer to the
manufacturer.
There are also a number of support functions that help channel
members perform their distribution tasks. Transportation, storage,
insurance, financing, and advertising are tasks that can be performed by
facilitating agencies that may or may not be considered part of the
marketing channel. From a channel management point of view, it may be
more effective to consider only those institutions and agencies that are
involved in the transfer of title as channel members. The other agencies
involved in supporting tasks can then be described as an ancillary or
support structure. The rationale for separating these two types of
organizations is that they each require different types of management
decisions and have different levels of involvement in channel membership.
Effective managementof the channels of distribution involves forging
better relationships among channel members. With respect to the task of
distribution, all of the channel members are interdependent. Relationships
between channel members can be influenced by how the channels are
structured. Improved performance of the overall distribution system is
achieved through managing such variables as channel structure and
channel flows.
BENEFITS OF SUPPLY CHAIN MANAGEMENT:-
Supply chain management is concerned with managing the flow of
physical goods and associated information from initial sourcing to
consumption. One benchmarking study showed that best-practice supply
chain management companies enjoyed a 45 percent total supply chain cost
advantage over their median competitors. Bottom-line benefits included: I)
reduced costs relating to inventory management, transportation, and
warehousing; 2) improved service using techniques such as time-based
delivery; and 3) enhanced revenues through greater product availability
and more customized products.
Some companies contract out the task of supply chain management to a
specialized service firm. The supply chain management firm typically
provides vertical market expertise, transaction processing capabilities, and
25
business consulting services, allowing the company to focus on its core
competencies. In addition to reducing costs, effective supply chain
management can result in enhanced supplier relations and greater
customer satisfaction through timely deliveries and accurate responses to
customer inquiries.
TREND TOWARD CONSOLIDATION OF DISTRIBUTION
CHANNELS:-
In some industries there has been a noticeable trend toward
consolidation of distribution channels. Through mergers and acquisitions
some companies have achieved ownership of two or more channels of
distribution, as when a distributor or wholesaler acquires a retailer. As a
result of this type of consolidation, channel members who are closest to the
consumer, such as retailers, have acquired more control. Historically, it was
the manufacturer who invented and controlled the channels of distribution.
Now, end-user dominated channels are replacing those invented and
controlled by the manufacturer. One example has been the explosion of
discount outlet malls, which obtain high-image products directly from
manufacturers and sell them at a discount.
Manufacturers have countered that trend by opening historically
closed channels of distribution. That has made the lines of distinction
between manufacturers, retailers, and direct-to-consumer sellers less clear.
Manufacturers such as Apple Computer and Nike have opened their own
retail outlets, thus blurring the line that once separated manufacturers
from retailers. The distinction between retailers and direct-to-consumer
sellers, or catalogers, has also become blurred as companies such as Eddie
Bauer, Spiegel, and Victoria's Secret build one brand across both channels.
In addition, some catalog companies such as J. Crew and Lands' End have
opened retail outlets. The overall result is that there are new channel
options for marketers to consider.

More Related Content

What's hot

Supply and demand management in services
Supply and demand management in servicesSupply and demand management in services
Supply and demand management in servicesShwetanshu Gupta
 
Sales Forecasting
Sales ForecastingSales Forecasting
Sales Forecasting
Amitabh Mishra
 
Samsung Galaxy Presentation
Samsung Galaxy PresentationSamsung Galaxy Presentation
Samsung Galaxy PresentationJessica Walsh
 
Advertising - Strong vs. Weak
Advertising - Strong vs. WeakAdvertising - Strong vs. Weak
Advertising - Strong vs. WeakDeniz Kurugöllü
 
Sales Promotions
Sales PromotionsSales Promotions
Sales Promotionsprahladk
 
Cultural impact on advertising
Cultural impact on advertisingCultural impact on advertising
Cultural impact on advertising
Minnie Wen
 
Service marketing trends 2011
Service marketing trends 2011Service marketing trends 2011
Service marketing trends 2011
MdS - Marketing de Servicios
 
Service Marketing
Service MarketingService Marketing
Service Marketingrobinslides
 
Product Differentiation
Product DifferentiationProduct Differentiation
Product Differentiation
Vidur Pandit
 
simple survey about Nokia Handset"
simple survey about Nokia Handset"simple survey about Nokia Handset"
simple survey about Nokia Handset"
Najeebhemat Malikzia
 
Economic effects and influences of advertisements among children
Economic effects and influences of advertisements among childrenEconomic effects and influences of advertisements among children
Economic effects and influences of advertisements among children
Amlin David
 
Managing relationship and building loyalty
Managing relationship and building loyalty Managing relationship and building loyalty
Managing relationship and building loyalty
Dr. Sneha Sharma
 
5. competitive dynamics
5. competitive dynamics5. competitive dynamics
5. competitive dynamics
Dr. Parveen Kaur Nagpal
 
Execution style for advertisement
Execution style for advertisementExecution style for advertisement
Execution style for advertisement
Sarfraz Ashraf
 
The Personal Selling Process
The Personal Selling ProcessThe Personal Selling Process
The Personal Selling Process
iqra ishfaq
 
Classification and Characteristics of a service
Classification and Characteristics of a serviceClassification and Characteristics of a service
Classification and Characteristics of a service
Sanchit
 
Online advertising case study unilever
Online advertising case study unileverOnline advertising case study unilever
Online advertising case study unileverMitya Voskresensky
 
Chapter 4
Chapter 4Chapter 4
Chapter 4ary_ase
 
Marketing Mix
Marketing MixMarketing Mix
Marketing Mix
Maxwell Ranasinghe
 

What's hot (20)

Supply and demand management in services
Supply and demand management in servicesSupply and demand management in services
Supply and demand management in services
 
Sales Forecasting
Sales ForecastingSales Forecasting
Sales Forecasting
 
Samsung Galaxy Presentation
Samsung Galaxy PresentationSamsung Galaxy Presentation
Samsung Galaxy Presentation
 
Advertising - Strong vs. Weak
Advertising - Strong vs. WeakAdvertising - Strong vs. Weak
Advertising - Strong vs. Weak
 
Sales Promotions
Sales PromotionsSales Promotions
Sales Promotions
 
Cultural impact on advertising
Cultural impact on advertisingCultural impact on advertising
Cultural impact on advertising
 
Service marketing trends 2011
Service marketing trends 2011Service marketing trends 2011
Service marketing trends 2011
 
Service Marketing
Service MarketingService Marketing
Service Marketing
 
Product Differentiation
Product DifferentiationProduct Differentiation
Product Differentiation
 
simple survey about Nokia Handset"
simple survey about Nokia Handset"simple survey about Nokia Handset"
simple survey about Nokia Handset"
 
Economic effects and influences of advertisements among children
Economic effects and influences of advertisements among childrenEconomic effects and influences of advertisements among children
Economic effects and influences of advertisements among children
 
Managing relationship and building loyalty
Managing relationship and building loyalty Managing relationship and building loyalty
Managing relationship and building loyalty
 
Distribution Strategy
Distribution StrategyDistribution Strategy
Distribution Strategy
 
5. competitive dynamics
5. competitive dynamics5. competitive dynamics
5. competitive dynamics
 
Execution style for advertisement
Execution style for advertisementExecution style for advertisement
Execution style for advertisement
 
The Personal Selling Process
The Personal Selling ProcessThe Personal Selling Process
The Personal Selling Process
 
Classification and Characteristics of a service
Classification and Characteristics of a serviceClassification and Characteristics of a service
Classification and Characteristics of a service
 
Online advertising case study unilever
Online advertising case study unileverOnline advertising case study unilever
Online advertising case study unilever
 
Chapter 4
Chapter 4Chapter 4
Chapter 4
 
Marketing Mix
Marketing MixMarketing Mix
Marketing Mix
 

Similar to EFFECTIVE DISTRIBUTION MANAGEMENT

Analysis of distribution channels in the pharmaceutical industry in ghana the...
Analysis of distribution channels in the pharmaceutical industry in ghana the...Analysis of distribution channels in the pharmaceutical industry in ghana the...
Analysis of distribution channels in the pharmaceutical industry in ghana the...
Alexander Decker
 
Channel management and physical distribution
Channel management and physical distributionChannel management and physical distribution
Channel management and physical distribution
Avinash Jolly
 
Project report on marketing mix and competitive analysis of pureit hul
Project report on marketing mix and competitive analysis of pureit hulProject report on marketing mix and competitive analysis of pureit hul
Project report on marketing mix and competitive analysis of pureit hulJitender Kumar
 
Consumer Behavior and Marketing StrategyChapter 1.docx
Consumer Behavior and Marketing StrategyChapter 1.docxConsumer Behavior and Marketing StrategyChapter 1.docx
Consumer Behavior and Marketing StrategyChapter 1.docx
maxinesmith73660
 
Journal study of the sales & distribution network of leading fmcg's
Journal study of the sales & distribution network of leading fmcg'sJournal study of the sales & distribution network of leading fmcg's
Journal study of the sales & distribution network of leading fmcg'sswarnabharay
 
Material in slides 2-14 of this overview adapted from Prin
Material in slides 2-14 of this overview adapted from PrinMaterial in slides 2-14 of this overview adapted from Prin
Material in slides 2-14 of this overview adapted from Prin
AbramMartino96
 
Material in slides 2-14 of this overview adapted from Prin
Material in slides 2-14 of this overview adapted from PrinMaterial in slides 2-14 of this overview adapted from Prin
Material in slides 2-14 of this overview adapted from Prin
AbramMartino96
 
Material in slides 2 14 of this overview adapted from prin
Material in slides 2 14 of this overview adapted from prinMaterial in slides 2 14 of this overview adapted from prin
Material in slides 2 14 of this overview adapted from prin
ADDY50
 
Market channel
Market channelMarket channel
Market channel
Mahadcarte
 
Vdis10047 marketing concepts pres1
Vdis10047 marketing concepts pres1Vdis10047 marketing concepts pres1
Vdis10047 marketing concepts pres1
Virtu Institute
 
Marketing concepts pres1
Marketing concepts pres1Marketing concepts pres1
Marketing concepts pres1Virtu Institute
 
6.4.pptx
6.4.pptx6.4.pptx
6.4.pptx
ShahriarAdib1
 
consumer Satisfaction
consumer Satisfaction consumer Satisfaction
consumer Satisfaction
Amit Pandey
 
1 INTRODUCTION CONSUMER BEHAVIOR.pptx
1 INTRODUCTION CONSUMER BEHAVIOR.pptx1 INTRODUCTION CONSUMER BEHAVIOR.pptx
1 INTRODUCTION CONSUMER BEHAVIOR.pptx
LuthfiAdriFaza
 
Marketing Chapter 10
Marketing Chapter 10Marketing Chapter 10
Marketing Chapter 10WanBK Leo
 
Consumer+behaviour+consumer+analysis+ch2
Consumer+behaviour+consumer+analysis+ch2Consumer+behaviour+consumer+analysis+ch2
Consumer+behaviour+consumer+analysis+ch2shrutika1991
 
Distribution management
Distribution managementDistribution management
Distribution management
Ms. Shery Asthana
 
Marketing concepts.pptx
Marketing concepts.pptxMarketing concepts.pptx
Marketing concepts.pptx
Virtu Institute
 

Similar to EFFECTIVE DISTRIBUTION MANAGEMENT (20)

Analysis of distribution channels in the pharmaceutical industry in ghana the...
Analysis of distribution channels in the pharmaceutical industry in ghana the...Analysis of distribution channels in the pharmaceutical industry in ghana the...
Analysis of distribution channels in the pharmaceutical industry in ghana the...
 
Channel management and physical distribution
Channel management and physical distributionChannel management and physical distribution
Channel management and physical distribution
 
Project report on marketing mix and competitive analysis of pureit hul
Project report on marketing mix and competitive analysis of pureit hulProject report on marketing mix and competitive analysis of pureit hul
Project report on marketing mix and competitive analysis of pureit hul
 
reshma
reshmareshma
reshma
 
Consumer Behavior and Marketing StrategyChapter 1.docx
Consumer Behavior and Marketing StrategyChapter 1.docxConsumer Behavior and Marketing StrategyChapter 1.docx
Consumer Behavior and Marketing StrategyChapter 1.docx
 
Journal study of the sales & distribution network of leading fmcg's
Journal study of the sales & distribution network of leading fmcg'sJournal study of the sales & distribution network of leading fmcg's
Journal study of the sales & distribution network of leading fmcg's
 
Material in slides 2-14 of this overview adapted from Prin
Material in slides 2-14 of this overview adapted from PrinMaterial in slides 2-14 of this overview adapted from Prin
Material in slides 2-14 of this overview adapted from Prin
 
Material in slides 2-14 of this overview adapted from Prin
Material in slides 2-14 of this overview adapted from PrinMaterial in slides 2-14 of this overview adapted from Prin
Material in slides 2-14 of this overview adapted from Prin
 
Material in slides 2 14 of this overview adapted from prin
Material in slides 2 14 of this overview adapted from prinMaterial in slides 2 14 of this overview adapted from prin
Material in slides 2 14 of this overview adapted from prin
 
Market channel
Market channelMarket channel
Market channel
 
Vdis10047 marketing concepts pres1
Vdis10047 marketing concepts pres1Vdis10047 marketing concepts pres1
Vdis10047 marketing concepts pres1
 
Marketing concepts pres1
Marketing concepts pres1Marketing concepts pres1
Marketing concepts pres1
 
6.4.pptx
6.4.pptx6.4.pptx
6.4.pptx
 
consumer Satisfaction
consumer Satisfaction consumer Satisfaction
consumer Satisfaction
 
1 INTRODUCTION CONSUMER BEHAVIOR.pptx
1 INTRODUCTION CONSUMER BEHAVIOR.pptx1 INTRODUCTION CONSUMER BEHAVIOR.pptx
1 INTRODUCTION CONSUMER BEHAVIOR.pptx
 
A new entrant rfid
A new entrant rfidA new entrant rfid
A new entrant rfid
 
Marketing Chapter 10
Marketing Chapter 10Marketing Chapter 10
Marketing Chapter 10
 
Consumer+behaviour+consumer+analysis+ch2
Consumer+behaviour+consumer+analysis+ch2Consumer+behaviour+consumer+analysis+ch2
Consumer+behaviour+consumer+analysis+ch2
 
Distribution management
Distribution managementDistribution management
Distribution management
 
Marketing concepts.pptx
Marketing concepts.pptxMarketing concepts.pptx
Marketing concepts.pptx
 

Recently uploaded

FullSail: HOF - Presentation Phil Pallen
FullSail: HOF - Presentation Phil PallenFullSail: HOF - Presentation Phil Pallen
FullSail: HOF - Presentation Phil Pallen
travisomalana
 
DMF Portfolio Piece Smart Goals - Artist Management.docx
DMF Portfolio Piece Smart Goals - Artist Management.docxDMF Portfolio Piece Smart Goals - Artist Management.docx
DMF Portfolio Piece Smart Goals - Artist Management.docx
TravisMalana
 
Traditional Store Audits are Outdated: A New Approach to Protecting Your Bran...
Traditional Store Audits are Outdated: A New Approach to Protecting Your Bran...Traditional Store Audits are Outdated: A New Approach to Protecting Your Bran...
Traditional Store Audits are Outdated: A New Approach to Protecting Your Bran...
Auxis Consulting & Outsourcing
 
The Old Oak - Press Kit - Cannes Film Festival 2023
The Old Oak - Press Kit - Cannes Film Festival 2023The Old Oak - Press Kit - Cannes Film Festival 2023
The Old Oak - Press Kit - Cannes Film Festival 2023
Pascal Fintoni
 
Turn Digital Reputation Threats into Offense Tactics - Daniel Lemin
Turn Digital Reputation Threats into Offense Tactics - Daniel LeminTurn Digital Reputation Threats into Offense Tactics - Daniel Lemin
Turn Digital Reputation Threats into Offense Tactics - Daniel Lemin
DigiMarCon - Digital Marketing, Media and Advertising Conferences & Exhibitions
 
Search Engine Marketing - Competitor and Keyword research
Search Engine Marketing  - Competitor and Keyword researchSearch Engine Marketing  - Competitor and Keyword research
Search Engine Marketing - Competitor and Keyword research
ETMARK ACADEMY
 
A Guide to UK Top Search Engine Optimization
A Guide to UK Top Search Engine OptimizationA Guide to UK Top Search Engine Optimization
A Guide to UK Top Search Engine Optimization
Brand Highlighters
 
Coca Cola Branding Strategy and strategic marketing plan
Coca Cola Branding Strategy and strategic marketing planCoca Cola Branding Strategy and strategic marketing plan
Coca Cola Branding Strategy and strategic marketing plan
Maswer Ali
 
Top 3 Ways to Align Sales and Marketing Teams for Rapid Growth
Top 3 Ways to Align Sales and Marketing Teams for Rapid GrowthTop 3 Ways to Align Sales and Marketing Teams for Rapid Growth
Top 3 Ways to Align Sales and Marketing Teams for Rapid Growth
Demandbase
 
My Personal Brand Exploration by Mariano
My Personal Brand Exploration by MarianoMy Personal Brand Exploration by Mariano
My Personal Brand Exploration by Mariano
marianooscos
 
Digital Commerce Lecture for Advanced Digital & Social Media Strategy at UCLA...
Digital Commerce Lecture for Advanced Digital & Social Media Strategy at UCLA...Digital Commerce Lecture for Advanced Digital & Social Media Strategy at UCLA...
Digital Commerce Lecture for Advanced Digital & Social Media Strategy at UCLA...
Valters Lauzums
 
May 2024 - VBOUT Partners Meeting Group Session
May 2024 - VBOUT Partners Meeting Group SessionMay 2024 - VBOUT Partners Meeting Group Session
May 2024 - VBOUT Partners Meeting Group Session
Vbout.com
 
SMM Cheap - No. 1 SMM panel in the world
SMM Cheap - No. 1 SMM panel in the worldSMM Cheap - No. 1 SMM panel in the world
SMM Cheap - No. 1 SMM panel in the world
smmpanel567
 
How to Run Landing Page Tests On and Off Paid Social Platforms
How to Run Landing Page Tests On and Off Paid Social PlatformsHow to Run Landing Page Tests On and Off Paid Social Platforms
How to Run Landing Page Tests On and Off Paid Social Platforms
VWO
 
ThinkNow 2024 Consumer Financial Wellness Report
ThinkNow 2024 Consumer Financial Wellness ReportThinkNow 2024 Consumer Financial Wellness Report
ThinkNow 2024 Consumer Financial Wellness Report
ThinkNow
 
De-risk Your Digital Evolution - Hannah Grap
De-risk Your Digital Evolution - Hannah GrapDe-risk Your Digital Evolution - Hannah Grap
How to use Short Form Video To Grow Your Brand and Business - Keenya Kelly
How to use Short Form Video To Grow Your Brand and Business - Keenya KellyHow to use Short Form Video To Grow Your Brand and Business - Keenya Kelly
How to use Short Form Video To Grow Your Brand and Business - Keenya Kelly
DigiMarCon - Digital Marketing, Media and Advertising Conferences & Exhibitions
 
Your Path to Profits - The Game-Changing Power of a Marketing - Daniel Bussius
Your Path to Profits - The Game-Changing Power of a Marketing - Daniel BussiusYour Path to Profits - The Game-Changing Power of a Marketing - Daniel Bussius
Your Path to Profits - The Game-Changing Power of a Marketing - Daniel Bussius
DigiMarCon - Digital Marketing, Media and Advertising Conferences & Exhibitions
 
Your Path to Profits - The Game-Changing Power of a Marketing OS for Your Bus...
Your Path to Profits - The Game-Changing Power of a Marketing OS for Your Bus...Your Path to Profits - The Game-Changing Power of a Marketing OS for Your Bus...
Your Path to Profits - The Game-Changing Power of a Marketing OS for Your Bus...
DigiMarCon - Digital Marketing, Media and Advertising Conferences & Exhibitions
 

Recently uploaded (20)

FullSail: HOF - Presentation Phil Pallen
FullSail: HOF - Presentation Phil PallenFullSail: HOF - Presentation Phil Pallen
FullSail: HOF - Presentation Phil Pallen
 
DMF Portfolio Piece Smart Goals - Artist Management.docx
DMF Portfolio Piece Smart Goals - Artist Management.docxDMF Portfolio Piece Smart Goals - Artist Management.docx
DMF Portfolio Piece Smart Goals - Artist Management.docx
 
Traditional Store Audits are Outdated: A New Approach to Protecting Your Bran...
Traditional Store Audits are Outdated: A New Approach to Protecting Your Bran...Traditional Store Audits are Outdated: A New Approach to Protecting Your Bran...
Traditional Store Audits are Outdated: A New Approach to Protecting Your Bran...
 
The Old Oak - Press Kit - Cannes Film Festival 2023
The Old Oak - Press Kit - Cannes Film Festival 2023The Old Oak - Press Kit - Cannes Film Festival 2023
The Old Oak - Press Kit - Cannes Film Festival 2023
 
Turn Digital Reputation Threats into Offense Tactics - Daniel Lemin
Turn Digital Reputation Threats into Offense Tactics - Daniel LeminTurn Digital Reputation Threats into Offense Tactics - Daniel Lemin
Turn Digital Reputation Threats into Offense Tactics - Daniel Lemin
 
Search Engine Marketing - Competitor and Keyword research
Search Engine Marketing  - Competitor and Keyword researchSearch Engine Marketing  - Competitor and Keyword research
Search Engine Marketing - Competitor and Keyword research
 
A Guide to UK Top Search Engine Optimization
A Guide to UK Top Search Engine OptimizationA Guide to UK Top Search Engine Optimization
A Guide to UK Top Search Engine Optimization
 
Coca Cola Branding Strategy and strategic marketing plan
Coca Cola Branding Strategy and strategic marketing planCoca Cola Branding Strategy and strategic marketing plan
Coca Cola Branding Strategy and strategic marketing plan
 
Top 3 Ways to Align Sales and Marketing Teams for Rapid Growth
Top 3 Ways to Align Sales and Marketing Teams for Rapid GrowthTop 3 Ways to Align Sales and Marketing Teams for Rapid Growth
Top 3 Ways to Align Sales and Marketing Teams for Rapid Growth
 
My Personal Brand Exploration by Mariano
My Personal Brand Exploration by MarianoMy Personal Brand Exploration by Mariano
My Personal Brand Exploration by Mariano
 
Metaverse Marketing in the Generation of the Internet - Eugene Capon
Metaverse Marketing in the Generation of the Internet - Eugene CaponMetaverse Marketing in the Generation of the Internet - Eugene Capon
Metaverse Marketing in the Generation of the Internet - Eugene Capon
 
Digital Commerce Lecture for Advanced Digital & Social Media Strategy at UCLA...
Digital Commerce Lecture for Advanced Digital & Social Media Strategy at UCLA...Digital Commerce Lecture for Advanced Digital & Social Media Strategy at UCLA...
Digital Commerce Lecture for Advanced Digital & Social Media Strategy at UCLA...
 
May 2024 - VBOUT Partners Meeting Group Session
May 2024 - VBOUT Partners Meeting Group SessionMay 2024 - VBOUT Partners Meeting Group Session
May 2024 - VBOUT Partners Meeting Group Session
 
SMM Cheap - No. 1 SMM panel in the world
SMM Cheap - No. 1 SMM panel in the worldSMM Cheap - No. 1 SMM panel in the world
SMM Cheap - No. 1 SMM panel in the world
 
How to Run Landing Page Tests On and Off Paid Social Platforms
How to Run Landing Page Tests On and Off Paid Social PlatformsHow to Run Landing Page Tests On and Off Paid Social Platforms
How to Run Landing Page Tests On and Off Paid Social Platforms
 
ThinkNow 2024 Consumer Financial Wellness Report
ThinkNow 2024 Consumer Financial Wellness ReportThinkNow 2024 Consumer Financial Wellness Report
ThinkNow 2024 Consumer Financial Wellness Report
 
De-risk Your Digital Evolution - Hannah Grap
De-risk Your Digital Evolution - Hannah GrapDe-risk Your Digital Evolution - Hannah Grap
De-risk Your Digital Evolution - Hannah Grap
 
How to use Short Form Video To Grow Your Brand and Business - Keenya Kelly
How to use Short Form Video To Grow Your Brand and Business - Keenya KellyHow to use Short Form Video To Grow Your Brand and Business - Keenya Kelly
How to use Short Form Video To Grow Your Brand and Business - Keenya Kelly
 
Your Path to Profits - The Game-Changing Power of a Marketing - Daniel Bussius
Your Path to Profits - The Game-Changing Power of a Marketing - Daniel BussiusYour Path to Profits - The Game-Changing Power of a Marketing - Daniel Bussius
Your Path to Profits - The Game-Changing Power of a Marketing - Daniel Bussius
 
Your Path to Profits - The Game-Changing Power of a Marketing OS for Your Bus...
Your Path to Profits - The Game-Changing Power of a Marketing OS for Your Bus...Your Path to Profits - The Game-Changing Power of a Marketing OS for Your Bus...
Your Path to Profits - The Game-Changing Power of a Marketing OS for Your Bus...
 

EFFECTIVE DISTRIBUTION MANAGEMENT

  • 1. 1 EFFECTIVE DISTRIBUTION MANAGEMENT ABSTRACT: Distribution plays a key role within the marketing mix, and the key to success is its successful integration within the mix, ensuring that customers get their products at the right place and at the right time. If the product cannot reach its chosendestinationat the appropriate time, thenit can erode competitive advantage and customer retention. The purpose of this paper is to explore the best distribution strategy and other factors that help the organization meet customer expectations in respect of delivery and service promises the organization might make. The paper was qualitative and empirical data were collected through questionnaire and in-depth interview. SPSS was used in analyzing the data gathered from the sample (105 respondents). The study revealed that the best distribution strategy depends on the target market and the operational environment. It also indicated that the emergence and explosion of the internet and other information communication technologies has greatly affected distribution. The study concludes that effective distribution requires a high degree of management skill, synchronization and integrationwith the overall organization, as it will be one of the major components in achieving a sustainable competitive advantage. INTRODUCTION: For any organization to be effective there should be effective distribution management process to convey finished products from the manufacturer to the final consumers. This is because without distribution the best product will not be delivered and the marketing mix will break down and fail. As a result of this, firms are increasingly adopting supply chain management to reduce cost, increase market share and sales, and build solid customer relations (Ferguson 2000). Supply chain management can be viewed as a philosophy based on the belief that each firm in the supply chain directly and indirectly affects the performance of all the other supply chain members, as well as ultimately, overall supply chain performance (Cooper et al, 1997). The effective use of this philosophy
  • 2. 2 requires that functional and supply-chain partner activities are aligned with company strategy and harmonized with organizational structure, processes, culture, incentive and people (Abell 1999). Distribution channel consists of a group of individuals or organizations that assist in getting the product to the right place at the right time. Distribution plays a vital role, primarily because it ultimately affects the sales turnover and profitmargins of the organization. If the product cannot reach its chosen destination at the appropriate time, then it can erode competitive advantage and customer retention. The retail industry isresponsible for the distribution of finished products to the consumer as well as the public. The retail sector comprises of general retailers (managed by individuals/families), departmentalstores, specialty stores and discount stores. In practice, many organizations use a mix of different channels; in particular, they may complement a direct salesforce, calling on the larger accounts, with agents, covering the smaller customers and prospects. However, the major challenge now facing the retail industry is the power of the customers or buyers. This is because the customers are becoming increasingly knowledgeable, impatient, not wishing to wait for the suppliers’ products for any period of time. This coupled with the fact that firms are now trying to implement specific distribution strategy or practices based upon their unique set of competitive priorities and business conditions to achieve the desired level of performance, has led to an investigation into the various distribution strategies and practices available with the view to establish the strategy or practice which has the most influence on retail performance in Ghana. The purpose of this exploratory study is to investigate the relationship between distribution strategy and practice and retail performance in the Fast Moving Consumer Goods in Ghana using Poku Trading as a case. To do this, the paper is divided into five sections. This introduction is followed by the review of related literature. Research method and data analysis follow the literature review. The last section of the paper looks at conclusion and recommendation. LITERATURE REVIEW Theoretical Framework:-
  • 3. 3 Most producersuse intermediaries to bring their products to market. They use a set of interdependent organizations in the process of making a product or service available for use or consumption by the consumer or business user. This process is what has been known as distribution channel (Philip Kotler 2001). Weiss and Gershon (2002) noted that, distribution describes all the logistics involved in delivering a company's products or services to the right place, at the right time, for the lowest cost. In the unending efforts to realize these goals, the channel of distribution selected by a business play a vital role in this process. Well-chosen channel constitute a significant competitive advantage, while poorly conceived or chosen channel can doom even a superior product or service to failure in the market. Effective distribution provides customers with convenience in the form of availability (what, where, when - the right product, at the right place, at the right time), access (customers' awareness of the availability and authorization to purchase), and support (e.g. pre-sales advice, sales promotion and merchandising, post-service repairs). The Distribution Channel and the Customer:- There are many variations in respect of the distribution channel structure however, intermediaries be deemed as appropriate in the business environment, the following channel structures would be available to you: 1. Passing of goods and services direct from the manufacturer to the consumer. 2. Passing of goods and services via a retailer and then on to a consumer. 3. Passing of goods and services from the manufacturer via a wholesaler and then directly on to the consumer. 4. Passing of goods and services from manufacturer via a wholesaler, then on the retailer and consequently on to the consumer.
  • 4. 4 5. Additionally, the manufacturer can distribute the products and services via an agent to a wholesaler and then follow the route shown in points 3 and 4.Quite often the types of channels of distribution used by organizations will depend upon. 6. The structures of the market, the size of the market, the complexity of the market and the geographical dispersion of the market, among the factors. Selecting the channels of distribution:- For manufacturer to select a channel, they must consider the following: 1. The product characteristics and how they affect methods of distribution. 2. Customers and their requirements. 3. Location of the customers. 4. How, when and where customers want to buy the products.
  • 5. 5 5. The cost of distribution. 6. The legal and regulatory constraints of the distribution. These are important issues and require significant levels of analysis in order to gain an understanding of the situation. Clearly some of these issues will form the basis of the marketing audit. Ideally the marketing mix has a clear focus on achieving customer satisfaction and achieving the profit objectives of the organization. Supermarkets have moved away from just supplying food-based products to include fashions, music, electrical goods, cosmetics, etc. All of this is focused on meeting all of the above distribution factors. There are two perspectives of intermediary selection, the strategic perspective and the operational perspective: strategic in relation to looking at the ‘bigger picture’ and ‘operational’ looking at the ability to implement the strategic marketing plan and distribution strategy.(Armstrong& Kotler 2010). Channel strategy:- There are three types of market coverage: 1. Intensive 2. Selective 3. Exclusive Intensive distribution means that as may available outlets as possible hold this product, e.g. chocolate, newspapers, bread, etc. Intensive distribution will mean convenience to the customer and increase customer satisfaction. The sale of groceries in petrol and service stations is an example of how intensive distribution has grown (Bowersox eta’l 1986). Key characteristics include: 1. Maximum number of outlets covered to maximizeavailability. 2. Target outlets in as many as geographical regionsas possible. 3. Consumer convenienceproducts.
  • 6. 6 4. High number of purchasers. 5. High purchasefrequency. 6. Impulsivepurchase. 7. Low price. Selective distribution is different in that some products are only available from some outlets, e.g. electrical appliances, certain brands of clothes and fashion products. Key characteristics include: 1. Medium levelof customers – but likely to be significant. 2. Less intensivedistribution of outlets. 3. Retailers may requirespecialist knowledge. 4. Shoppingbased products. 5. Medium number of shoppers. 6. Purchase is occasional. 7. Purchase is more likely to be planned. 8. Medium price. Exclusive distribution is where possibly only one outlet in a certain geographic area supplies a product. This method of distribution usually relates to specialty products, e.g. special cars, specialist clothing, etc. often exclusive distribution is relevant to niche products. Key characteristics include: 1. Relatively few customers 2. Limited retail outlets 3. Close retailer/customer relationship 4. Special products 5. Infrequentpurchase 6. High involvementand planned purchase 7. High price
  • 7. 7 Channel decisions:- There are six basic channel decisions to make. These are: 1. Whether to distribute direct to the customer or indirectly through middlemen The advantages of going direct are that it enables firms to exercise more control over marketing activities and it reduces the amount of time spent in the channel. The disadvantages are that it is difficult to obtain widespread distribution and more resources are required to maintain distribution. Going direct is the method widely used by industrial goods producers. In the case of consumer goods, examples of going direct to the customer are to be found in marketing cosmetics and encyclopedias. (Proctor 2001a). 2. Whether to adopt single or multiple channels of distribution The advantages of using a single channel are that it guarantees a minimum level of sales and the exclusivity of using a single channel guarantees attention to the product. In the first case, intermediaries can be asked to accept a minimum non-returnable order quantity. In the second case, the fact that a product is only available from very specific outlets suggests that it is difficult to obtain because it is exclusive. The harder it is to get, the more people will want to know about it—or so the argument goes. On the other hand, the disadvantage of using exclusivity is that it does limit sales. (Proctor 2001b). In contrast, the use of multiple channels should lead to increased sales and a potential for wider distribution. It must be argued that the more establishments put the product on view, the more likely it is that sales will be substantial. Restricting the number of channels through which the product is sold, restricts the number of people who can come into contact with the product. On the other hand, there are disadvantages with using multiple channels. First, greater investment, more sales people in the field, more marketing effort in general and more administration are required. (Proctor2001 c)
  • 8. 8 3. How long the channel of distribution should be? In determining the best channel length to adopt, the followingfactors have to be taken into account: (a) The financial strength of the producer—those in a strong position can carry out the functions provided by intermediaries. (b) Size and completeness of the product line—the costs of carrying out the distribution function can be spread across the various items in the product line. The more items, the more economical it might be to consider a shorter distribution channel. (c) The average order size—large orders may be distributed direct to customers. (d) The geographical concentration of customers—geographically dispersed customers merit a longer distribution channel since servicing them requires substantial investment of resources. (e) The distance of the distributor from the market—geographical distance makes it less attractive for the producer to want to supply direct. ( Ballou 1992) The above are guidelines and of course exceptions may be encountered in practice. 4. The types of intermediaries to use. This effectively means choosing between different types of retailer in the case of consumer goods, e.g. supermarkets as opposed to cash and carry, and different types of distributor in the case of industrial goods, e.g. whether to use franchised dealerships or not. 5. The number of distributors to use at each level. In principle, more distributors are required if: (a) The unit value of the product is low and/or the physical quantity of stock held is likely to be high. (b) The product is purchased frequently. (c) There is a high degree of technological complexity in the product. (d) The service requirement is high. (e) The inventory investment is high. (f) Geographic concentration is low.
  • 9. 9 (g) Total market potential is high. (h) The market share of the producer is high. (i) Competition is intense(Goddard 1982) 6. Which intermediaries to use: This is a qualitative decision and reflects whether the image of the particular outlet, the way in which it performs and the deals which can be struck with the distributor are satisfactory. It may mean choosing C&A rather than Marks and Spencer, or Tesco rather than Finefare. Even when strategies have been selected they have to be implemented and this involves producers and intermediaries working together in the most effective manner. (Proctor 2001d). Physical distribution management (PDM):- Physical distribution management (PDM) is the term used to describe the management of every part of the distribution process. PDM can be contracted out to a specialist or is best developed as a specialist function within the organization. It is the process which ensure that the correct customer within a given timescale, as cost-effectively as possible (Little and Marandi2003). Part of PDM would include being aware of what your competitors are offering, as suggested above. Elementsfor consideration would include: 1. Costs involved 2. Methods of transport – road, rail, plane, shipping, etc. 3. Routes used 4. Stock, storage and stock control 5. Protection and delivery of stock 6. Timing – a key element 7. Evaluatingthe effectiveness of methods of distribution and being aware of other alternatives.
  • 10. 10 Distribution is an integral part of the marketing mix. With the right distribution strategy in place that is with the right mode of delivery the right speed of delivery to the appropriate place of purchase, customer satisfaction can be significantly increased. Failure to deliver these practical pointswill result in the loss of ordersand income to the company and long- term customer loyalty will decline (Drummond and Ensor 2001). The key objective of PDM is to find the most cost-effective way of meeting customer needs in relation to purchasing their product, whoever they are and wherever they are. Physical distribution management includes the following functions: 1. Customer services. 2. Order processing. 3. Materials handling. 4. Warehousing. 5. Stock/inventory management. 6. Transportation. The key success factors of physical distribution management include all elements of the marketing mix: 1. Product characteristics – how do they affect delivery requirements? 2. Packaging – can the product be transported? 3. Pricing – how much does distribution add to the cost of the product? 4. Promotional campaigns – creating an awareness of the product and where and how it can be purchased. 5. Timing is a critical element of PDM, as many co 6. Companies work on the delivery of materials and components on a ‘Just in Time’ basis (JIT).
  • 11. 11 JIT is just as it sounds; it means that the manufacturer of products, or the supplier of raw materials, must deliver the necessary material or components as and when required. For example, a window manufacturer, who makes windows for office buildings, will be making windows to order and will be require to deliver them at certain periodic times in the construction of the building. Because storing glass and the metal or plastic structures is difficult, the organization will deliver as and when the office block construction company needs it. The concept of JIT was developed to encourage maximized efficiency of manufacturing. The process will reduce the storage space requirements, which is a direct cost saving to the organization, but it also means that the organization will only pay for the materials when they have taken delivery of them, rather than in a bulk order at the beginning of the contract. Both save significant amounts of money, which means that the cost saving can be passed onto the customer, making products cheaper to purchase. JIT is much linked to qualify applications and improvements. Should the organization take a mass delivery of a component, and leave stock standing around, it could be damaged or problems with the delivery may not be discovered until it is too late. Therefore, quality assurance controls and measures can be implemented as the components are dispatched which then aids the quality improvement process. This then enables organization to work towards zero defects, which means zero wastage of time and material, which means cost effectiveness and quality improvement and ultimately a higher level of customer satisfaction. Within the retail sector, JIT plays the same sort of role. You will note that retail outlets very rarely run out of standards of stock products, because they have good stock control processes and systems that enable JIT delivery of those stock items (Joan Feldman 1984). Most retailers now work with electronic point of sale system (EPOS). EPOS registers your purchase at the point of sale, i.e. the payment checkout. The product is scanned into the computer as sold and the computer automatically registers this as a stock reduction. When the stock reduction reaches a certain minimum level, the computer automatically generates a message to place a stock order for that particular product to be in store by a certain delivery date. The EPOS system allows retailers to monitor frequency of purchase of certain products, which then enables them to forecast demand of their stock products. This in turn helps them plan for
  • 12. 12 their stock requirement and come to appropriate agreements with their suppliers on delivery and storage requirements (Jobber 2001). RESEARCH METHODOLOGY:- The research was inductive rather than standard quantitative survey (deductive). This is due to the fact that the research seeks to build theory rather than theory testing. In as much as this study aims at exploring the best distribution strategy and its impact on competitiveness, its success depends on perceptions of social actors within the stated specific context, that is, upon how managers, customers and employees perceive the concept of distribution management. Following grounded theory tradition, the research started by explaining the methodology and research perspective (Locke, 2000). The knowledge gained was then discussed in the context of the literature. A review was conducted of the existing literature, including how physical distribution management affects retail operations (Ambler, 2003; Feldwick, 2002; Keller, 2003). Questionnaire and interviews were used to collect all the necessary data from the management, customers and employees of Opku Trading. These respondents were chosen because they are well positioned to provide the needed data for the research. They were selected by virtue of their qualification, experience and their expertise in the area of corporate governance. With regards to the questionnaire, both open-ended and close- ended questions were used. This question style was adopted because it facilitates ease understanding on the part of the respondents. It also enables the researcher to have a direct visual impression of the trend of events. The questionnaires were given to customers personally and those who cannot read or write were assisted to fill. The first part of the questionnaire contains questions on the organization and respondents’ characteristics. The second part of the questionnaire examine distribution strategies, attitude and perception of customers and management using three-point scale of 3-very good,2- good and 1 very poor. A total of one hundred usable questionnaires were completed and used for the analysis. In order to make the study detailed and concrete, a total number of one hundred and five respondents made up of management, customers and employees from Opoku Trading. Besides the questionnaire, the
  • 13. 13 respondents were interviewed (convergent depth interview) with a topic guide and their responses transcribed. To get this respondents (sample- 105), purposive and quota sampling techniques were used. That is, the selection of the respondents to be interviewed will be as a matter of necessity. These techniques were used because they help in saving cost and the cost saving may be used to improve the quality of the research through increasing sample size. Again, the data, when compared to random methods which are perhaps double the cost, has been proved to be acceptable provided that the research is managed effectively. To gain an indepth knowledge into the nature of distribution management, the respondents were selected by triangulating (Flick, 1998; Blaikie, 1991). Statistical tools or normal distribution curves and software packages such as SPSS was used to analyze the data. PRESENTATION, ANALYSIS AND FINDING(S) FROM DATA:- Data collected from questionnaires and interviews were analyzed accurately in this section. A total of one hundred and five (105) questionnaires were administered to customers for their views. Those who were unable to write were interviewed using the questionnaires as a guide. TABLE 1: AGES OF RESPONDENTS:- Source: Field Survey (Opoku Trading Company), August, 2012 Due to customers’ differences, the researcher targeted its customers on their age group to know the impact that distribution have on the
  • 14. 14 purchasing behavior of Opoku Trading Company in the Kumasi Depot. Table 1 indicates that 58 of the respondents fall within the ages of 18-24 years, 38 respondents’ fall within 25-34years, and 15 respondents’ fall above 35 years. Therefore, it indicates greater number of respondent fall within 18 to 24 yearswhich represents49 .5% and fellow by 25 to 34 years which represent 36%. It is assumed that majority of the respondent fall within the working force since the youth are also part of the force. And also the mean of the respondent age was 1.65 it shows that average age of respondent is between 18 and 26 ages. The standard deviation of their age was 0.720 variance was 0.519 TABLE 2: The regression and correlation analysis of respondents’ knowledge of distribution strategies:- B Dependent Variable: intensive, selective, exclusive ** Correlation is significant at the 0.01 level (2-tailed). Source: Field Survey (Opoku Trading Company), August, 2012
  • 15. 15 As shown in Table, a Pearson correlation coefficient of the test indicates a strong positive relationship between the customers understanding and distribution strategy (intensive distribution). As indicate in the above table that (r= 0.779, p<.01). This means that changes in distribution strategy will correlate with customer understanding. In addition, Sig (2-Tailed) value which is 0.03, we can conclude that there is statistically significant correlation between customers understanding and distribution strategy (intensive distribution). The coefficient of the above correlation analysis r = 0.572 shows that there is strong positive correlation between customers understanding about distribution strategy (selective distribution). This means that customer has knowledge about selective distribution strategy. In addition, Sig (2-Tailed) value which is 0.021, we can conclude that there is statistically significant correlation between customers understanding and selective distribution strategy. As determined by one-way ANOVA (F= 156.77, p = .001), there is a statistically significant differencebetween customers knowledge or understanding and distribution strategy (intensive distribution). TABLE 3: Correlations between distribution and its importance to the firm:- The coefficient of the above correlation analysis which is 0.160 shows that there is weak positive correlation between importance of distribution to customer and how it increases customers satisfaction. Therefore we could conclude that importance of distribution to customer
  • 16. 16 and how it increases customer’s satisfaction are strongly correlated. In addition, Sig (2-Tailed) value which is 0.102, we can conclude that there is statistically significant correlation between importance of distribution to customer and how it increases customer’s satisfaction. Also coefficient of the above correlation analysis r = -0.196 shows that there is weak negative correlation between importance of distribution to customer and Easy flow of goods. We could conclude that when Opoku trading continues to use one distribution strategy, it will not make easily flow of goods to the final consumer. In addition, Sig (2-Tailed) value which is 0.045, we can conclude that there is statistically significant correlation between importance of distribution to customer and Easy flow of goods. The last column of the table shows coefficient of the correlation analysis r = -0.246 shows that there is weak negative correlation between importance of distribution to customer and Increase sales and rate of returns. This means that as one organization tries to change its distribution strategy, it will decreases sales and rate of returns of the organization for some time. Also, Sig (2-Tailed) value which is 0.012, we can conclude that there is statistically significant correlation between importance of distribution to customer and Increase sales and rate of returns. That is, change in distribution strategy does significantly relate to change sales and rate of returns.
  • 17. 17 The table above (Table 4) shows the relationship between management and the customers they served. This shows how management relates to their customers in terms of customers relationship. The coefficient of the above correlation analysis which is -0.302 shows that there is weak negative correlation between management and customer they served. This shows that, though relationship exists between management and customer they served, yet there is weak relationship between management and customer they served. We can conclude that there is less cordial relationship between them. With regards to Sig (2- Tailed) value which is 0.275, we can conclude that there is statistically significant correlation between management and customer they served.
  • 18. 18 From the table above customers were asked about how they perceive the general retail activities of Opoku Trading Company. Out of 105 respondents, 54 respondents rated their activities as Very good which represents fifty percent( 51.4%) , 39 respondents said Good representing thirty-seven percent (37.1%) and 12 respondents response was Very poor representing seventeen percent( 17.%) . This means that the general retail activities of Opoku Trading are on cause, as was said by the customers interviewed and the questionnaires administered to them.
  • 19. 19 The coefficient of the above correlation analysis which is -0.070 shows that there is weak negative correlation between customer perception and activities of Opoku trading company. This means that changes in customer perception will not correlated with the activities of Opoku trading company. Therefore we can conclude that customer perception and the activities of Opoku trading are not strongly correlated. With regards to Sig (2-Tailed) value which is 0.478, we can conclude that there is statistically significant correlation between customer perception and activities of Opoku trading. That means, increases or decreases in customer perception do significantly relate to increases or decreases in activities of Opoku trading. CONCLUSION, MANAGERIAL IMPLICATIONS AND RECOMMENDATIONS:- Consumers in today’s marketplace are enlightened and empowered by the information that they have at their disposal from the internet and from many other sources. Their access to supply sources has expanded dramatically beyond their immediate locality by virtue of catalogs, the internet, and other media. Consumers have the opportunity to compare prices, quality, and service. In turn, they demand competitive prices, high quality, tailored or customized products, convenience, flexibility, and responsiveness. They tend to have a low tolerance level for poor quality in
  • 20. 20 products and or service. However, this is not the case of Opoku Trading as the finding indicated that management has not done well to establish cordial relationship with their customers. The paper also indicated that there is statistically significant correlation between distribution and customer satisfaction, easy flow of goods and sales. Again, the analysis and discussions also indicated that most of the customers are between the ages of 18 and 24 meaning they are youth who are fascinated by technology. Besides, they also constitute the working population and do not have the time to go to the shop floor to buy but prefer to shop online. However, because the extent to which customers become satisfied and remain with a particular supplier depends on how easily goods and information flow to them, and how their specific needs are met promptly and with ease, one can conclude that very soon most of Opoku Trading’s customers if not all will switch because the company has not done enough to keep them. Again, judging from the findings, one can say that the profit level of the company will soon dwindle which can even lead to its collapse. From the above, I will recommend that management of Opoku Trading should set up a very efficient customer service department responsible for customer satisfaction and complaints. They should also conduct frequent survey to track. Customer satisfaction levels and effect remedial measures if the need be. In as much as majority of the customer are workers and youth, Opoku Trading should involve themselves in internet marketing and other social media to provide convenience and 24 hour service to their customers. As a result of this, there must be a high degree of management skill, synchronization and integration with the overall organization, as it will be one of the major components in achieving a sustainable competitive advantage. MANAGING EFFECTIVE DISTRIBUTION OF CHANNELS:- Channelsof distribution moveproductsand services from businesses to consumers and to other businesses. Also known as marketing channels, channels of distribution consist of a set of interdependent organizations
  • 21. 21 involved in making a product or service available for use or consumption. Channel members are assigned a set of distribution tasks by those responsible for channel management. For many products and services, their manufacturers or providers use multiple channels of distribution. Personal computers, for example, might be bought directly from the manufacturer—over the telephone, via direct mail, or through the company's web site on the Internet —or through several kinds of retailers, including independent computer stores, franchised computer stores, and department stores. In addition, large and small businesses may make their purchases through other outlets. Channel structures range from two to five levels. The simplest is a two-level structure in which goods and services move directly from the manufacturer or provider to the consumer. Two-level structures occur in some industries where consumers are able to order products directly from the manufacturer and the manufacturer fulfills those orders through its own physical distribution system. In a three-level channel structure retailers serve as intermediaries between consumers and manufacturers. Retailers order products directly from the manufacturer, then sell those productsdirectly to the consumer. A fourthlevel is added when manufacturers sell to wholesalers rather than to retailers. In a four-level structure retailers order goods from wholesalers rather than manufacturers. Finally, a manufacturer's agent can serve as an intermediary between the manufacturer and its wholesalers, making a five- level channel structure consisting of the manufacturer, agent, wholesale, retail, and consumer levels. A five-level channel structure might also consist of the manufacturer, wholesale, jobber, retail, and consumer levels, whereby jobbers service smaller retailers not covered by the large wholesalers in the industry. BENEFITS OF INTERMEDIARIES IN CHANNELS OF DISTRIBUTION:- If selling from the manufacturer to the consumer were always the most efficient way, there would be no need for channels of distribution. Intermediaries, however, provide several benefits to both manufacturers
  • 22. 22 and consumers: improved efficiency, a better assortment of products, routinization of transactions, and easier searching for goods as well as customers. The improved efficiency that results from adding intermediaries in the channels of distribution can easily be grasped with the help of a few examples. In the first examplethere are 5 manufacturersand 20 retailers. If each manufacturer sells directly to each retailer, there are 100 contact lines—one line from each manufacturer to each retailer. The complexity of this distribution arrangement can be reduced by adding wholesalers as intermediaries between manufacturers and retailers. If a single wholesaler serves as the intermediary, the number of contacts is reduced from 100 to 25—5 contact lines between the manufacturers and the wholesaler, and 20 contact lines between the wholesaler and the retailers. Reducing the number of necessary contacts brings more efficiency into the distribution system by eliminating duplicate efforts in ordering, processing, shipping, etc. In termsof efficiency there is an effect of diminishingreturnsas more intermediaries are added to the channels of distribution. If, in the example above, there were 3 wholesalers instead of only 1, the number of essential contacts increases to 75: 15 contacts between 5 manufacturers and three wholesalers, plus 60 contacts between 3 wholesalers and 20 retailers. Of course this example assumes that each retailer would order from each wholesaler and that each manufacturer would supply each wholesaler. In fact geographic and other constraints might eliminate some lines of contact, making the channels of distribution more efficient. Intermediaries provide a second benefit by bridging the gap between the assortment of goods and services generated by producers and those in demand from consumers. Manufacturers typically produce many similar products, while consumers want small quantities of many different products. In order to smooth the flow of goods and services, intermediaries perform such functions as sorting, accumulation, allocation, and creating assortments. In sorting, intermediaries take a supply of different items and sort them into similar groupings, as exemplified by graded agricultural products. Accumulation means that intermediaries bring together items
  • 23. 23 from a number of different sources to create a larger supply for their customers. Intermediaries allocate products by breaking down a homogeneous supply into smaller units for resale. Finally, they build up an assortment of products to give their customers a wider selection. A third benefit provided by intermediaries is that they help reduce the cost of distribution by making transactions routine. Exchange relationships can be standardized in terms of lot size, frequency of delivery and payment, and communications. Seller and buyer no longer have to bargain over every transaction. As transactions become more routine, the costs associated with those transactions are reduced. The use of intermediaries also aids the search processes of both buyers and sellers. Producers are searching to determine their customers' needs, while customers are searching for certain products and services. A degree of uncertainty in both search processes can be reduced by using channels of distribution. For example, consumers are more likely to find what they are looking for when they shop at wholesale or retail institutions organized by separate lines of trade, such as grocery, hardware, and clothing stores. In addition producers can make some of their commonly used products more widely available by placing them in many different retail outlets, so that consumers are more likely to find them at the right time. WHAT FLOWS THROUGH THE CHANNELS OF DISTRIBUTION:- Members of channels of distribution typically buy, sell, and transfer title to goods. There are, however, many other flows between channel membersin addition to physical possession and ownership of goods. These include promotion flows, negotiation flows, financing, assuming risk, ordering, and payment. In some cases the flow is in one direction, from the manufacturer to the consumer. Physical possession, ownership, and promotion flow in one direction through the channels of distribution from the manufacturer to the consumer. In other cases there is a two-way flow. Negotiations, financing, and the assumption of risk flow in both directions between the manufacturer and the consumer. Ordering and payment are
  • 24. 24 channel flows that go in one direction, from the consumer to the manufacturer. There are also a number of support functions that help channel members perform their distribution tasks. Transportation, storage, insurance, financing, and advertising are tasks that can be performed by facilitating agencies that may or may not be considered part of the marketing channel. From a channel management point of view, it may be more effective to consider only those institutions and agencies that are involved in the transfer of title as channel members. The other agencies involved in supporting tasks can then be described as an ancillary or support structure. The rationale for separating these two types of organizations is that they each require different types of management decisions and have different levels of involvement in channel membership. Effective managementof the channels of distribution involves forging better relationships among channel members. With respect to the task of distribution, all of the channel members are interdependent. Relationships between channel members can be influenced by how the channels are structured. Improved performance of the overall distribution system is achieved through managing such variables as channel structure and channel flows. BENEFITS OF SUPPLY CHAIN MANAGEMENT:- Supply chain management is concerned with managing the flow of physical goods and associated information from initial sourcing to consumption. One benchmarking study showed that best-practice supply chain management companies enjoyed a 45 percent total supply chain cost advantage over their median competitors. Bottom-line benefits included: I) reduced costs relating to inventory management, transportation, and warehousing; 2) improved service using techniques such as time-based delivery; and 3) enhanced revenues through greater product availability and more customized products. Some companies contract out the task of supply chain management to a specialized service firm. The supply chain management firm typically provides vertical market expertise, transaction processing capabilities, and
  • 25. 25 business consulting services, allowing the company to focus on its core competencies. In addition to reducing costs, effective supply chain management can result in enhanced supplier relations and greater customer satisfaction through timely deliveries and accurate responses to customer inquiries. TREND TOWARD CONSOLIDATION OF DISTRIBUTION CHANNELS:- In some industries there has been a noticeable trend toward consolidation of distribution channels. Through mergers and acquisitions some companies have achieved ownership of two or more channels of distribution, as when a distributor or wholesaler acquires a retailer. As a result of this type of consolidation, channel members who are closest to the consumer, such as retailers, have acquired more control. Historically, it was the manufacturer who invented and controlled the channels of distribution. Now, end-user dominated channels are replacing those invented and controlled by the manufacturer. One example has been the explosion of discount outlet malls, which obtain high-image products directly from manufacturers and sell them at a discount. Manufacturers have countered that trend by opening historically closed channels of distribution. That has made the lines of distinction between manufacturers, retailers, and direct-to-consumer sellers less clear. Manufacturers such as Apple Computer and Nike have opened their own retail outlets, thus blurring the line that once separated manufacturers from retailers. The distinction between retailers and direct-to-consumer sellers, or catalogers, has also become blurred as companies such as Eddie Bauer, Spiegel, and Victoria's Secret build one brand across both channels. In addition, some catalog companies such as J. Crew and Lands' End have opened retail outlets. The overall result is that there are new channel options for marketers to consider.