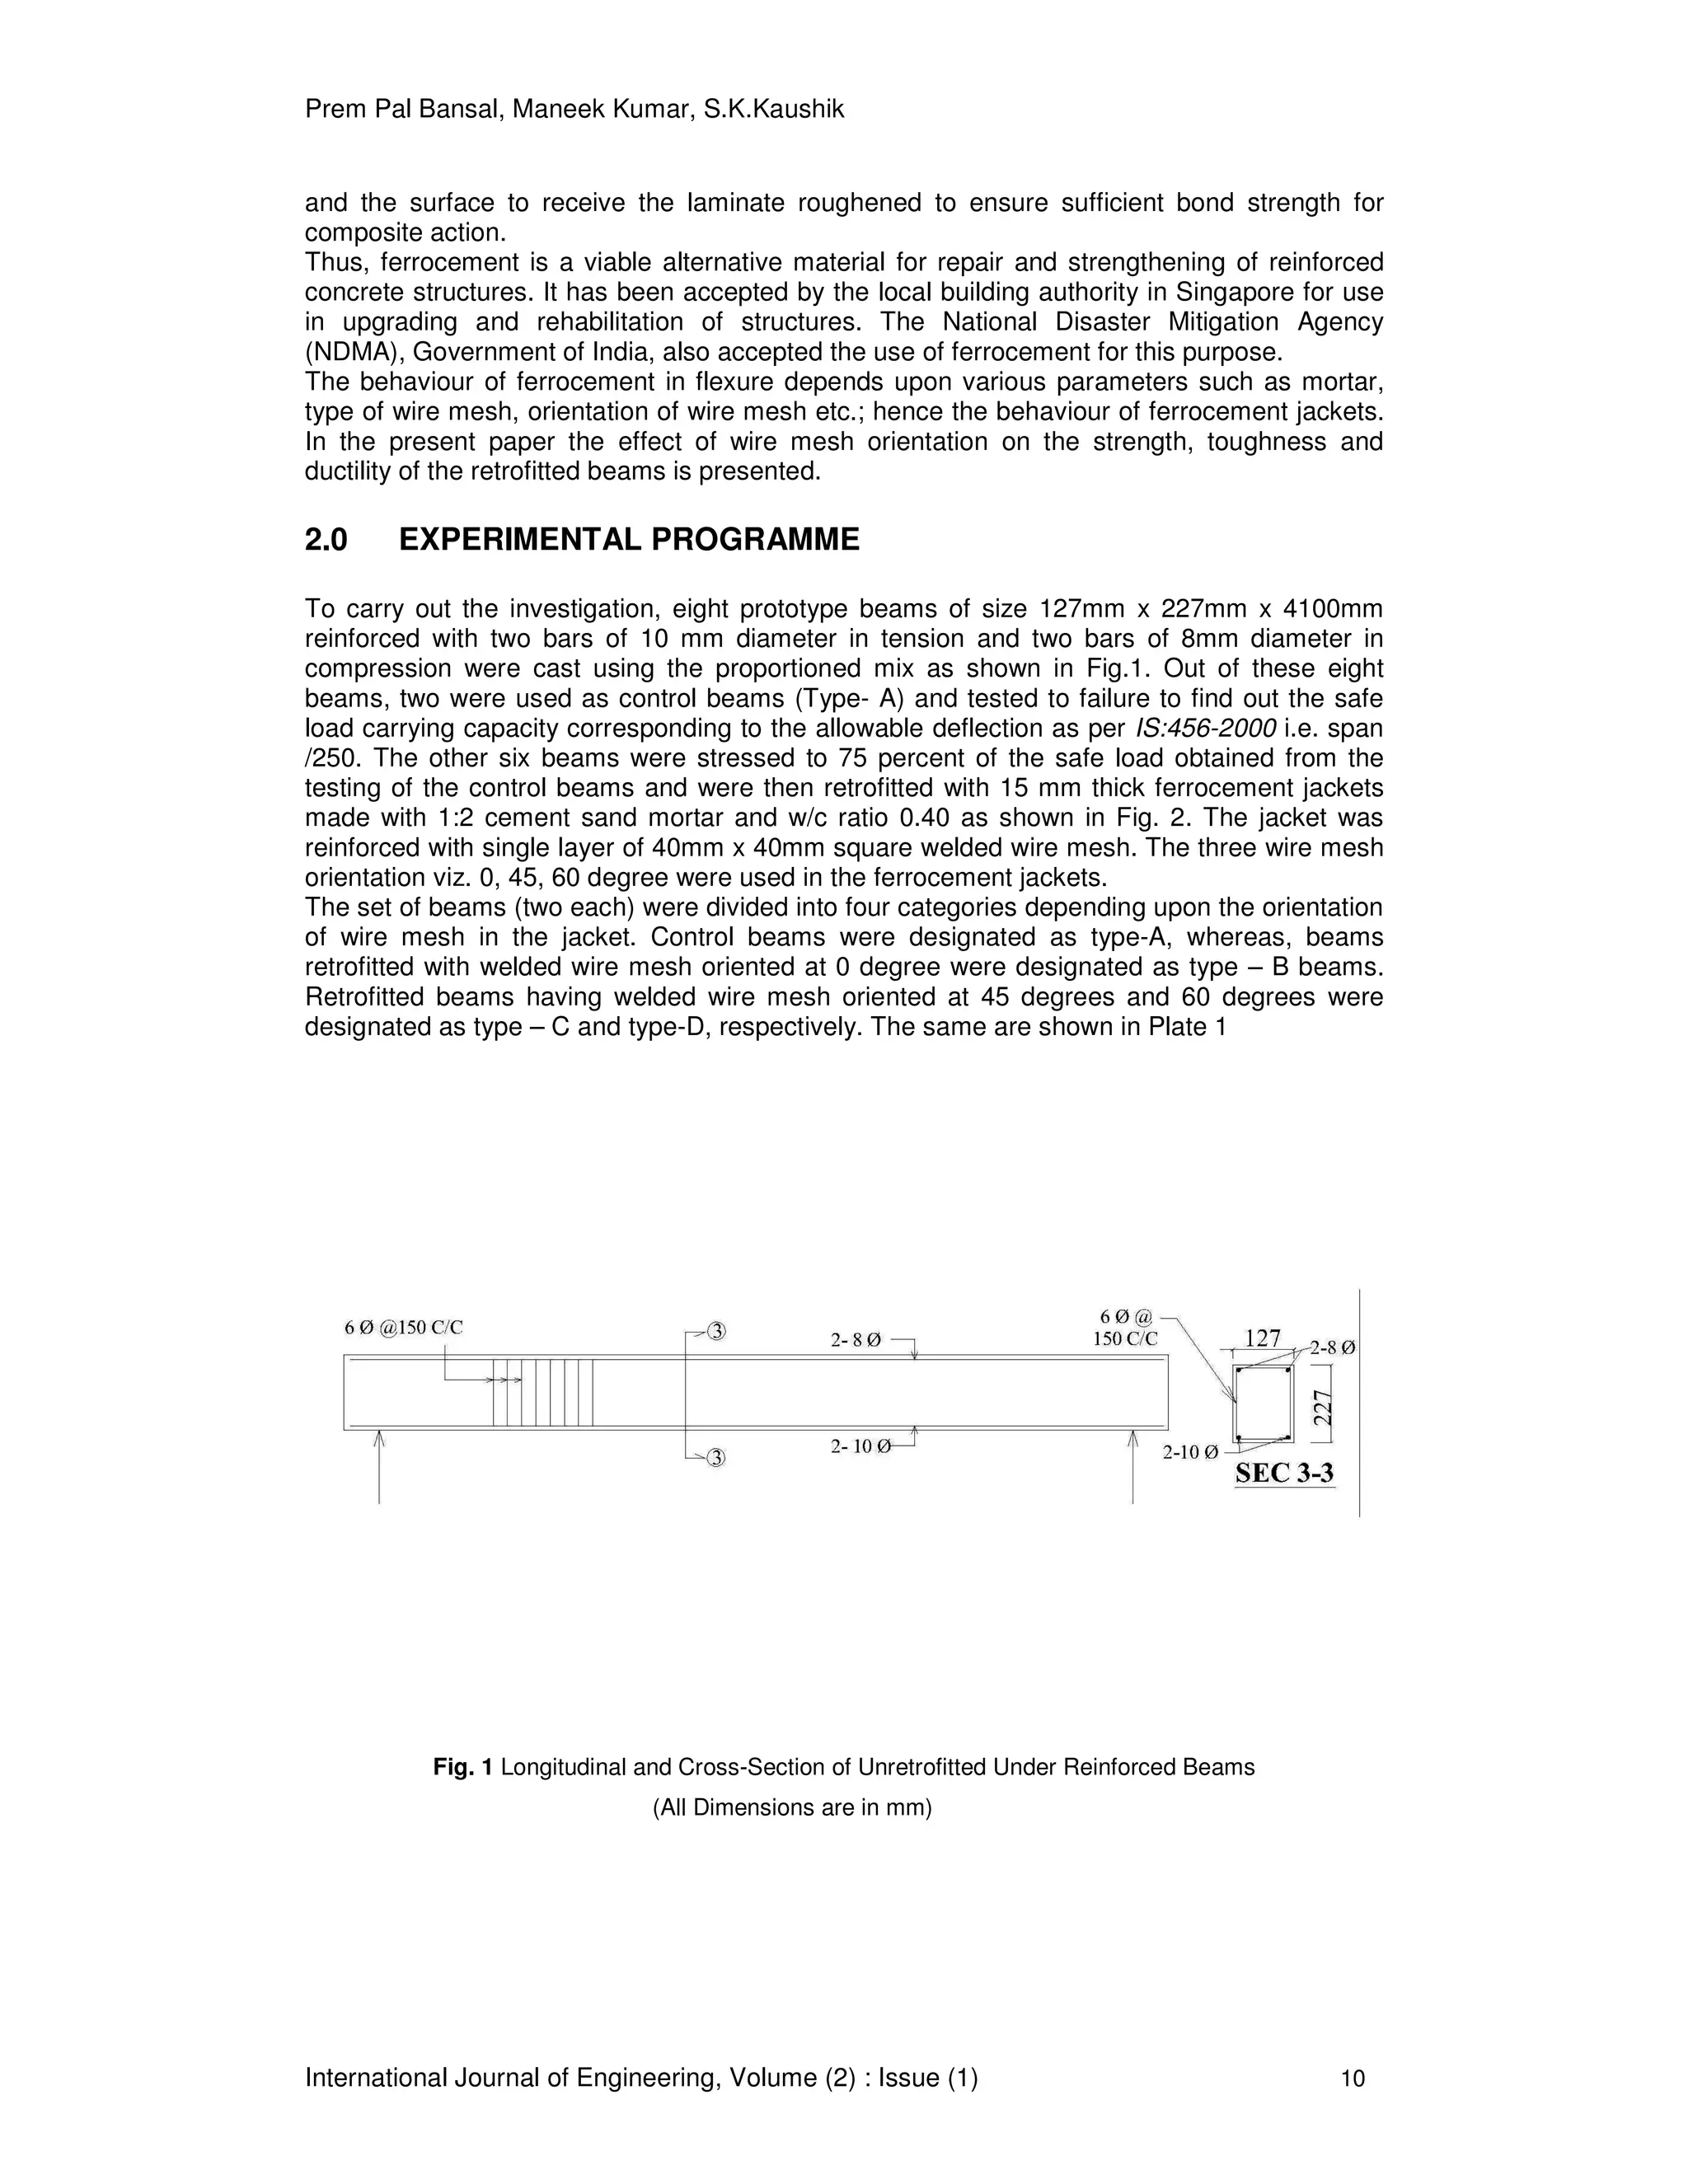
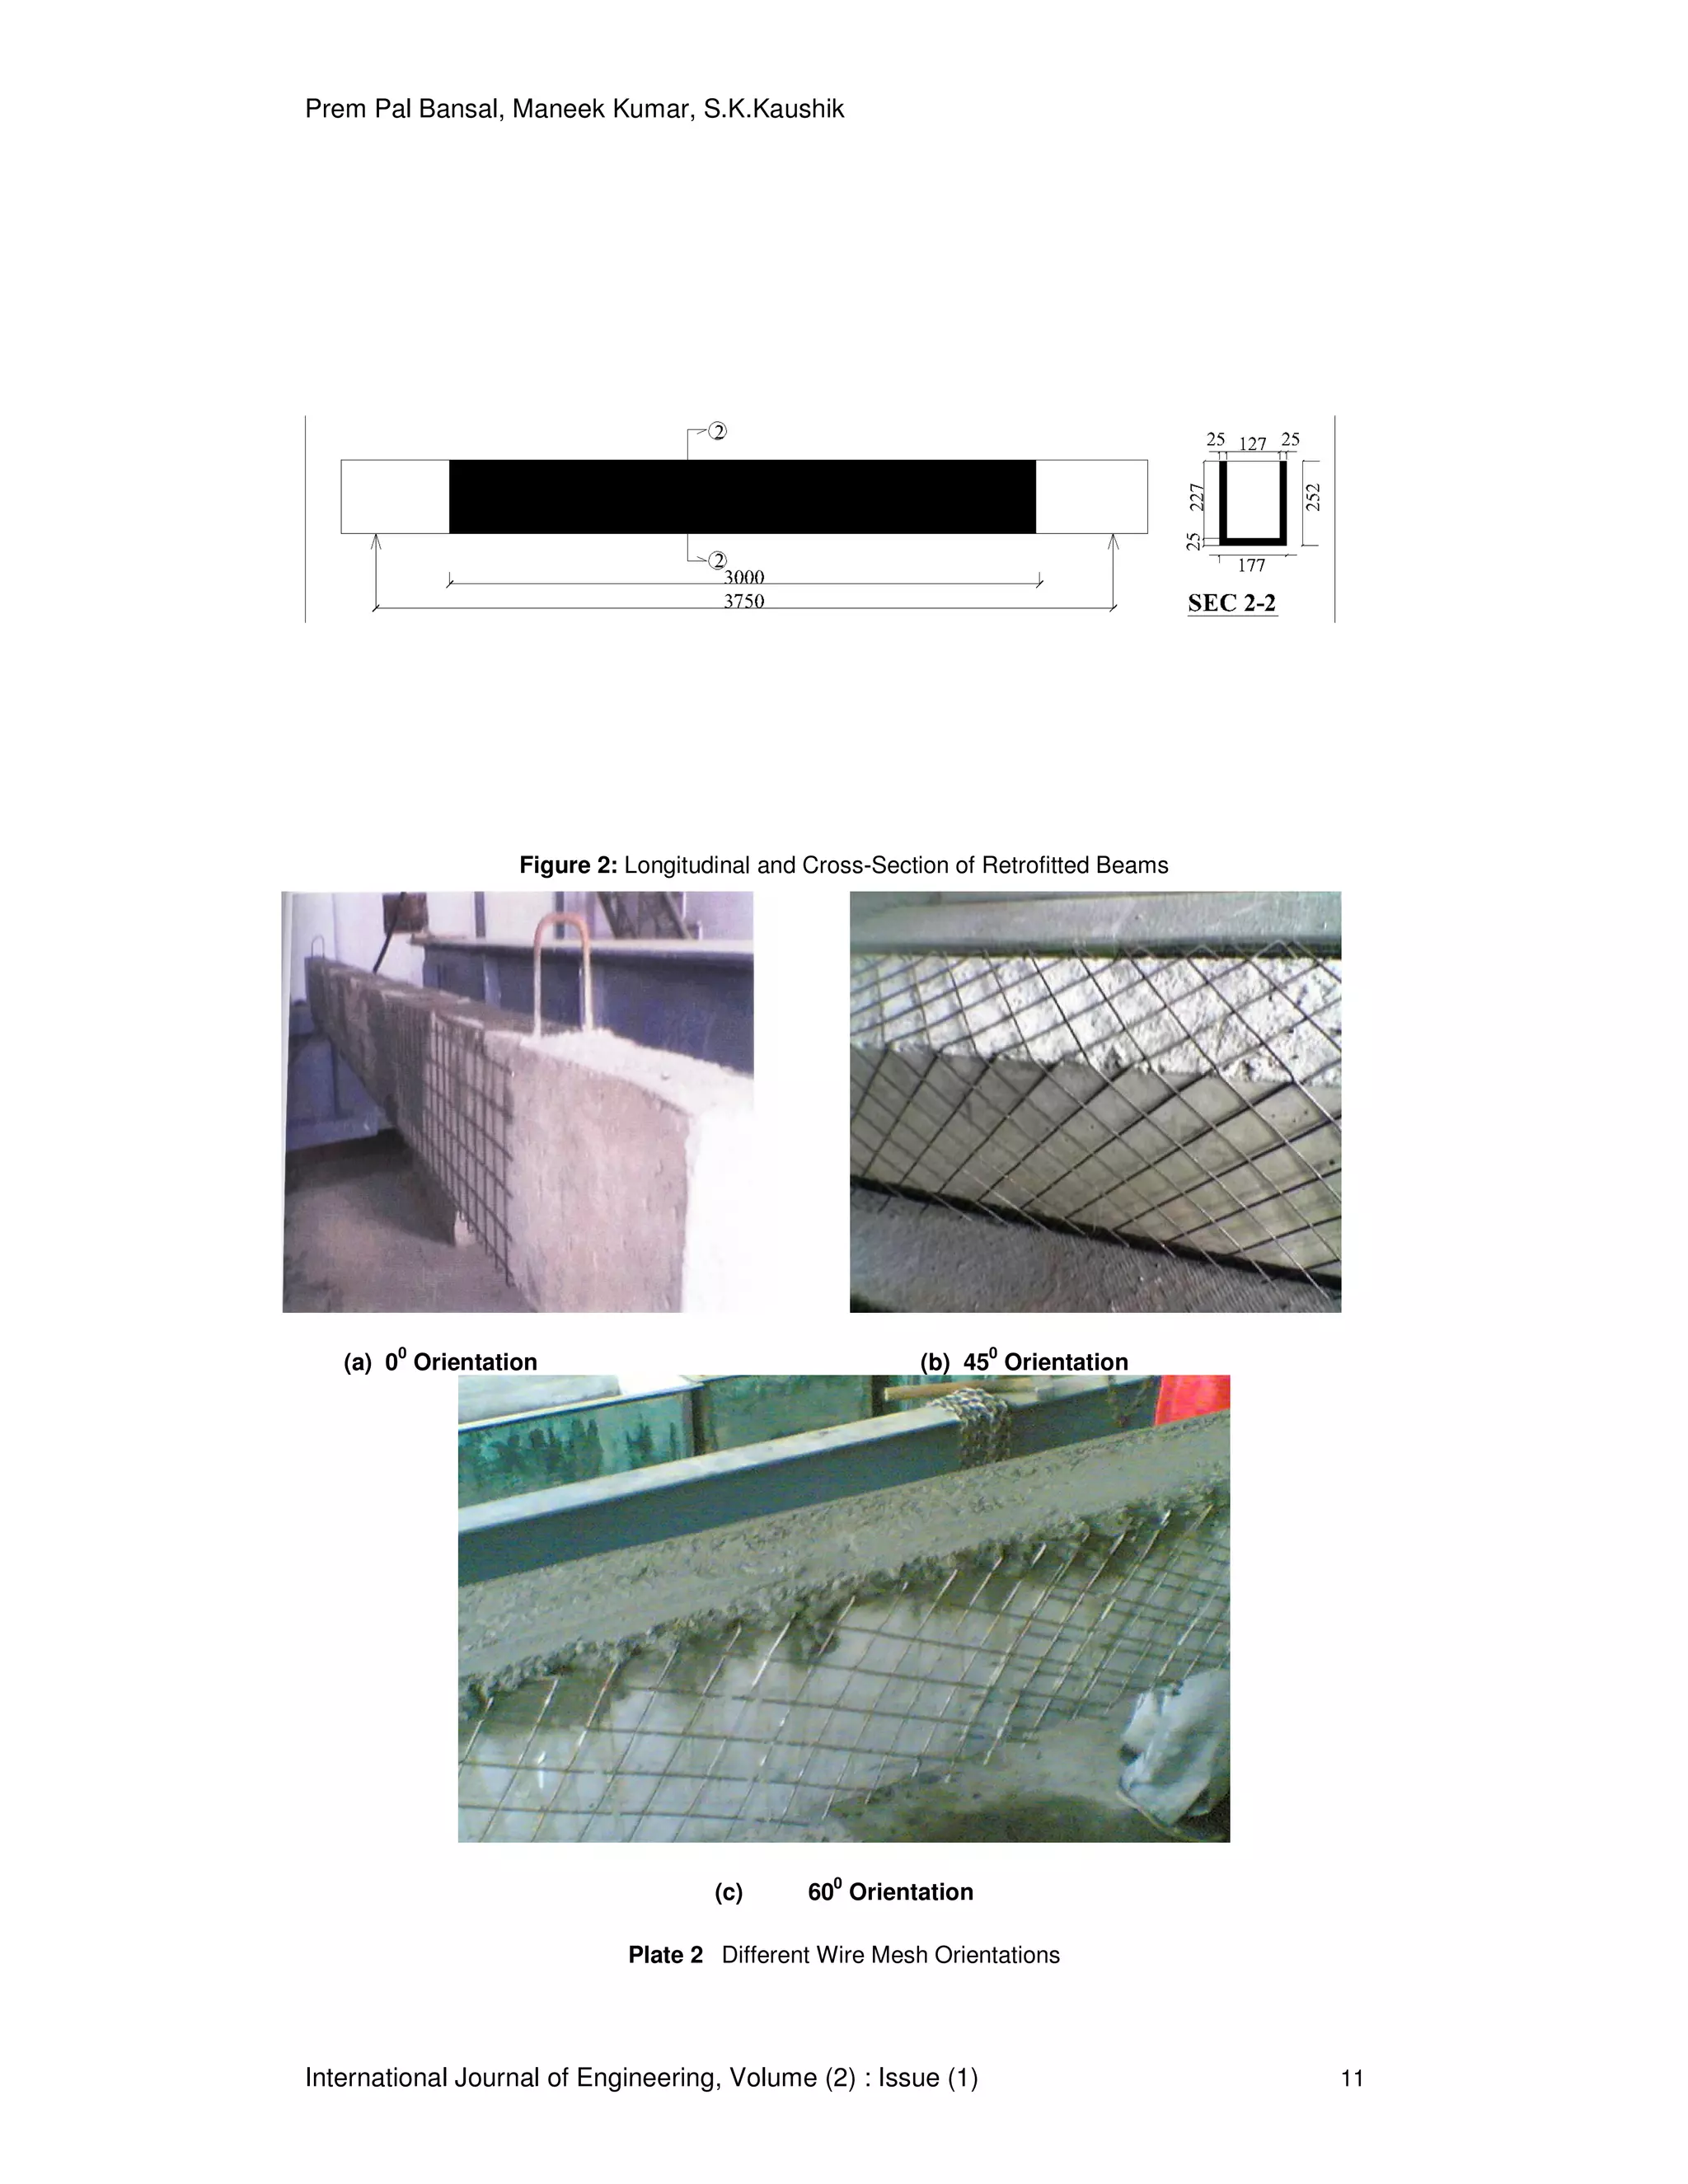
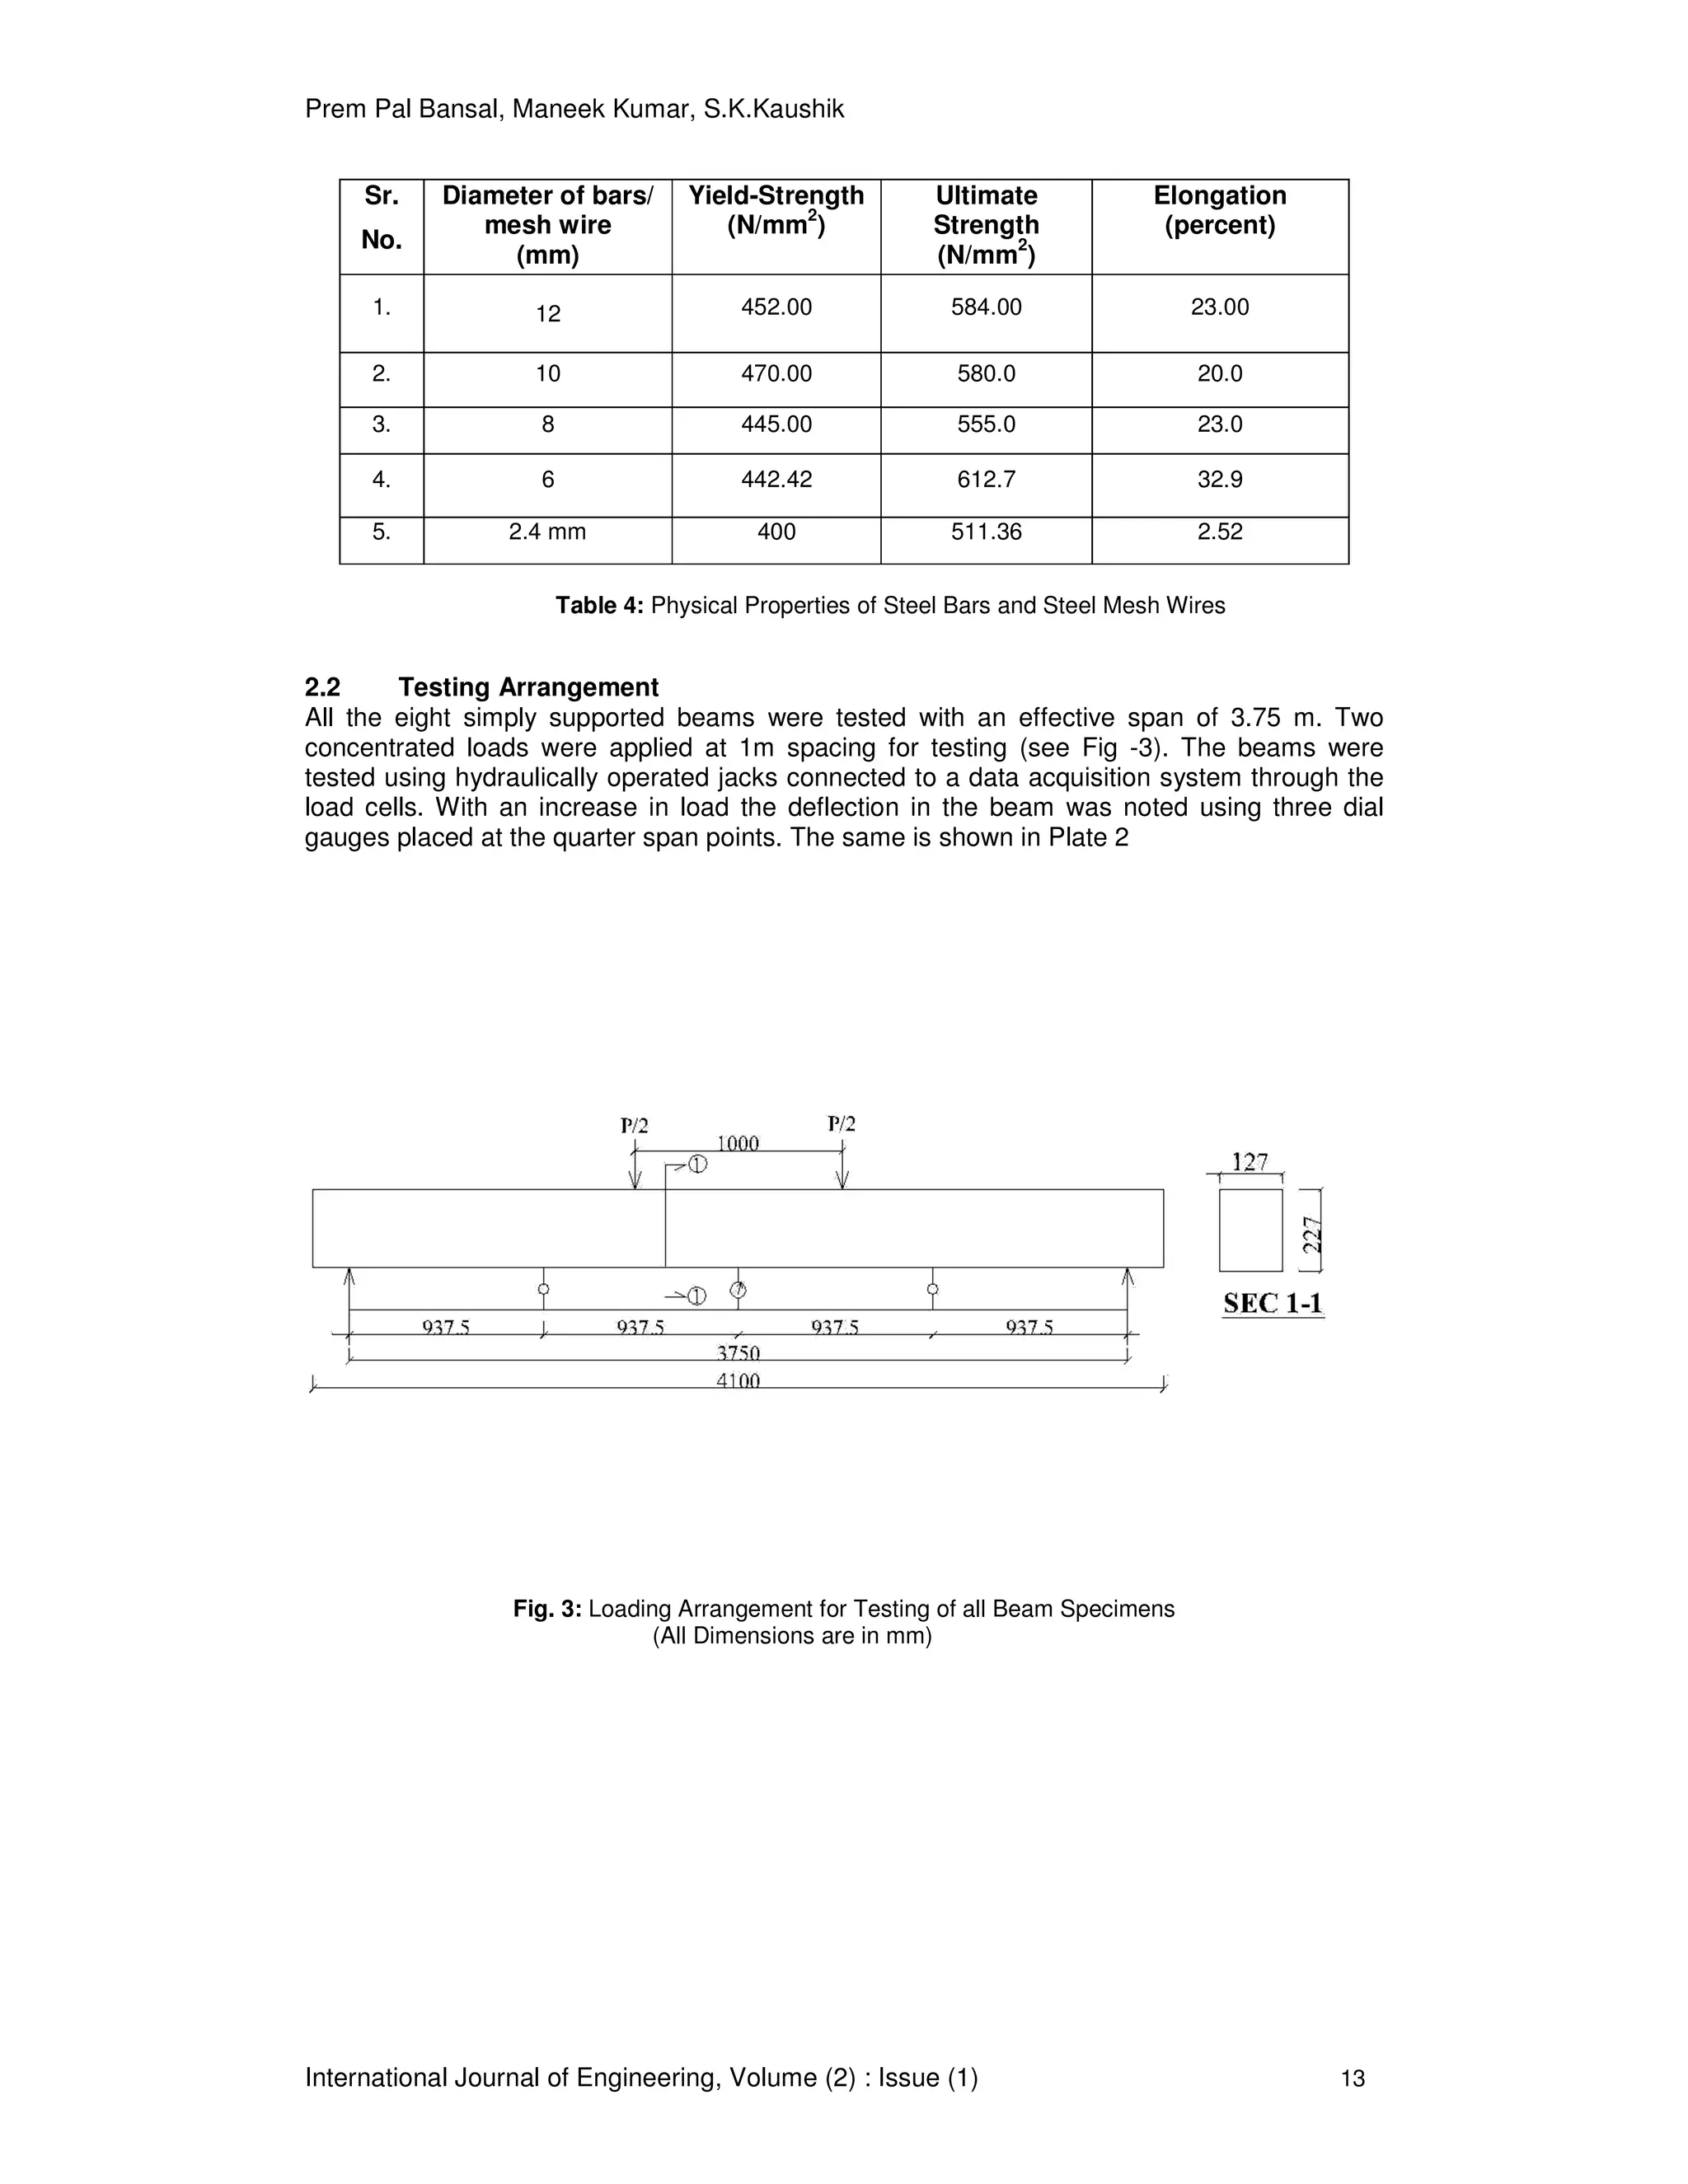
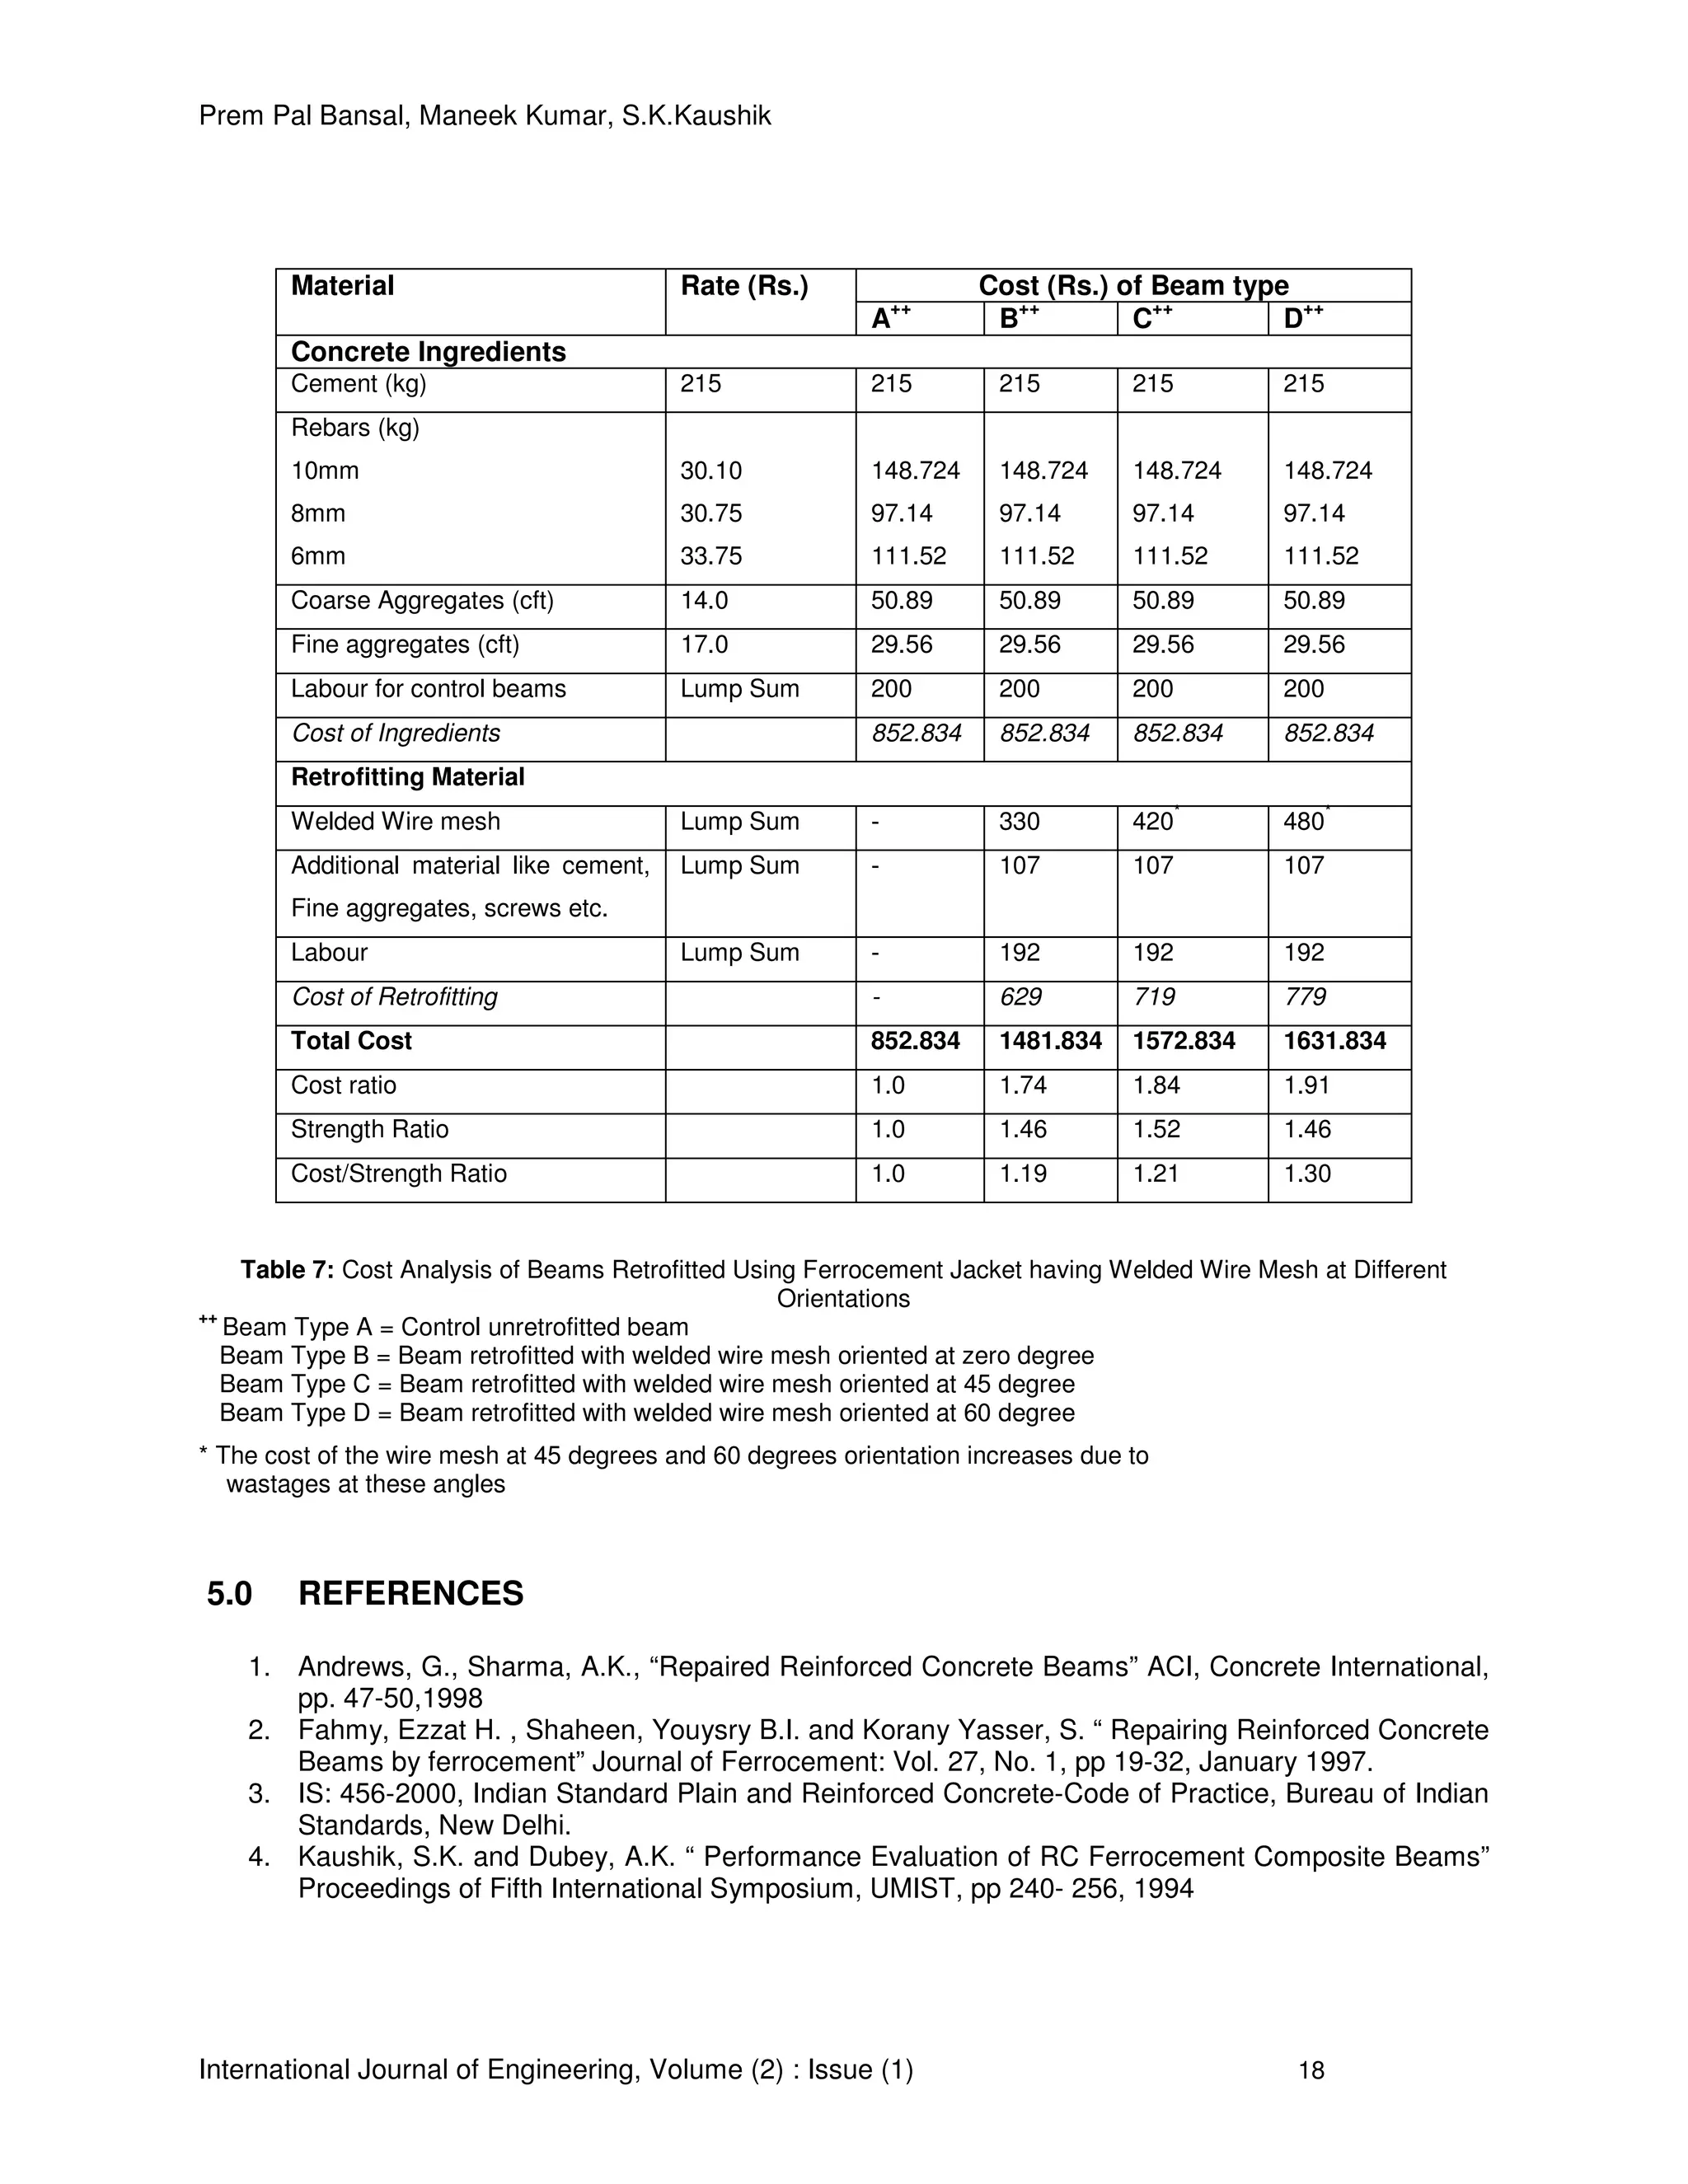
Prem Pal Bansal, Maneek Kumar, S.K.Kaushik
International Journal of Engineering, Volume (2) : Issue (1) 8
Effect Of Wire Mesh Orientation On Strength Of Beams
Retrofitted Using Ferrocement Jackets
Prem Pal Bansal*, B.E. Civil, M.E, Civil (Structures)
Lecturer, Department of Civil engineering,
Thapar University, Patiala,
INDIA 147 004
* Corresponding Author
prempalbansal@yahoo.co.in
prempal@gmail.com
Dr. Maneek Kumar, B.E. Civil, M.E, Civil (Structures),
Ph.D.
Professor & Head, Department of Civil engineering,
Thapar University, Patiala,
INDIA 147 004
maneek@tiet.ac.in
Dr. S.K. Kaushik, B.Tech. Civil, M.E, Civil (Structures),
Ph.D.
Formerly Professor and Head, Department of Civil
Engineering,
Indian Institute of Technology, Roorkee
INDIA
Abstract
Various retrofitting techniques are used in field and out of all plate bonding
technique is considered as the best. In this technique, the plates of different
materials viz CFRP, GFRP, ferrocement etc are bonded to the surface of
structural member to increase its strength. Ferrocement sheets are most
commonly used as retrofitting material these days due to their easy
availability, economy, durability, and their property of being cast to any shape
without needing significant formwork. In the present work, effect of wire mesh
orientation on the strength of stressed beams retrofitted with ferrocement
jackets has been studied. The beams are stressed up to 75 percent of safe
load and then retrofitted with ferrocement jackets with wire mesh at different
orientations. The results show that the percent increase in load carrying
capacity for beam retrofitted with ferrocement jackets with wire mesh at 0, 45,
60 degree angle with longitudinal axis of beam, varies from 45.87 to 52.29
percent. Also a considerable increase in energy absorption is observed for all
orientations. However, orientation at 45 degree shows higher percentage
increase in energy absorption followed by 60 and 0 degree respectively.
Keywords: ferrocement, retrofitting, jacket, wire mesh, orientation, beams.
Prem Pal Bansal, Maneek Kumar, S.K.Kaushik
International Journal of Engineering, Volume (2) : Issue (1) 9
1.0 INTRODUCTION
Reinforced concrete is one of the most abundantly used construction material, not only in
the developed world, but also in the remotest parts of the developing world. The RCC
structures constructed in the developed world are often found to exhibit distress and suffer
damage, even before their service period is over due to several causes such as improper
design, faulty construction, change of usage of the building, change in codal provisions,
overloading, earthquakes, explosion, corrosion, wear and tear, flood, fire etc.
Such unserviceable structures require immediate attention, enquiry into the cause of distress
and suitable remedial measures, so as to bring the structure into its functional use again.
In the last few decades several attempts have been made in India and abroad to study these
problems and to increase the life of the structures by suitable retrofitting and strengthening
techniques. Of the various retrofitting techniques available, plate bonding is one of the most
effective and convenient methods of retrofitting. Among the plate bonding techniques FRP
plates are quite popular now-a-days. But it is observed that the use of FRP is restricted to
developed countries or urban areas of the developing countries due to higher initial cost and
requirement of skilled labour for their application. Thus, there is a need to develop an
alternative technique, which is economical and can be executed at site with the help of semi-
skilled labour available at site. Ferrocement jacketing is found to be one such attractive
technique due to its properties such as good tensile strength, lightweight, overall economy,
water tightness, easy application and long life of the treatment.
Many experimental studies have been conducted in recent years to strengthen flexural
members by using various materials. Andrew and Sharma (1998) in an experimental study
compared the flexural performance of reinforced concrete beams repaired with
conventional method and ferrocement. They concluded that beams repaired by
ferrocement showed superior performance both at the service and ultimate load. The
flexural strength and ductility of beams repaired with ferrocement was reported to be
greater than the corresponding original beams and the beams repaired by the
conventional method.
Beams rehabilitated with ferrocement jackets show better performance in terms of ultimate
strength, first crack load, crack width, ductility and rigidity of the section. It was observed that
the cracking and ultimate strength increases by 10 percent and 40 percent in case of
rehabilitated beams, whereas these increases were 10-30 percent and 40-50 percent in case
of composite sections. The jacketing increases the rigidity of the beams and lead to 37
percent and 29 percent reduction in deflection. The crack width of the composite beams and
rehabilitated beams decreases on an average by 42 percent and 36 percent respectively
[Kaushik, S.K. and Dubey, A.K., 1994].
The addition of thin layer of ferrocement to a concrete beam enhances its ductility and
cracking strength. Composite beams reinforced with square mesh exhibit better overall
performance compared to composite beams reinforced with hexagonal mesh. An increase in
the number of layers improves the cracking stiffness of the composite beams in both cases.
[Nassif, H.H et al, 1998, Vidivelli, B. et al, 2001, Nasif, N.H. et al 2004].
A ferrocement shell improves the flexural behaviour of RCC beams, although there is no
increase in the moment carrying capacity of under reinforced beams. However, the moment
carrying capacity increased by 9 per cent and 15 per cent for balanced and over reinforced
sections respectively [Seshu, D.R., 2000].
The ultimate strength of the reinforced concrete beams, which failed due to overloading and
were repaired using ferrocement laminate, is affected by the level of damage sustained prior
to repairing. However, ultimate strength ductility ratio and energy absorption have been
reported to improve after the repair in all cases. The steel ratio used in the repair layer has a
great influence on the amount of gain in the resisting moment, ductility ratio and energy
absorption. The higher the steel ratio the higher the gain in resisting moment and energy
absorption; conversely, the ductility ratio was found to be decreased with increase in steel
ratio [Fahmy, Ezzat H. et al, 1997].
Paramasivam, P. et al (1994) studied the flexural behavior of reinforced concrete T-beams
strengthened with thin ferrocement laminate attached to the tension face using L-shaped mild
steel round bars as shear connectors. From the experimental investigation it was concluded
that after strengthening the performance of the beam improved substantially in terms of
strength, flexural rigidity and first crack load, provided the connectors are adequately spaced
Prem Pal Bansal, Maneek Kumar, S.K.Kaushik
International Journal of Engineering, Volume (2) : Issue (1) 10
and the surface to receive the laminate roughened to ensure sufficient bond strength for
composite action.
Thus, ferrocement is a viable alternative material for repair and strengthening of reinforced
concrete structures. It has been accepted by the local building authority in Singapore for use
in upgrading and rehabilitation of structures. The National Disaster Mitigation Agency
(NDMA), Government of India, also accepted the use of ferrocement for this purpose.
The behaviour of ferrocement in flexure depends upon various parameters such as mortar,
type of wire mesh, orientation of wire mesh etc.; hence the behaviour of ferrocement jackets.
In the present paper the effect of wire mesh orientation on the strength, toughness and
ductility of the retrofitted beams is presented.
2.0 EXPERIMENTAL PROGRAMME
To carry out the investigation, eight prototype beams of size 127mm x 227mm x 4100mm
reinforced with two bars of 10 mm diameter in tension and two bars of 8mm diameter in
compression were cast using the proportioned mix as shown in Fig.1. Out of these eight
beams, two were used as control beams (Type- A) and tested to failure to find out the safe
load carrying capacity corresponding to the allowable deflection as per IS:456-2000 i.e. span
/250. The other six beams were stressed to 75 percent of the safe load obtained from the
testing of the control beams and were then retrofitted with 15 mm thick ferrocement jackets
made with 1:2 cement sand mortar and w/c ratio 0.40 as shown in Fig. 2. The jacket was
reinforced with single layer of 40mm x 40mm square welded wire mesh. The three wire mesh
orientation viz. 0, 45, 60 degree were used in the ferrocement jackets.
The set of beams (two each) were divided into four categories depending upon the orientation
of wire mesh in the jacket. Control beams were designated as type-A, whereas, beams
retrofitted with welded wire mesh oriented at 0 degree were designated as type – B beams.
Retrofitted beams having welded wire mesh oriented at 45 degrees and 60 degrees were
designated as type – C and type-D, respectively. The same are shown in Plate 1
Fig. 1 Longitudinal and Cross-Section of Unretrofitted Under Reinforced Beams
(All Dimensions are in mm)
Prem Pal Bansal, Maneek Kumar, S.K.Kaushik
International Journal of Engineering, Volume (2) : Issue (1) 11
Figure 2: Longitudinal and Cross-Section of Retrofitted Beams
(a) 0
0
Orientation (b) 45
0
Orientation
(c) 600
Orientation
Plate 2 Different Wire Mesh Orientations
Prem Pal Bansal, Maneek Kumar, S.K.Kaushik
International Journal of Engineering, Volume (2) : Issue (1) 12
2.1 Materials
The properties of various materials used in the experimental study are reported in Tables 1 to
4
Sr. No. Characteristics Test Values Values as per IS:1489 (Part 1)
1 Standard consistency 34 -
2 Fineness of cement as retained on 90-
micron sieve (%)
0.5 < 10
3 Setting time (mins)
1. Initial
2. Final
84
300
> 30
< 600
4 Specific gravity
(Specific gravity bottle)
3.07 -
5 Compressive Strength (MPa)
1. 7days
2. 28 days
30.0
43.0
22.0
33.0
6 Soundness (mm)
(by Le-Chatelier’s method)
2.0 < 10 (Fresh Cement)
< 5 (Old Cement)
Table 1: Physical Properties of Portland Pozzolana Cement
Table 2: Physical Properties of Fine Aggregates
Table 3: Physical Properties of Coarse Aggregates
S. No. Characteristics Value
1. Specific gravity (oven dry basis) 2.52
2. Bulk density loose (kN/m
3
) 14.8
3. Fineness modulus 2.36
4. Water Absorption (%) 2.67
5. Grading Zone Zone II
ValueSr. No. Characteristics
CA-I CA-II
1. Type Crushed Crushed
2. Maximum Nominal Size (mm) 12.5 4.75
3. Specific gravity 2.68 2.70
4. Total water absorption (%) 1.45 1.643
5 Fineness modulus 7.45 6.21
Prem Pal Bansal, Maneek Kumar, S.K.Kaushik
International Journal of Engineering, Volume (2) : Issue (1) 13
Table 4: Physical Properties of Steel Bars and Steel Mesh Wires
2.2 Testing Arrangement
All the eight simply supported beams were tested with an effective span of 3.75 m. Two
concentrated loads were applied at 1m spacing for testing (see Fig -3). The beams were
tested using hydraulically operated jacks connected to a data acquisition system through the
load cells. With an increase in load the deflection in the beam was noted using three dial
gauges placed at the quarter span points. The same is shown in Plate 2
Fig. 3: Loading Arrangement for Testing of all Beam Specimens
(All Dimensions are in mm)
Sr.
No.
Diameter of bars/
mesh wire
(mm)
Yield-Strength
(N/mm2
)
Ultimate
Strength
(N/mm
2
)
Elongation
(percent)
1. 12 452.00 584.00 23.00
2. 10 470.00 580.0 20.0
3. 8 445.00 555.0 23.0
4. 6 442.42 612.7 32.9
5. 2.4 mm 400 511.36 2.52
Prem Pal Bansal, Maneek Kumar, S.K.Kaushik
International Journal of Engineering, Volume (2) : Issue (1) 14
Plate 1: Test Setup
2.3 Process of retrofitting
Firstly the surface of beam is cleaned. After cleaning the surface, the cement slurry is applied
as bonding agent to the surface of beam. After the application of bonding agent retrofitting of
beam is done by applying 15mm thick cement mortar on the three faces as ferrocement
jackets having wire mesh at different orientation. The beams are cured for 7days before
testing. Then with same procedure as of control beam, testing of beam is done in order to
calculate ultimate load and corresponding deflections.
3.0 RESULTS AND DISCUSSION
First, the two control beams were tested to failure. The load corresponding to an allowable
central deflection of 15 mm (span/250) was obtained from load deflection curve as 12.67 kN.
The remaining six beams were stressed to 75 percent of this average safe load i.e. 9.50 kN.
Subsequently the retrofitting of beams using different orientations of wire mesh in the
ferrocement jackets was carried out. These retrofitted beams were then loaded to failure and
the data was recorded in the form of load and deflection. Table 5 presents this data for the
control beams and beams retrofitted using specified wire mesh orientations. Fig 4 shows the
load deflection behaviour at the mid span points of the control as well as beams retrofitted
with different wire mesh orientations.
It is observed from the curves in Fig 4 that with an increase in load there is a considerable
increase in deflection for all the beams. It was also noted that the spacing of cracks was
45mm in case of beams retrofitted with wire mesh at zero degree as compared to beams
retrofitted with wire mesh at 450
, for which it was 85mm. The spacing increased to 108 mm for
60-degree orientation. This shows that the distribution of stress with wire mesh at zero degree
is better. It is also observed that corresponding to the serviceability requirement of 15 mm
deflection, the load increased from 12.67 kN for the control beam to 14.15 kN, 13.25 kN,
15.41 kN for type B, C and D retrofitted beams, respectively.
Prem Pal Bansal, Maneek Kumar, S.K.Kaushik
International Journal of Engineering, Volume (2) : Issue (1) 15
Figure 4: Load V/S. Deflection Curve At Mid Span For Control Beam And Beams Retrofitted With Wire
Mesh At Different Orientations
It is also observed from the curves that the deflection at the centre at maximum load is
maximum in the case of beams retrofitted with wire mesh at 45 degrees, which is 69.05mm as
compared to those with wire mesh at zero degree, for which it is 56.82mm, and for 60 degree,
for which it is 63.0 mm.
The load deflection curves were idealized as quadri-linear curves. Using the idealized curves
the ductility ratio i.e. ratio of deflection at ultimate load to yield load, and energy absorption i.e.
area under the curve up to ultimate load are calculated and presented in Table 6. It is
observed that the ductility ratio increases by 4.47, 0.40 and 0.82 percent and energy
absorption increases by 76.27, 73.98, and 70.42 percent for Type-B, Type-C and Type-D
beams respectively as compared to the control beams (Type-A).
The results indicate that the beams retrofitted with wire mesh at 45 degree as reinforcement
in the ferrocement jacket is best among all the three with regards to enhanced maximum load
carrying capacity followed by 60 degree and zero degree respectively. However, the ductility
ratio and energy absorption capacity is highest in case of beams retrofitted wire mesh at zero
degree followed by forty-five degrees and sixty degrees. The increase in ductility ratio and
energy absorption of beams retrofitted using ferrocement jacket having welded wire mesh at
different orientations, as reinforcement are makes the retrofitted beams suitable for dynamic
load applications.
0
5
10
15
20
25
30
35
0 20 40 60 80 100 120
Deflection (mm)
Load(kN)
Type-A
Type-B
Type-C
Type-D
Prem Pal Bansal, Maneek Kumar, S.K.Kaushik
International Journal of Engineering, Volume (2) : Issue (1) 16
S.
No
Control Beam
(Type –A
++
)
Beam with Wire Mesh at 00
(Type –B
++
)
Beam with Wire Mesh at 45
0
(Type –C
++
)
Beam with Wire Mesh at 60
0
(Type – D++
)
Deflection (mm) at Deflection (mm) at Deflection (mm) at Deflection (mm) atLoad
(kN) L/2 L/4
Load
(kN) L/2 L/4
Load
(kN) L/2 L/4
Load
(kN) L/2 L/4
1 3 2.1 1.20 3 2.8 1.8 3 3.35 2.12 3 2.43 1.82
2 4 3.0 1.82 4 4.4 3.0 4 4.42 3.0 4 3.58 2.4
3 6 5.0 3.02 6 7.0 4.89 6 6.50 4.5 6 5.61 3.16
4 8 8.3 5.00 8 9.0 6.48 8 8.87 6.0 8 7.30 4.20
5 10 10.98 7.00 10 10.87 7.76 10 10.9 7.74 10 9.76 4.87
6 12 14.0 9.22 12 12.8 9.2 12 13.75 9.26 12 11.85 6.0
7 14 17.0 11.2 14 14.76 10.15 14 15.75 11.45 14 13.24 7.76
8 16 20.0 13.50 16 17.95 13.42 16 17.63 13.98 16 15.73 9.84
9 20 28.0 19.00 18 20.34 15.36 18 20.42 16.76 18 18.00 11.95
10 21.8 44.85 33.4 20 22.76 16.9 20 23.2 17.5 20 21.00 13.72
11 21 61.28 22 24.76 18.5 22 26.8 21.0 22 23.33 15.0
12 18 76.28 24 28.4 20.22 24 32.0 25.0 24 27.00 17.5
13 26 36.0 24.0 26 34.4 28.0 26 34.00 24.0
14 28 47.05 32.04 28 38.0 31.45 28 50.00 36.34
15 30 53.82 - 30 41.95 35 30 58.20 41.52
16 31.8 56.82 32 57.37 40.2 31.9 63.0 45.51
17 30 80.62 33.2 69.05 42.82 29 78
18 25 100.62 26 99.05 25 102
Table 5: Load v/s. Deflection Data For Control Beam And Beams Retrofitted with Ferrocement Jacket having Welded Wire Mesh at Different Orientation
Prem Pal Bansal, Maneek Kumar, S.K.Kaushik
International Journal of Engineering, Volume (2) : Issue (1) 17
Sr.
No
Beam type Pmax
(kN)
Mmax
(kN-m)
Ductility
Ratio
*
Energy
Absorption
**
(kN-m)
Increase in
Energy
Absorption (%)
1 Type-A
++
21.8 14.99 2.46 1244.27 -
2
Type-B
++
31.8 21.862 2.57 2193.22 76.27
3 Type-C
++
33.2 22.825 2.46 2164.72 73.98
4 Type-D
++
31.9 21.93 2.48 2120.45 70.42
Table 6: Test Results of Beams Retrofitted Using Ferrocement Jacket having Welded Wire Mesh at Different
Orientation
* Ductility ratio of the beams is defined as ratio of deflection at ultimate load to the yield load calculated from
idealized quadri-linear load deflection curve
** Area under the load deflection curve upto ultimate load
A detailed cost analysis to check the economic feasibility of different wire mesh orientations is presented
in the succeeding section.
3.1 Cost Analysis
A comparative cost analysis for four types of beams is presented in Table 7.
It is noted that beams retrofitted with wire mesh oriented at zero degree are the most efficient of the three
orientations as its cost to strength ratio is the lowest at 1.19 as compared to the other two orientations for
which the value is 1.21 and 1.30 for wire mesh at 45 degrees and 60 degrees, respectively.
Thus, the beams retrofitted using ferrocement jackets having wire mesh orientation at zero degree are
most efficient (lowest cost to strength ratio) as compared to other orientations.
4.0 CONCLUSIONS
Based upon the test results of the experimental study undertaken, the following conclusions may be
drawn:
1. The beams retrofitted with wire mesh at different orientations do not de-bond when loaded to failure.
2. The failure of the composite is characterized by development of flexural cracks over the tension
zone. The spacing of cracks is reduced for retrofitted beams indicating better distribution of stress.
3. Wire mesh orientated at 45 degree for retrofitting the stressed beams has the highest load carrying
capacity as compared to control beam as well as the other beams retrofitted using different
orientations.
4. After retrofitting, all the test specimens showed reduced crack widths, large deflection at the ultimate
load, a significant increase in the ductility ratio, and considerable increase in the energy absorption
as well, making the components better equipped to resist dynamic loads.
5. Beams retrofitted with wire mesh oriented at zero degree were the most efficient as their cost to
strength ratio is lowest.
Prem Pal Bansal, Maneek Kumar, S.K.Kaushik
International Journal of Engineering, Volume (2) : Issue (1) 18
Cost (Rs.) of Beam typeMaterial Rate (Rs.)
A
++
B
++
C
++
D
++
Concrete Ingredients
Cement (kg) 215 215 215 215 215
Rebars (kg)
10mm
8mm
6mm
30.10
30.75
33.75
148.724
97.14
111.52
148.724
97.14
111.52
148.724
97.14
111.52
148.724
97.14
111.52
Coarse Aggregates (cft) 14.0 50.89 50.89 50.89 50.89
Fine aggregates (cft) 17.0 29.56 29.56 29.56 29.56
Labour for control beams Lump Sum 200 200 200 200
Cost of Ingredients 852.834 852.834 852.834 852.834
Retrofitting Material
Welded Wire mesh Lump Sum - 330 420
*
480
*
Additional material like cement,
Fine aggregates, screws etc.
Lump Sum - 107 107 107
Labour Lump Sum - 192 192 192
Cost of Retrofitting - 629 719 779
Total Cost 852.834 1481.834 1572.834 1631.834
Cost ratio 1.0 1.74 1.84 1.91
Strength Ratio 1.0 1.46 1.52 1.46
Cost/Strength Ratio 1.0 1.19 1.21 1.30
Table 7: Cost Analysis of Beams Retrofitted Using Ferrocement Jacket having Welded Wire Mesh at Different
Orientations
++
Beam Type A = Control unretrofitted beam
Beam Type B = Beam retrofitted with welded wire mesh oriented at zero degree
Beam Type C = Beam retrofitted with welded wire mesh oriented at 45 degree
Beam Type D = Beam retrofitted with welded wire mesh oriented at 60 degree
* The cost of the wire mesh at 45 degrees and 60 degrees orientation increases due to
wastages at these angles
5.0 REFERENCES
1. Andrews, G., Sharma, A.K., “Repaired Reinforced Concrete Beams” ACI, Concrete International,
pp. 47-50,1998
2. Fahmy, Ezzat H. , Shaheen, Youysry B.I. and Korany Yasser, S. “ Repairing Reinforced Concrete
Beams by ferrocement” Journal of Ferrocement: Vol. 27, No. 1, pp 19-32, January 1997.
3. IS: 456-2000, Indian Standard Plain and Reinforced Concrete-Code of Practice, Bureau of Indian
Standards, New Delhi.
4. Kaushik, S.K. and Dubey, A.K. “ Performance Evaluation of RC Ferrocement Composite Beams”
Proceedings of Fifth International Symposium, UMIST, pp 240- 256, 1994
Prem Pal Bansal, Maneek Kumar, S.K.Kaushik
International Journal of Engineering, Volume (2) : Issue (1) 19
5. Nassif, H.H., Chirravuri, G. and Sanders, M.C. “ Flexural Behavior of Ferrocement / Concrete
Composite Beams” Ferrocement 6: Lambot Symposium, Proceedings of the Sixth International
Symposium on Ferrocement, Universty of Michigan, Michigan USA, pp251 – 258, June 1998.
6. Nassif, Hani H. and Najm, Husam, “Experimental and analytical Investigation of Ferrocement-
Concrete Composite” Cement and Concrete Composite, Vol. 26, pp 787-796, 2004.
7. Paramasivam, P.,Ong, K.C.G. and Lim, C.T.E., “Ferrocement Laminate for Strengthening of RC
T-Beams” Cement and Concrete Composite, Vol. 16, pp 143-152, 1994.
8. Seshu, D.R. “ Flexural Behavior of Ferrocement Confined Reinforced Concrete (FCRC) Simply
Supported Beams” Journal of Ferrocement: Vol. 30, No. 3, pp 261-273, July 2000.
9. Vidivelli, B., Antiny Jeyasehar, C., and Srividya, P.R., “ Repair and Rehabilitation of Reinforced
Concrete Beams by Ferrocement” Seventh International Symposium on Ferrocement and Thin
Reinforced Cement Composites, National University of Singapore, 27-29, pp 465- 471, June
2001.

Effect of Wire Mesh Orientation on Strength of Beams Retrofitted using Ferrocement Jackets

  • 1.
    Prem Pal Bansal,Maneek Kumar, S.K.Kaushik International Journal of Engineering, Volume (2) : Issue (1) 8 Effect Of Wire Mesh Orientation On Strength Of Beams Retrofitted Using Ferrocement Jackets Prem Pal Bansal*, B.E. Civil, M.E, Civil (Structures) Lecturer, Department of Civil engineering, Thapar University, Patiala, INDIA 147 004 * Corresponding Author prempalbansal@yahoo.co.in prempal@gmail.com Dr. Maneek Kumar, B.E. Civil, M.E, Civil (Structures), Ph.D. Professor & Head, Department of Civil engineering, Thapar University, Patiala, INDIA 147 004 maneek@tiet.ac.in Dr. S.K. Kaushik, B.Tech. Civil, M.E, Civil (Structures), Ph.D. Formerly Professor and Head, Department of Civil Engineering, Indian Institute of Technology, Roorkee INDIA Abstract Various retrofitting techniques are used in field and out of all plate bonding technique is considered as the best. In this technique, the plates of different materials viz CFRP, GFRP, ferrocement etc are bonded to the surface of structural member to increase its strength. Ferrocement sheets are most commonly used as retrofitting material these days due to their easy availability, economy, durability, and their property of being cast to any shape without needing significant formwork. In the present work, effect of wire mesh orientation on the strength of stressed beams retrofitted with ferrocement jackets has been studied. The beams are stressed up to 75 percent of safe load and then retrofitted with ferrocement jackets with wire mesh at different orientations. The results show that the percent increase in load carrying capacity for beam retrofitted with ferrocement jackets with wire mesh at 0, 45, 60 degree angle with longitudinal axis of beam, varies from 45.87 to 52.29 percent. Also a considerable increase in energy absorption is observed for all orientations. However, orientation at 45 degree shows higher percentage increase in energy absorption followed by 60 and 0 degree respectively. Keywords: ferrocement, retrofitting, jacket, wire mesh, orientation, beams.
  • 2.
    Prem Pal Bansal,Maneek Kumar, S.K.Kaushik International Journal of Engineering, Volume (2) : Issue (1) 9 1.0 INTRODUCTION Reinforced concrete is one of the most abundantly used construction material, not only in the developed world, but also in the remotest parts of the developing world. The RCC structures constructed in the developed world are often found to exhibit distress and suffer damage, even before their service period is over due to several causes such as improper design, faulty construction, change of usage of the building, change in codal provisions, overloading, earthquakes, explosion, corrosion, wear and tear, flood, fire etc. Such unserviceable structures require immediate attention, enquiry into the cause of distress and suitable remedial measures, so as to bring the structure into its functional use again. In the last few decades several attempts have been made in India and abroad to study these problems and to increase the life of the structures by suitable retrofitting and strengthening techniques. Of the various retrofitting techniques available, plate bonding is one of the most effective and convenient methods of retrofitting. Among the plate bonding techniques FRP plates are quite popular now-a-days. But it is observed that the use of FRP is restricted to developed countries or urban areas of the developing countries due to higher initial cost and requirement of skilled labour for their application. Thus, there is a need to develop an alternative technique, which is economical and can be executed at site with the help of semi- skilled labour available at site. Ferrocement jacketing is found to be one such attractive technique due to its properties such as good tensile strength, lightweight, overall economy, water tightness, easy application and long life of the treatment. Many experimental studies have been conducted in recent years to strengthen flexural members by using various materials. Andrew and Sharma (1998) in an experimental study compared the flexural performance of reinforced concrete beams repaired with conventional method and ferrocement. They concluded that beams repaired by ferrocement showed superior performance both at the service and ultimate load. The flexural strength and ductility of beams repaired with ferrocement was reported to be greater than the corresponding original beams and the beams repaired by the conventional method. Beams rehabilitated with ferrocement jackets show better performance in terms of ultimate strength, first crack load, crack width, ductility and rigidity of the section. It was observed that the cracking and ultimate strength increases by 10 percent and 40 percent in case of rehabilitated beams, whereas these increases were 10-30 percent and 40-50 percent in case of composite sections. The jacketing increases the rigidity of the beams and lead to 37 percent and 29 percent reduction in deflection. The crack width of the composite beams and rehabilitated beams decreases on an average by 42 percent and 36 percent respectively [Kaushik, S.K. and Dubey, A.K., 1994]. The addition of thin layer of ferrocement to a concrete beam enhances its ductility and cracking strength. Composite beams reinforced with square mesh exhibit better overall performance compared to composite beams reinforced with hexagonal mesh. An increase in the number of layers improves the cracking stiffness of the composite beams in both cases. [Nassif, H.H et al, 1998, Vidivelli, B. et al, 2001, Nasif, N.H. et al 2004]. A ferrocement shell improves the flexural behaviour of RCC beams, although there is no increase in the moment carrying capacity of under reinforced beams. However, the moment carrying capacity increased by 9 per cent and 15 per cent for balanced and over reinforced sections respectively [Seshu, D.R., 2000]. The ultimate strength of the reinforced concrete beams, which failed due to overloading and were repaired using ferrocement laminate, is affected by the level of damage sustained prior to repairing. However, ultimate strength ductility ratio and energy absorption have been reported to improve after the repair in all cases. The steel ratio used in the repair layer has a great influence on the amount of gain in the resisting moment, ductility ratio and energy absorption. The higher the steel ratio the higher the gain in resisting moment and energy absorption; conversely, the ductility ratio was found to be decreased with increase in steel ratio [Fahmy, Ezzat H. et al, 1997]. Paramasivam, P. et al (1994) studied the flexural behavior of reinforced concrete T-beams strengthened with thin ferrocement laminate attached to the tension face using L-shaped mild steel round bars as shear connectors. From the experimental investigation it was concluded that after strengthening the performance of the beam improved substantially in terms of strength, flexural rigidity and first crack load, provided the connectors are adequately spaced
  • 3.
    Prem Pal Bansal,Maneek Kumar, S.K.Kaushik International Journal of Engineering, Volume (2) : Issue (1) 10 and the surface to receive the laminate roughened to ensure sufficient bond strength for composite action. Thus, ferrocement is a viable alternative material for repair and strengthening of reinforced concrete structures. It has been accepted by the local building authority in Singapore for use in upgrading and rehabilitation of structures. The National Disaster Mitigation Agency (NDMA), Government of India, also accepted the use of ferrocement for this purpose. The behaviour of ferrocement in flexure depends upon various parameters such as mortar, type of wire mesh, orientation of wire mesh etc.; hence the behaviour of ferrocement jackets. In the present paper the effect of wire mesh orientation on the strength, toughness and ductility of the retrofitted beams is presented. 2.0 EXPERIMENTAL PROGRAMME To carry out the investigation, eight prototype beams of size 127mm x 227mm x 4100mm reinforced with two bars of 10 mm diameter in tension and two bars of 8mm diameter in compression were cast using the proportioned mix as shown in Fig.1. Out of these eight beams, two were used as control beams (Type- A) and tested to failure to find out the safe load carrying capacity corresponding to the allowable deflection as per IS:456-2000 i.e. span /250. The other six beams were stressed to 75 percent of the safe load obtained from the testing of the control beams and were then retrofitted with 15 mm thick ferrocement jackets made with 1:2 cement sand mortar and w/c ratio 0.40 as shown in Fig. 2. The jacket was reinforced with single layer of 40mm x 40mm square welded wire mesh. The three wire mesh orientation viz. 0, 45, 60 degree were used in the ferrocement jackets. The set of beams (two each) were divided into four categories depending upon the orientation of wire mesh in the jacket. Control beams were designated as type-A, whereas, beams retrofitted with welded wire mesh oriented at 0 degree were designated as type – B beams. Retrofitted beams having welded wire mesh oriented at 45 degrees and 60 degrees were designated as type – C and type-D, respectively. The same are shown in Plate 1 Fig. 1 Longitudinal and Cross-Section of Unretrofitted Under Reinforced Beams (All Dimensions are in mm)
  • 4.
    Prem Pal Bansal,Maneek Kumar, S.K.Kaushik International Journal of Engineering, Volume (2) : Issue (1) 11 Figure 2: Longitudinal and Cross-Section of Retrofitted Beams (a) 0 0 Orientation (b) 45 0 Orientation (c) 600 Orientation Plate 2 Different Wire Mesh Orientations
  • 5.
    Prem Pal Bansal,Maneek Kumar, S.K.Kaushik International Journal of Engineering, Volume (2) : Issue (1) 12 2.1 Materials The properties of various materials used in the experimental study are reported in Tables 1 to 4 Sr. No. Characteristics Test Values Values as per IS:1489 (Part 1) 1 Standard consistency 34 - 2 Fineness of cement as retained on 90- micron sieve (%) 0.5 < 10 3 Setting time (mins) 1. Initial 2. Final 84 300 > 30 < 600 4 Specific gravity (Specific gravity bottle) 3.07 - 5 Compressive Strength (MPa) 1. 7days 2. 28 days 30.0 43.0 22.0 33.0 6 Soundness (mm) (by Le-Chatelier’s method) 2.0 < 10 (Fresh Cement) < 5 (Old Cement) Table 1: Physical Properties of Portland Pozzolana Cement Table 2: Physical Properties of Fine Aggregates Table 3: Physical Properties of Coarse Aggregates S. No. Characteristics Value 1. Specific gravity (oven dry basis) 2.52 2. Bulk density loose (kN/m 3 ) 14.8 3. Fineness modulus 2.36 4. Water Absorption (%) 2.67 5. Grading Zone Zone II ValueSr. No. Characteristics CA-I CA-II 1. Type Crushed Crushed 2. Maximum Nominal Size (mm) 12.5 4.75 3. Specific gravity 2.68 2.70 4. Total water absorption (%) 1.45 1.643 5 Fineness modulus 7.45 6.21
  • 6.
    Prem Pal Bansal,Maneek Kumar, S.K.Kaushik International Journal of Engineering, Volume (2) : Issue (1) 13 Table 4: Physical Properties of Steel Bars and Steel Mesh Wires 2.2 Testing Arrangement All the eight simply supported beams were tested with an effective span of 3.75 m. Two concentrated loads were applied at 1m spacing for testing (see Fig -3). The beams were tested using hydraulically operated jacks connected to a data acquisition system through the load cells. With an increase in load the deflection in the beam was noted using three dial gauges placed at the quarter span points. The same is shown in Plate 2 Fig. 3: Loading Arrangement for Testing of all Beam Specimens (All Dimensions are in mm) Sr. No. Diameter of bars/ mesh wire (mm) Yield-Strength (N/mm2 ) Ultimate Strength (N/mm 2 ) Elongation (percent) 1. 12 452.00 584.00 23.00 2. 10 470.00 580.0 20.0 3. 8 445.00 555.0 23.0 4. 6 442.42 612.7 32.9 5. 2.4 mm 400 511.36 2.52
  • 7.
    Prem Pal Bansal,Maneek Kumar, S.K.Kaushik International Journal of Engineering, Volume (2) : Issue (1) 14 Plate 1: Test Setup 2.3 Process of retrofitting Firstly the surface of beam is cleaned. After cleaning the surface, the cement slurry is applied as bonding agent to the surface of beam. After the application of bonding agent retrofitting of beam is done by applying 15mm thick cement mortar on the three faces as ferrocement jackets having wire mesh at different orientation. The beams are cured for 7days before testing. Then with same procedure as of control beam, testing of beam is done in order to calculate ultimate load and corresponding deflections. 3.0 RESULTS AND DISCUSSION First, the two control beams were tested to failure. The load corresponding to an allowable central deflection of 15 mm (span/250) was obtained from load deflection curve as 12.67 kN. The remaining six beams were stressed to 75 percent of this average safe load i.e. 9.50 kN. Subsequently the retrofitting of beams using different orientations of wire mesh in the ferrocement jackets was carried out. These retrofitted beams were then loaded to failure and the data was recorded in the form of load and deflection. Table 5 presents this data for the control beams and beams retrofitted using specified wire mesh orientations. Fig 4 shows the load deflection behaviour at the mid span points of the control as well as beams retrofitted with different wire mesh orientations. It is observed from the curves in Fig 4 that with an increase in load there is a considerable increase in deflection for all the beams. It was also noted that the spacing of cracks was 45mm in case of beams retrofitted with wire mesh at zero degree as compared to beams retrofitted with wire mesh at 450 , for which it was 85mm. The spacing increased to 108 mm for 60-degree orientation. This shows that the distribution of stress with wire mesh at zero degree is better. It is also observed that corresponding to the serviceability requirement of 15 mm deflection, the load increased from 12.67 kN for the control beam to 14.15 kN, 13.25 kN, 15.41 kN for type B, C and D retrofitted beams, respectively.
  • 8.
    Prem Pal Bansal,Maneek Kumar, S.K.Kaushik International Journal of Engineering, Volume (2) : Issue (1) 15 Figure 4: Load V/S. Deflection Curve At Mid Span For Control Beam And Beams Retrofitted With Wire Mesh At Different Orientations It is also observed from the curves that the deflection at the centre at maximum load is maximum in the case of beams retrofitted with wire mesh at 45 degrees, which is 69.05mm as compared to those with wire mesh at zero degree, for which it is 56.82mm, and for 60 degree, for which it is 63.0 mm. The load deflection curves were idealized as quadri-linear curves. Using the idealized curves the ductility ratio i.e. ratio of deflection at ultimate load to yield load, and energy absorption i.e. area under the curve up to ultimate load are calculated and presented in Table 6. It is observed that the ductility ratio increases by 4.47, 0.40 and 0.82 percent and energy absorption increases by 76.27, 73.98, and 70.42 percent for Type-B, Type-C and Type-D beams respectively as compared to the control beams (Type-A). The results indicate that the beams retrofitted with wire mesh at 45 degree as reinforcement in the ferrocement jacket is best among all the three with regards to enhanced maximum load carrying capacity followed by 60 degree and zero degree respectively. However, the ductility ratio and energy absorption capacity is highest in case of beams retrofitted wire mesh at zero degree followed by forty-five degrees and sixty degrees. The increase in ductility ratio and energy absorption of beams retrofitted using ferrocement jacket having welded wire mesh at different orientations, as reinforcement are makes the retrofitted beams suitable for dynamic load applications. 0 5 10 15 20 25 30 35 0 20 40 60 80 100 120 Deflection (mm) Load(kN) Type-A Type-B Type-C Type-D
  • 9.
    Prem Pal Bansal,Maneek Kumar, S.K.Kaushik International Journal of Engineering, Volume (2) : Issue (1) 16 S. No Control Beam (Type –A ++ ) Beam with Wire Mesh at 00 (Type –B ++ ) Beam with Wire Mesh at 45 0 (Type –C ++ ) Beam with Wire Mesh at 60 0 (Type – D++ ) Deflection (mm) at Deflection (mm) at Deflection (mm) at Deflection (mm) atLoad (kN) L/2 L/4 Load (kN) L/2 L/4 Load (kN) L/2 L/4 Load (kN) L/2 L/4 1 3 2.1 1.20 3 2.8 1.8 3 3.35 2.12 3 2.43 1.82 2 4 3.0 1.82 4 4.4 3.0 4 4.42 3.0 4 3.58 2.4 3 6 5.0 3.02 6 7.0 4.89 6 6.50 4.5 6 5.61 3.16 4 8 8.3 5.00 8 9.0 6.48 8 8.87 6.0 8 7.30 4.20 5 10 10.98 7.00 10 10.87 7.76 10 10.9 7.74 10 9.76 4.87 6 12 14.0 9.22 12 12.8 9.2 12 13.75 9.26 12 11.85 6.0 7 14 17.0 11.2 14 14.76 10.15 14 15.75 11.45 14 13.24 7.76 8 16 20.0 13.50 16 17.95 13.42 16 17.63 13.98 16 15.73 9.84 9 20 28.0 19.00 18 20.34 15.36 18 20.42 16.76 18 18.00 11.95 10 21.8 44.85 33.4 20 22.76 16.9 20 23.2 17.5 20 21.00 13.72 11 21 61.28 22 24.76 18.5 22 26.8 21.0 22 23.33 15.0 12 18 76.28 24 28.4 20.22 24 32.0 25.0 24 27.00 17.5 13 26 36.0 24.0 26 34.4 28.0 26 34.00 24.0 14 28 47.05 32.04 28 38.0 31.45 28 50.00 36.34 15 30 53.82 - 30 41.95 35 30 58.20 41.52 16 31.8 56.82 32 57.37 40.2 31.9 63.0 45.51 17 30 80.62 33.2 69.05 42.82 29 78 18 25 100.62 26 99.05 25 102 Table 5: Load v/s. Deflection Data For Control Beam And Beams Retrofitted with Ferrocement Jacket having Welded Wire Mesh at Different Orientation
  • 10.
    Prem Pal Bansal,Maneek Kumar, S.K.Kaushik International Journal of Engineering, Volume (2) : Issue (1) 17 Sr. No Beam type Pmax (kN) Mmax (kN-m) Ductility Ratio * Energy Absorption ** (kN-m) Increase in Energy Absorption (%) 1 Type-A ++ 21.8 14.99 2.46 1244.27 - 2 Type-B ++ 31.8 21.862 2.57 2193.22 76.27 3 Type-C ++ 33.2 22.825 2.46 2164.72 73.98 4 Type-D ++ 31.9 21.93 2.48 2120.45 70.42 Table 6: Test Results of Beams Retrofitted Using Ferrocement Jacket having Welded Wire Mesh at Different Orientation * Ductility ratio of the beams is defined as ratio of deflection at ultimate load to the yield load calculated from idealized quadri-linear load deflection curve ** Area under the load deflection curve upto ultimate load A detailed cost analysis to check the economic feasibility of different wire mesh orientations is presented in the succeeding section. 3.1 Cost Analysis A comparative cost analysis for four types of beams is presented in Table 7. It is noted that beams retrofitted with wire mesh oriented at zero degree are the most efficient of the three orientations as its cost to strength ratio is the lowest at 1.19 as compared to the other two orientations for which the value is 1.21 and 1.30 for wire mesh at 45 degrees and 60 degrees, respectively. Thus, the beams retrofitted using ferrocement jackets having wire mesh orientation at zero degree are most efficient (lowest cost to strength ratio) as compared to other orientations. 4.0 CONCLUSIONS Based upon the test results of the experimental study undertaken, the following conclusions may be drawn: 1. The beams retrofitted with wire mesh at different orientations do not de-bond when loaded to failure. 2. The failure of the composite is characterized by development of flexural cracks over the tension zone. The spacing of cracks is reduced for retrofitted beams indicating better distribution of stress. 3. Wire mesh orientated at 45 degree for retrofitting the stressed beams has the highest load carrying capacity as compared to control beam as well as the other beams retrofitted using different orientations. 4. After retrofitting, all the test specimens showed reduced crack widths, large deflection at the ultimate load, a significant increase in the ductility ratio, and considerable increase in the energy absorption as well, making the components better equipped to resist dynamic loads. 5. Beams retrofitted with wire mesh oriented at zero degree were the most efficient as their cost to strength ratio is lowest.
  • 11.
    Prem Pal Bansal,Maneek Kumar, S.K.Kaushik International Journal of Engineering, Volume (2) : Issue (1) 18 Cost (Rs.) of Beam typeMaterial Rate (Rs.) A ++ B ++ C ++ D ++ Concrete Ingredients Cement (kg) 215 215 215 215 215 Rebars (kg) 10mm 8mm 6mm 30.10 30.75 33.75 148.724 97.14 111.52 148.724 97.14 111.52 148.724 97.14 111.52 148.724 97.14 111.52 Coarse Aggregates (cft) 14.0 50.89 50.89 50.89 50.89 Fine aggregates (cft) 17.0 29.56 29.56 29.56 29.56 Labour for control beams Lump Sum 200 200 200 200 Cost of Ingredients 852.834 852.834 852.834 852.834 Retrofitting Material Welded Wire mesh Lump Sum - 330 420 * 480 * Additional material like cement, Fine aggregates, screws etc. Lump Sum - 107 107 107 Labour Lump Sum - 192 192 192 Cost of Retrofitting - 629 719 779 Total Cost 852.834 1481.834 1572.834 1631.834 Cost ratio 1.0 1.74 1.84 1.91 Strength Ratio 1.0 1.46 1.52 1.46 Cost/Strength Ratio 1.0 1.19 1.21 1.30 Table 7: Cost Analysis of Beams Retrofitted Using Ferrocement Jacket having Welded Wire Mesh at Different Orientations ++ Beam Type A = Control unretrofitted beam Beam Type B = Beam retrofitted with welded wire mesh oriented at zero degree Beam Type C = Beam retrofitted with welded wire mesh oriented at 45 degree Beam Type D = Beam retrofitted with welded wire mesh oriented at 60 degree * The cost of the wire mesh at 45 degrees and 60 degrees orientation increases due to wastages at these angles 5.0 REFERENCES 1. Andrews, G., Sharma, A.K., “Repaired Reinforced Concrete Beams” ACI, Concrete International, pp. 47-50,1998 2. Fahmy, Ezzat H. , Shaheen, Youysry B.I. and Korany Yasser, S. “ Repairing Reinforced Concrete Beams by ferrocement” Journal of Ferrocement: Vol. 27, No. 1, pp 19-32, January 1997. 3. IS: 456-2000, Indian Standard Plain and Reinforced Concrete-Code of Practice, Bureau of Indian Standards, New Delhi. 4. Kaushik, S.K. and Dubey, A.K. “ Performance Evaluation of RC Ferrocement Composite Beams” Proceedings of Fifth International Symposium, UMIST, pp 240- 256, 1994
  • 12.
    Prem Pal Bansal,Maneek Kumar, S.K.Kaushik International Journal of Engineering, Volume (2) : Issue (1) 19 5. Nassif, H.H., Chirravuri, G. and Sanders, M.C. “ Flexural Behavior of Ferrocement / Concrete Composite Beams” Ferrocement 6: Lambot Symposium, Proceedings of the Sixth International Symposium on Ferrocement, Universty of Michigan, Michigan USA, pp251 – 258, June 1998. 6. Nassif, Hani H. and Najm, Husam, “Experimental and analytical Investigation of Ferrocement- Concrete Composite” Cement and Concrete Composite, Vol. 26, pp 787-796, 2004. 7. Paramasivam, P.,Ong, K.C.G. and Lim, C.T.E., “Ferrocement Laminate for Strengthening of RC T-Beams” Cement and Concrete Composite, Vol. 16, pp 143-152, 1994. 8. Seshu, D.R. “ Flexural Behavior of Ferrocement Confined Reinforced Concrete (FCRC) Simply Supported Beams” Journal of Ferrocement: Vol. 30, No. 3, pp 261-273, July 2000. 9. Vidivelli, B., Antiny Jeyasehar, C., and Srividya, P.R., “ Repair and Rehabilitation of Reinforced Concrete Beams by Ferrocement” Seventh International Symposium on Ferrocement and Thin Reinforced Cement Composites, National University of Singapore, 27-29, pp 465- 471, June 2001.