Downloaded 493 times
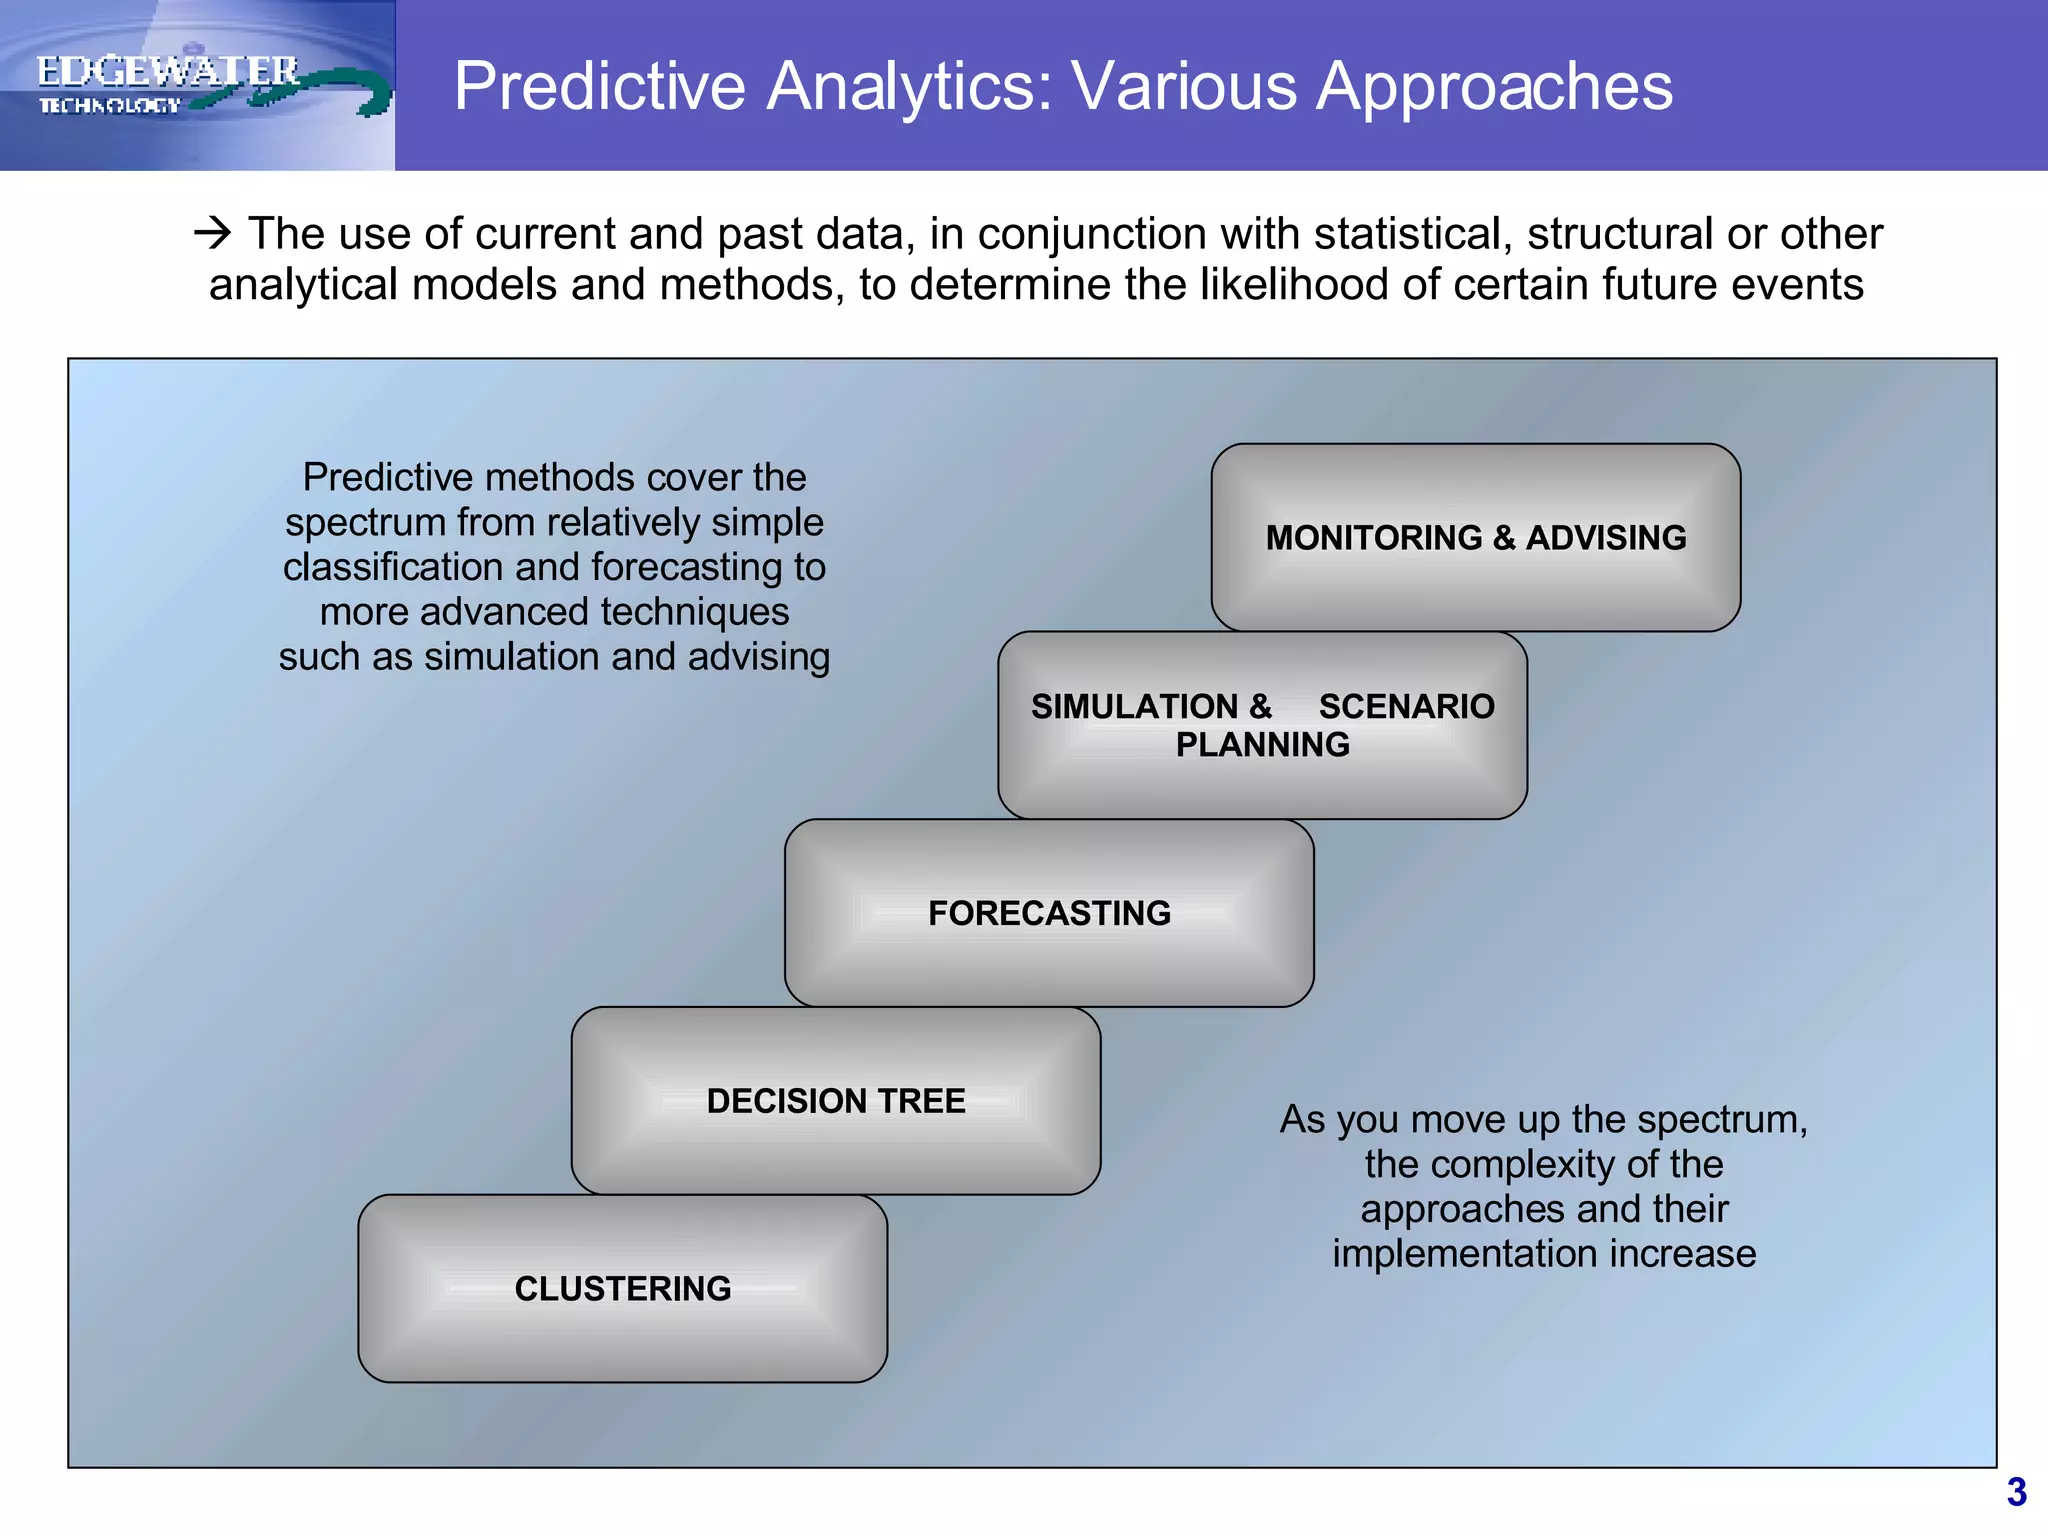
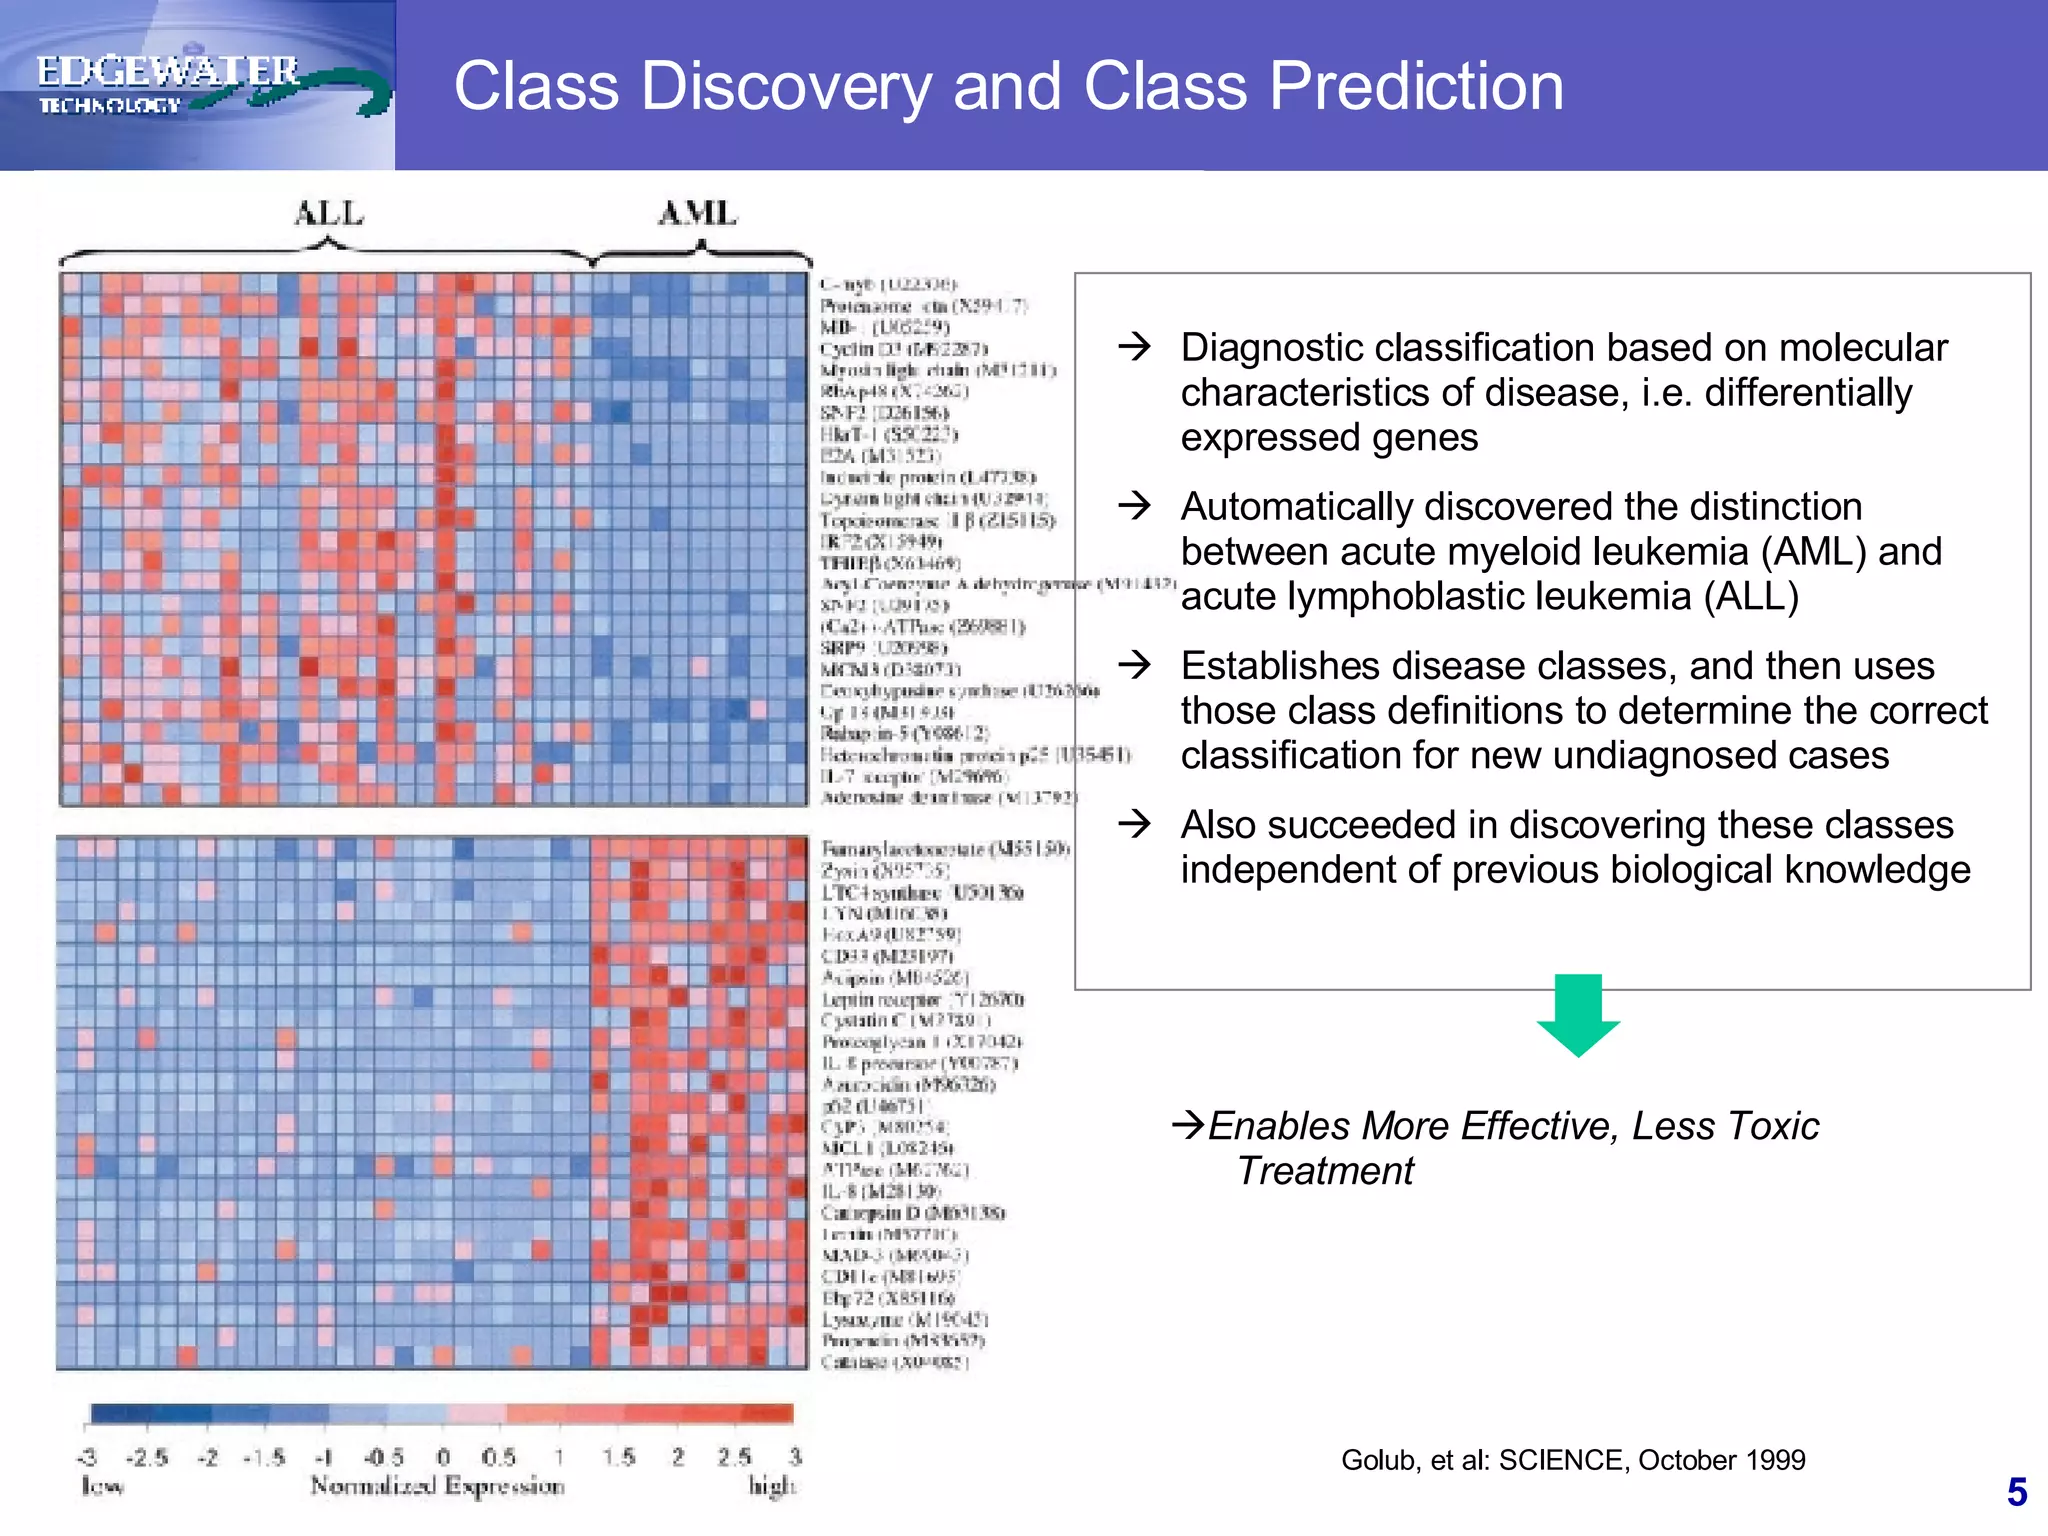
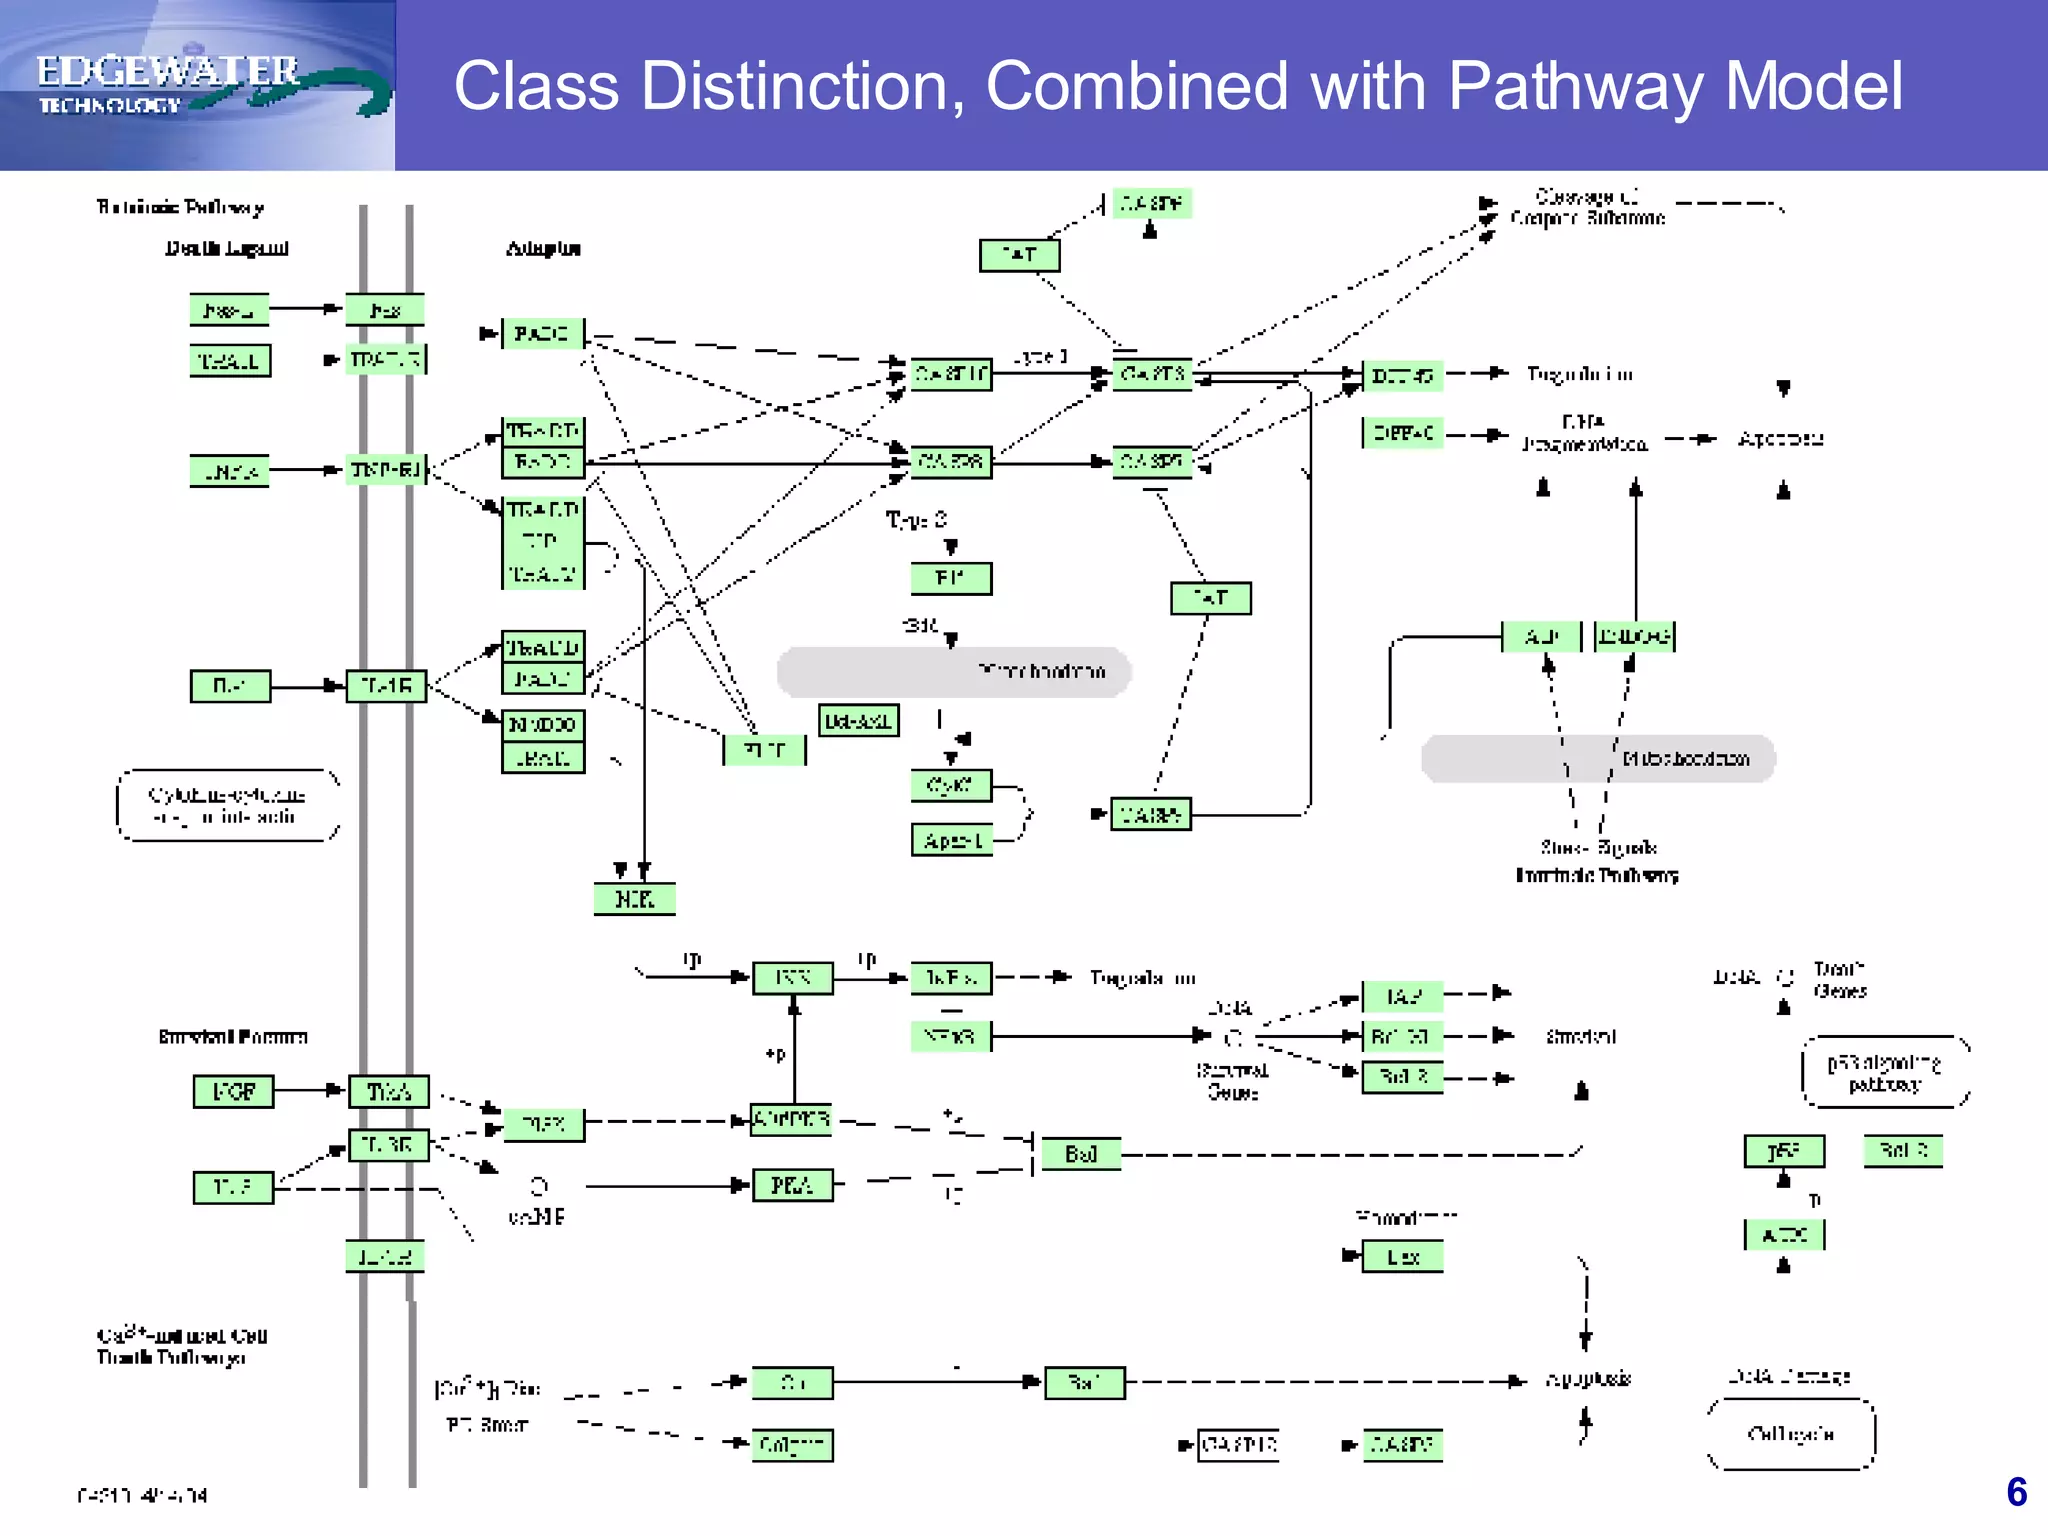
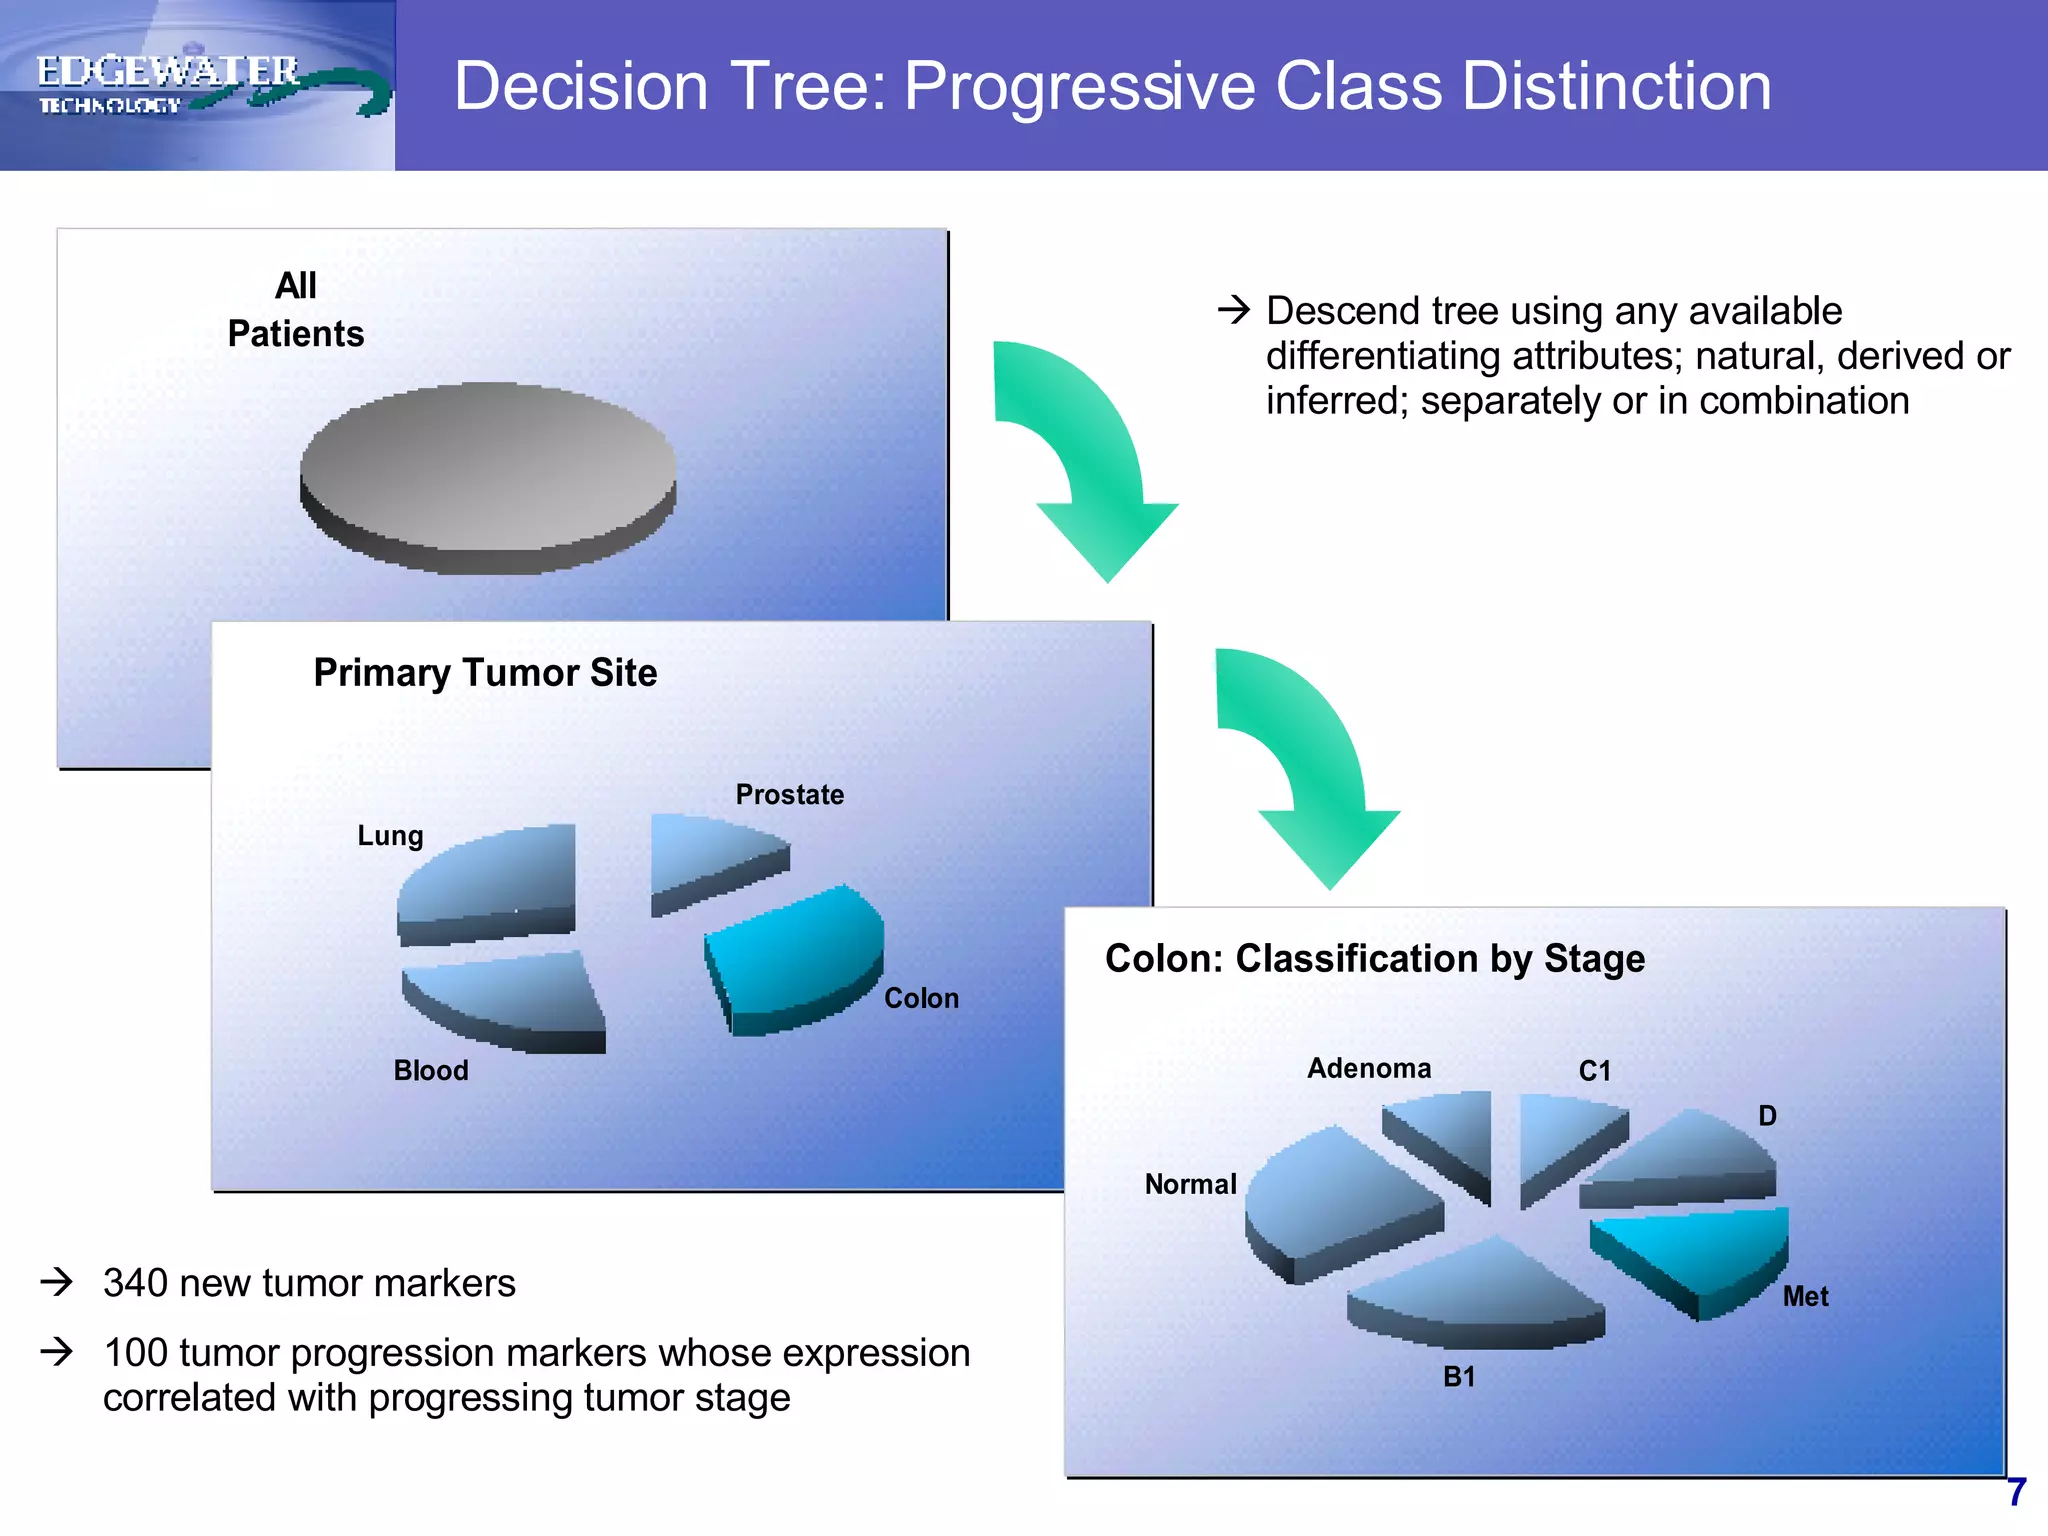
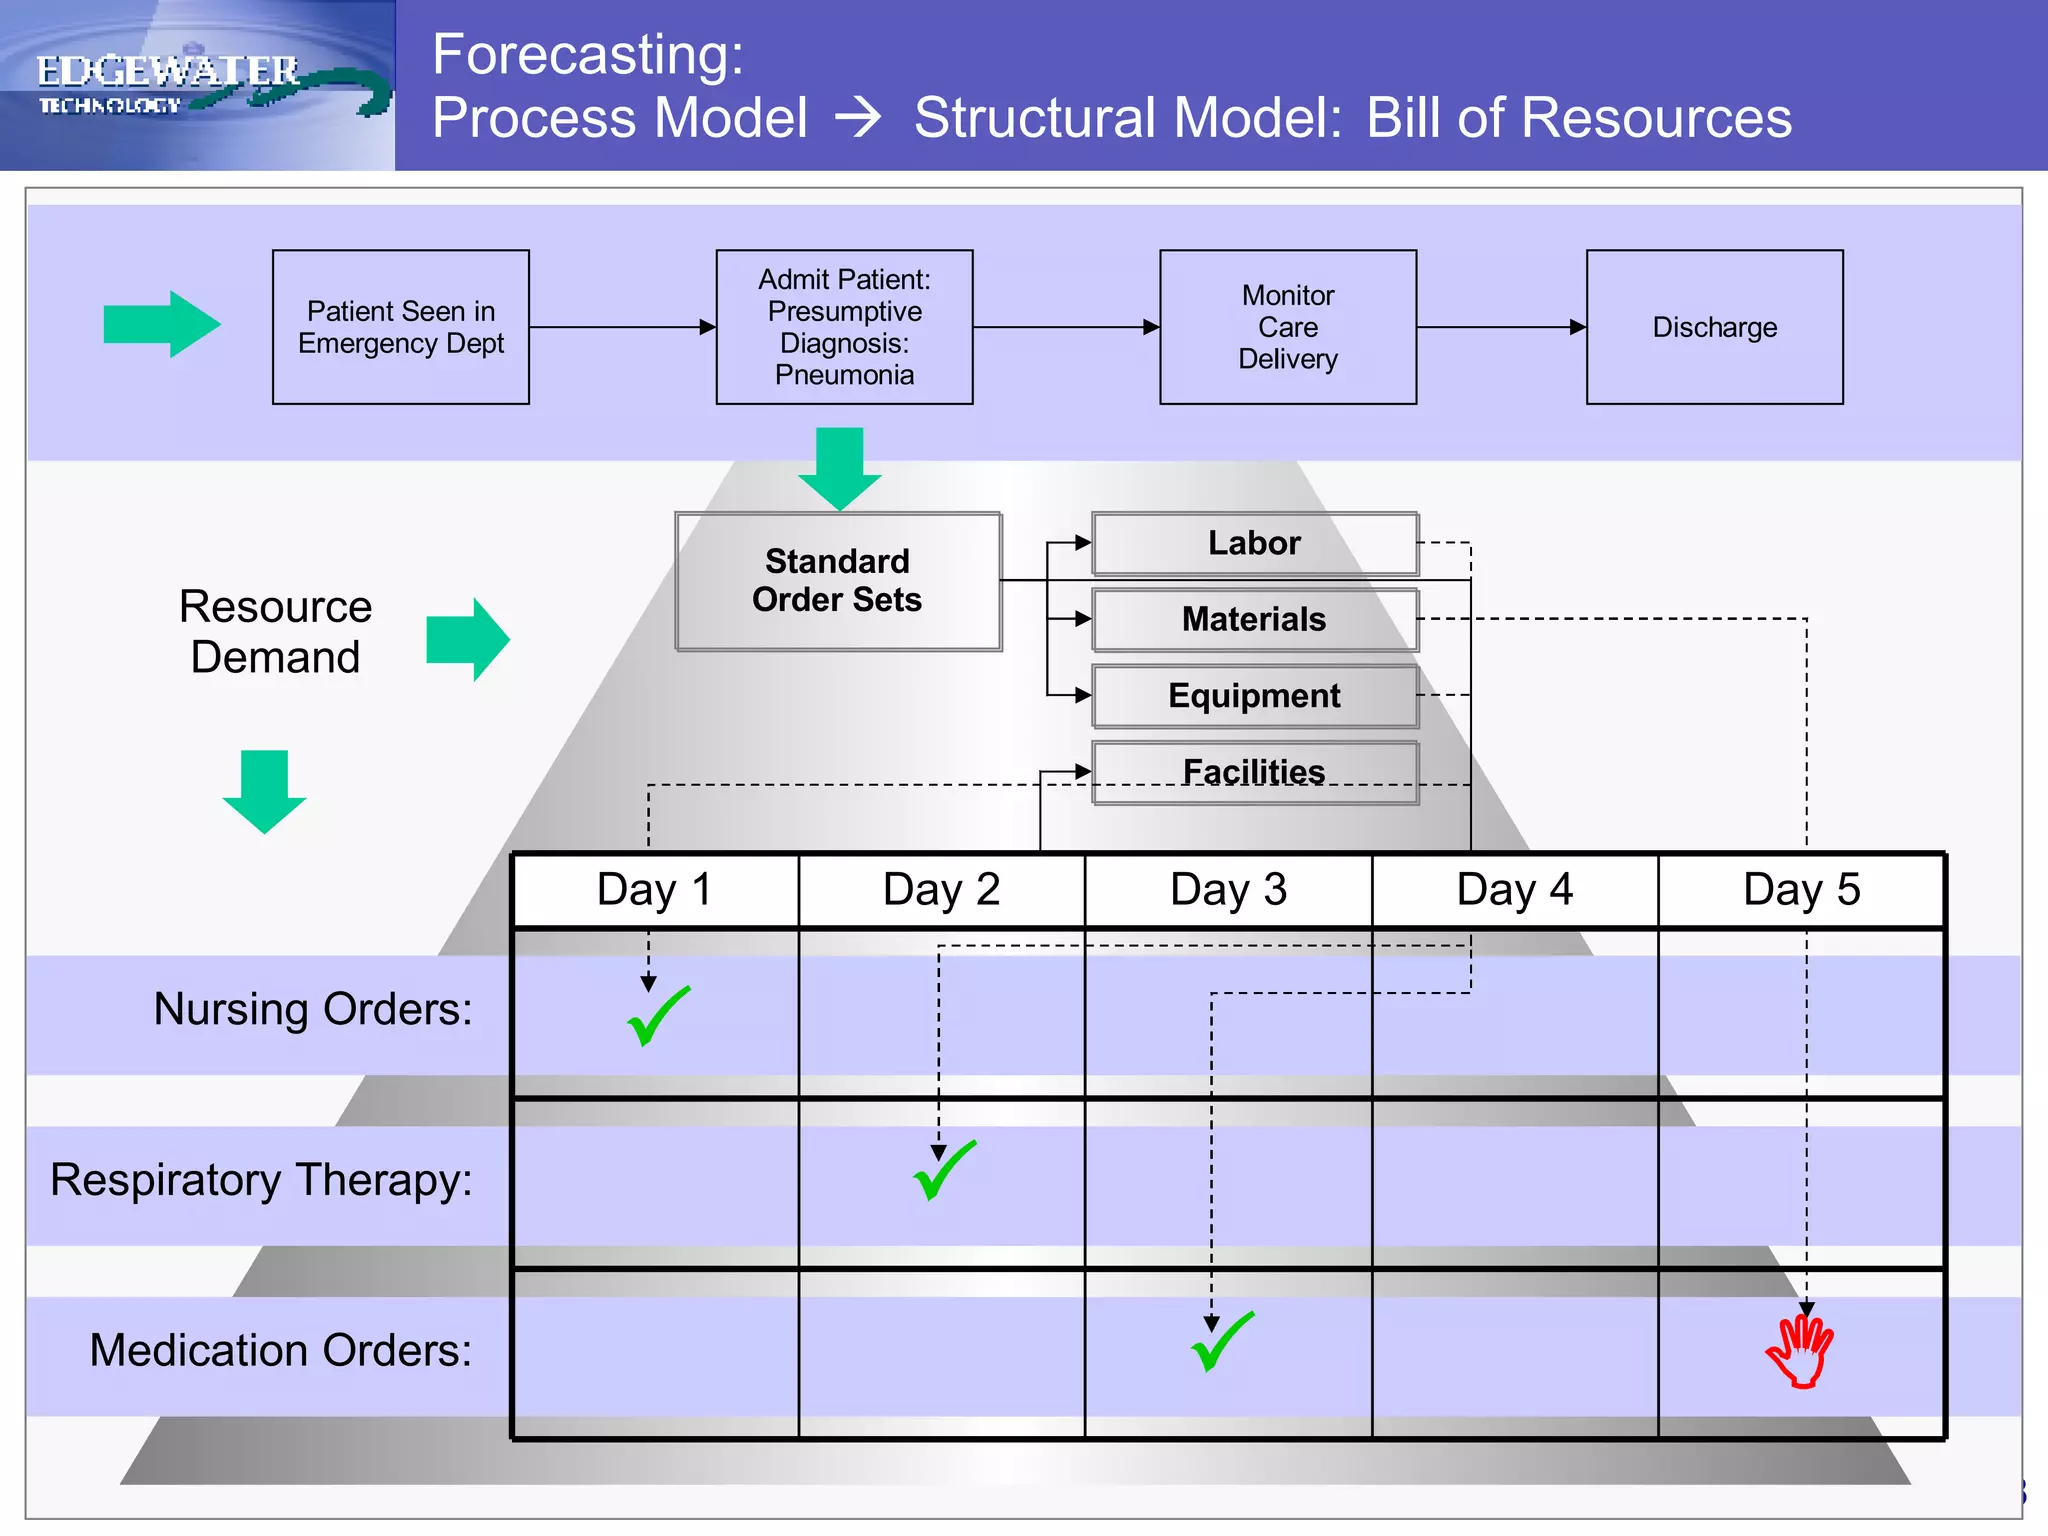
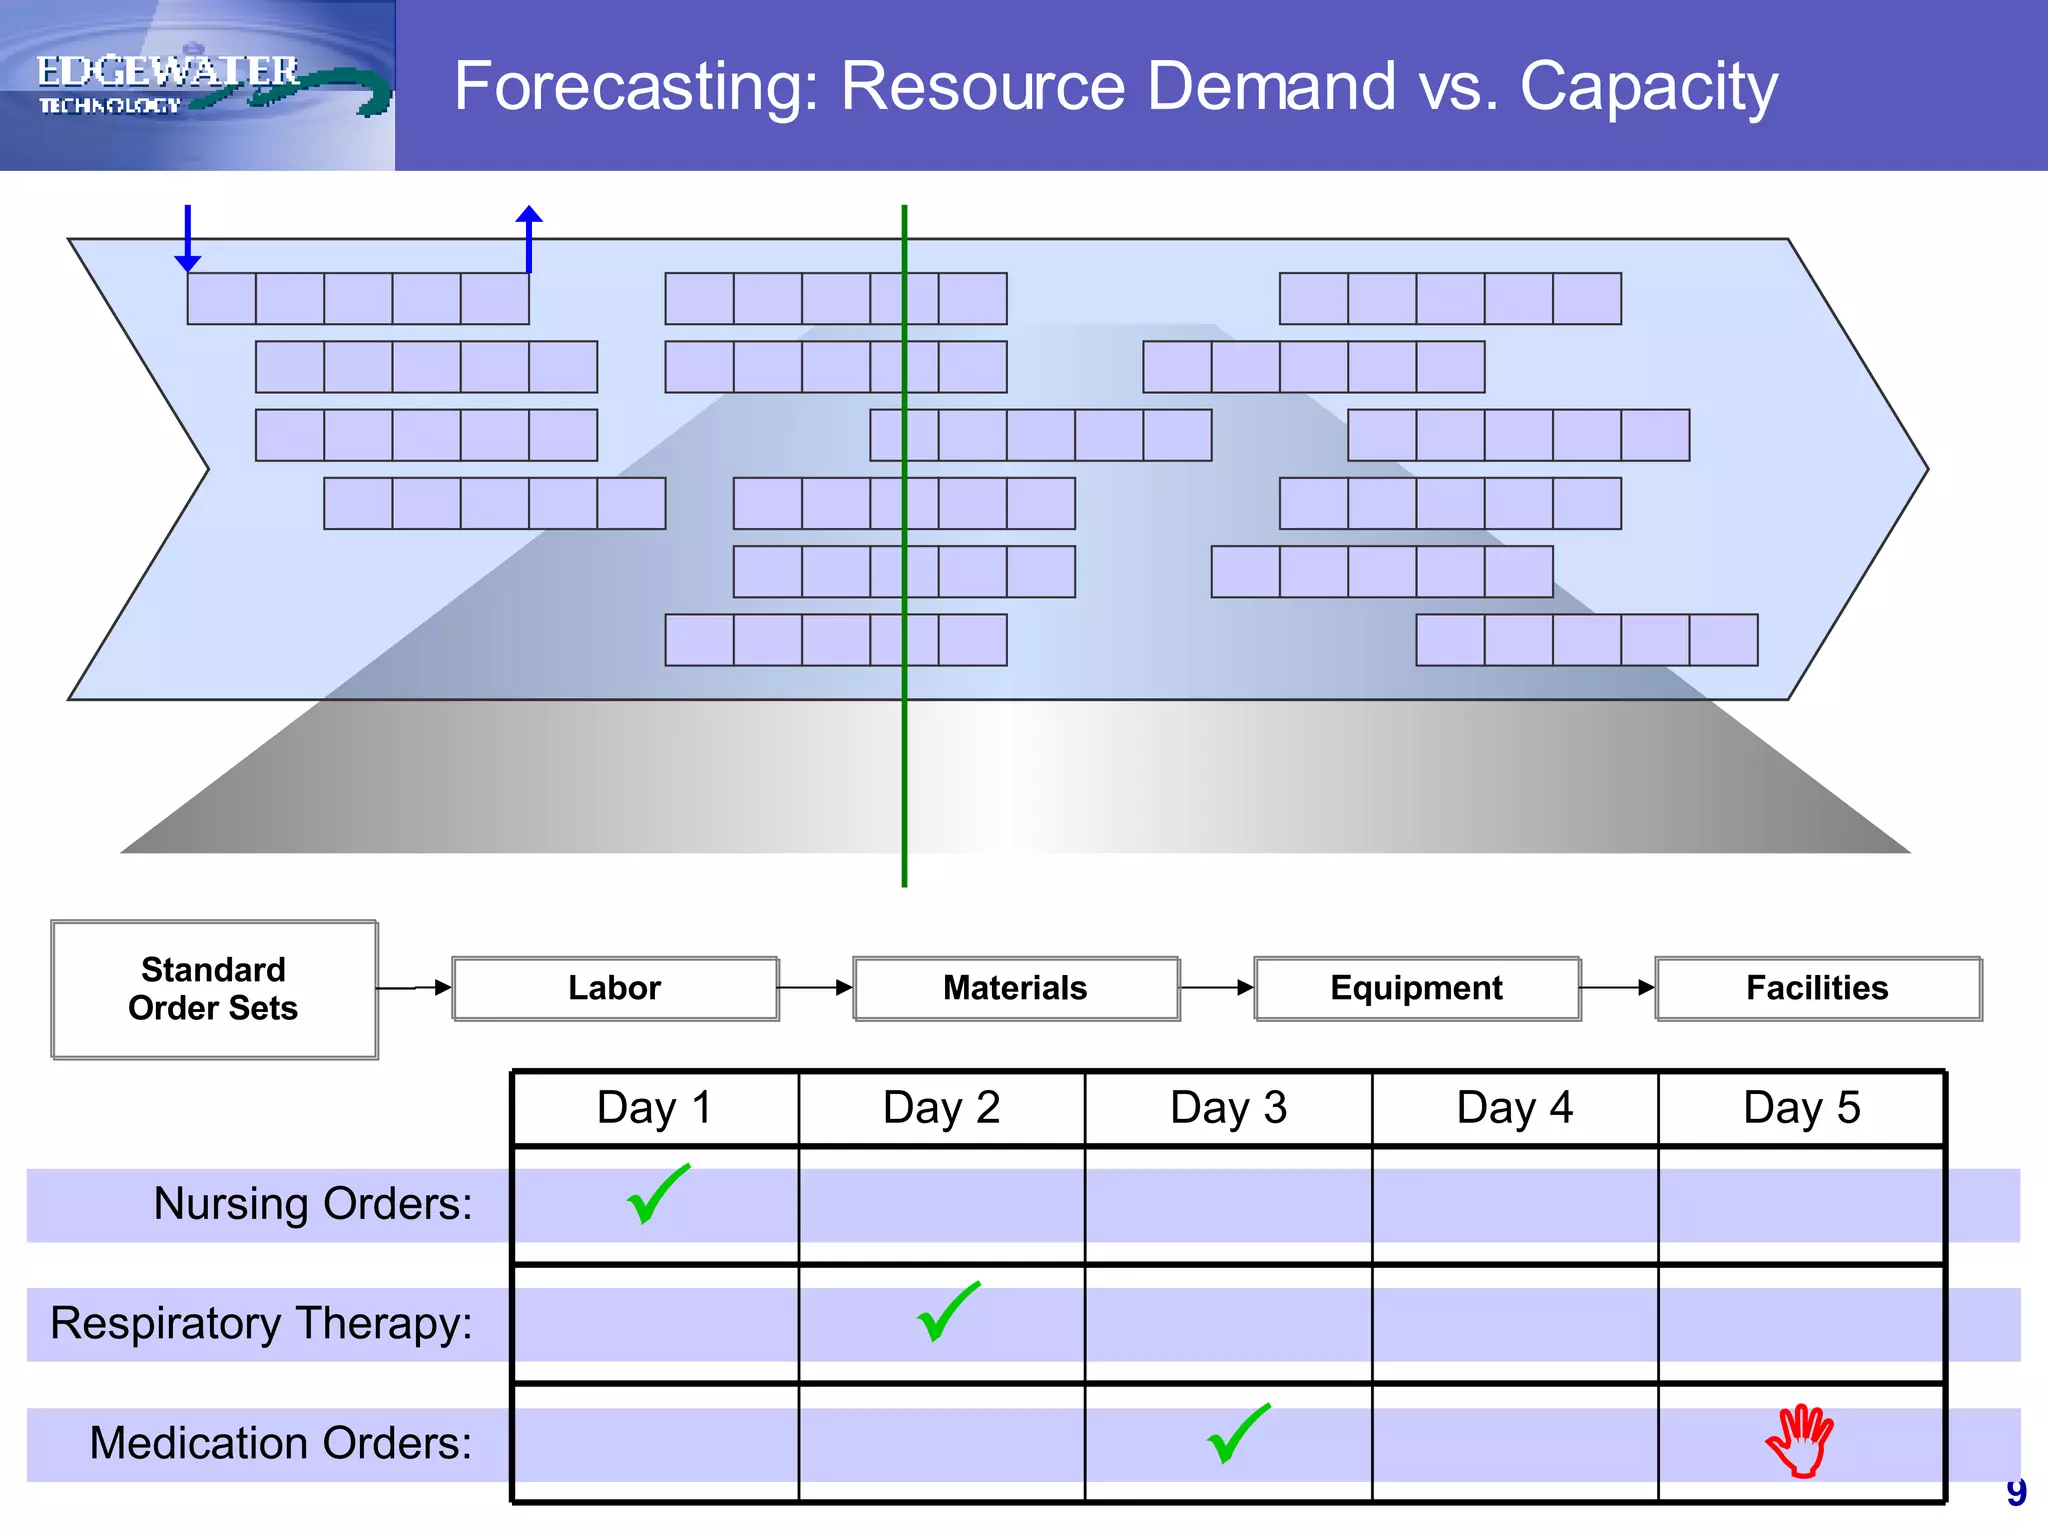
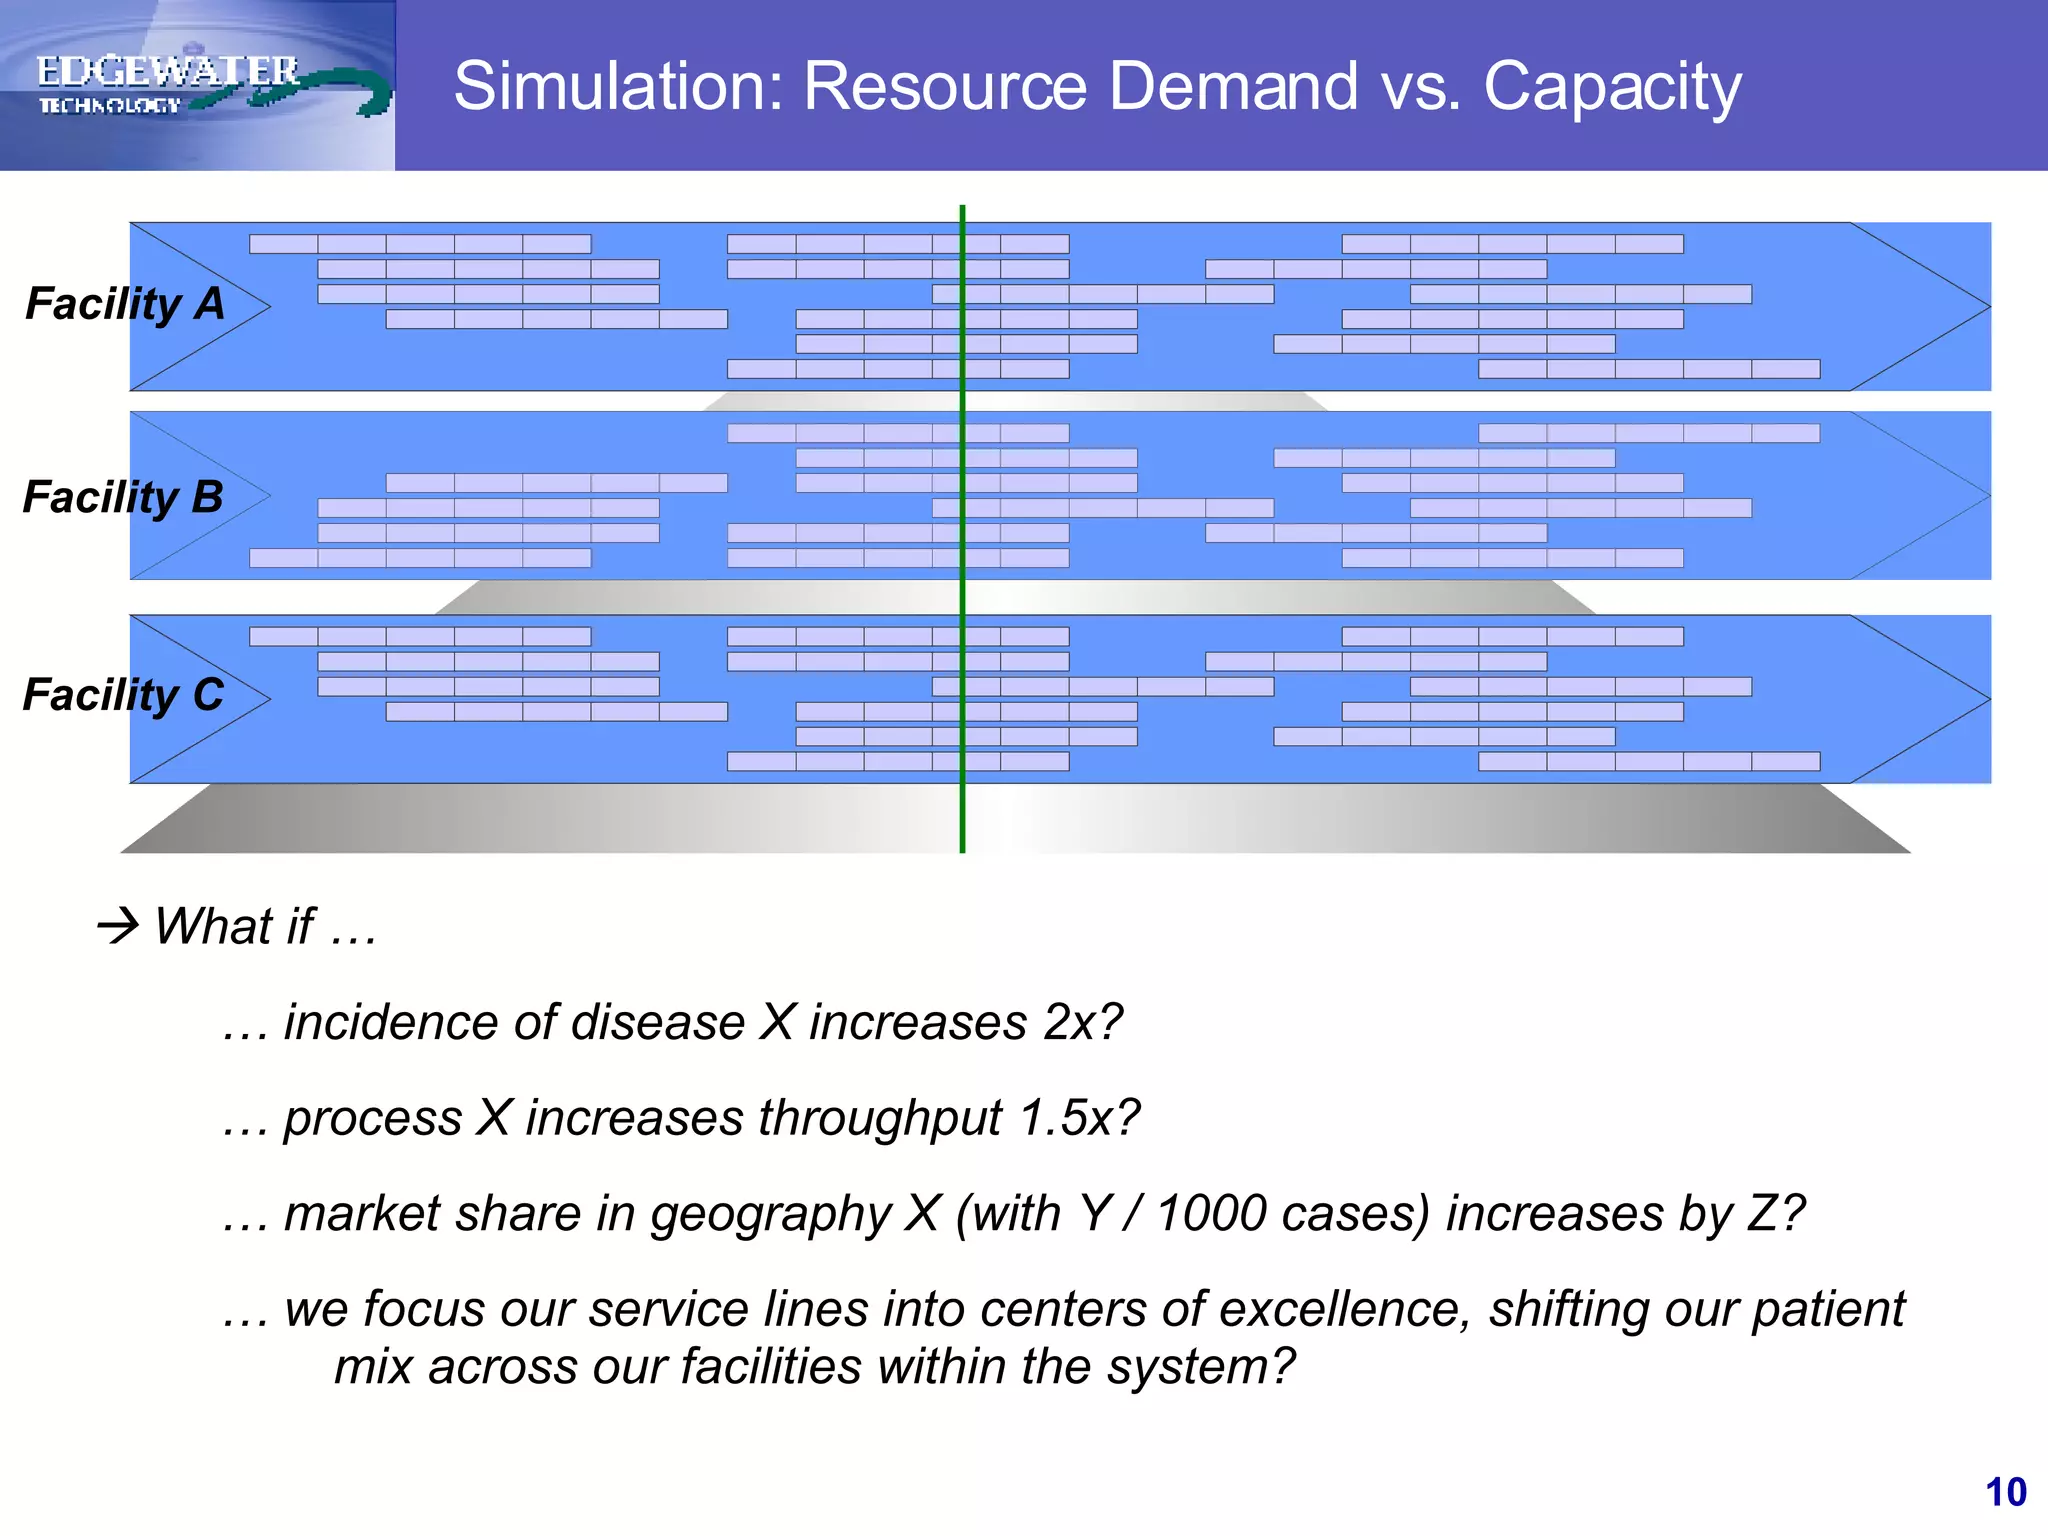
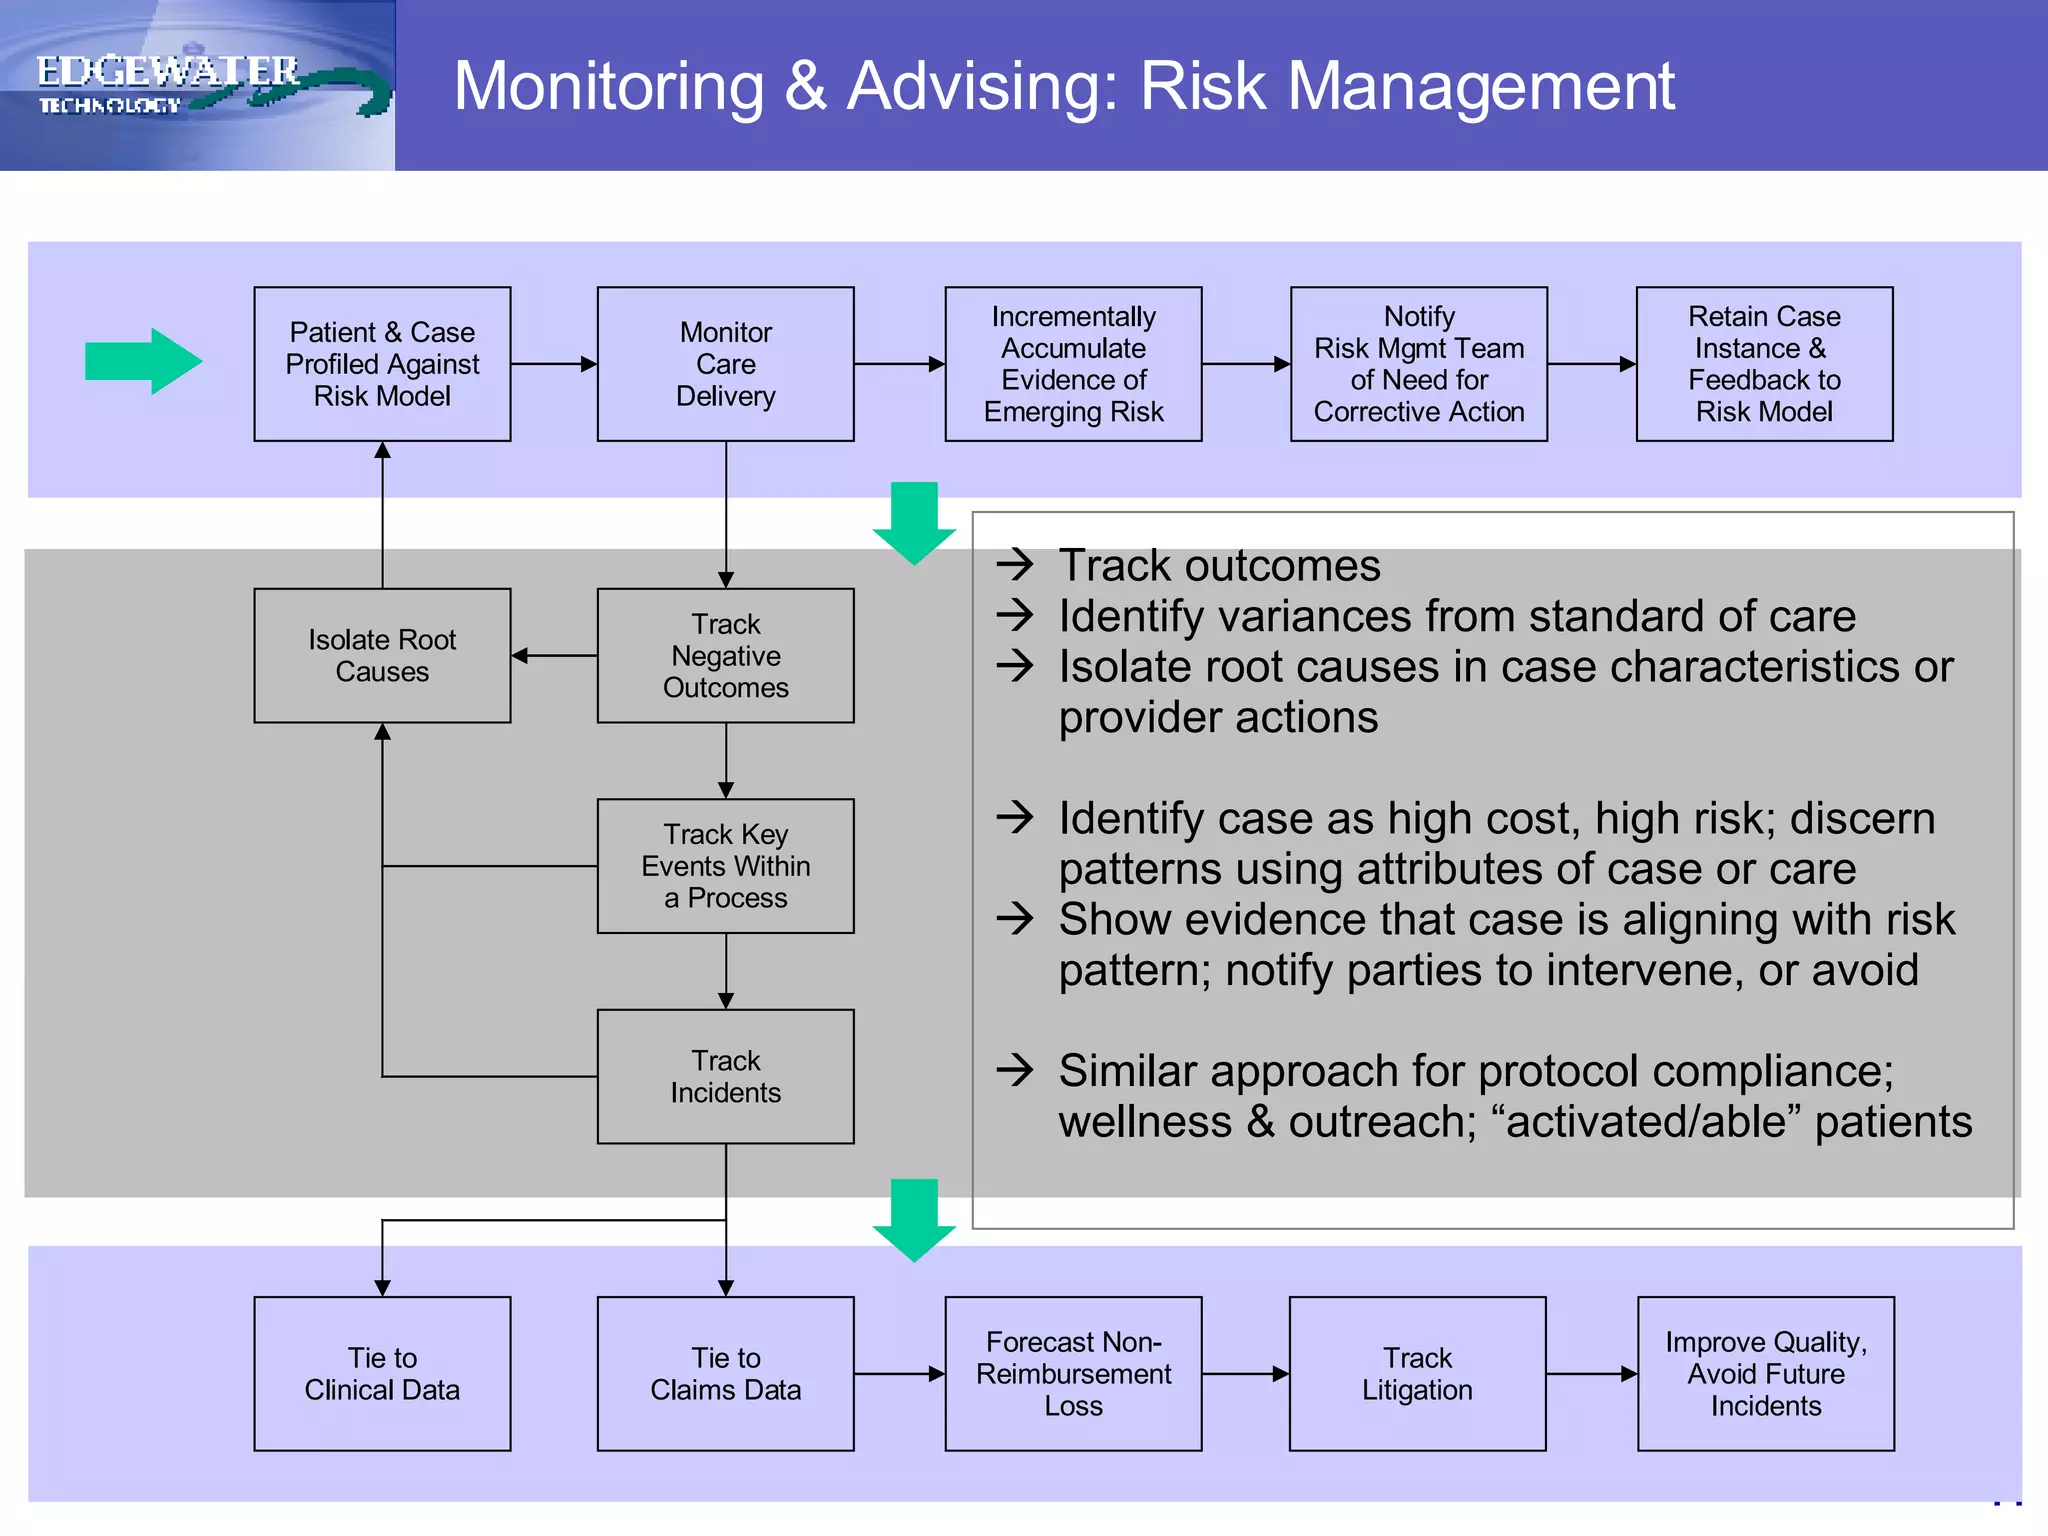
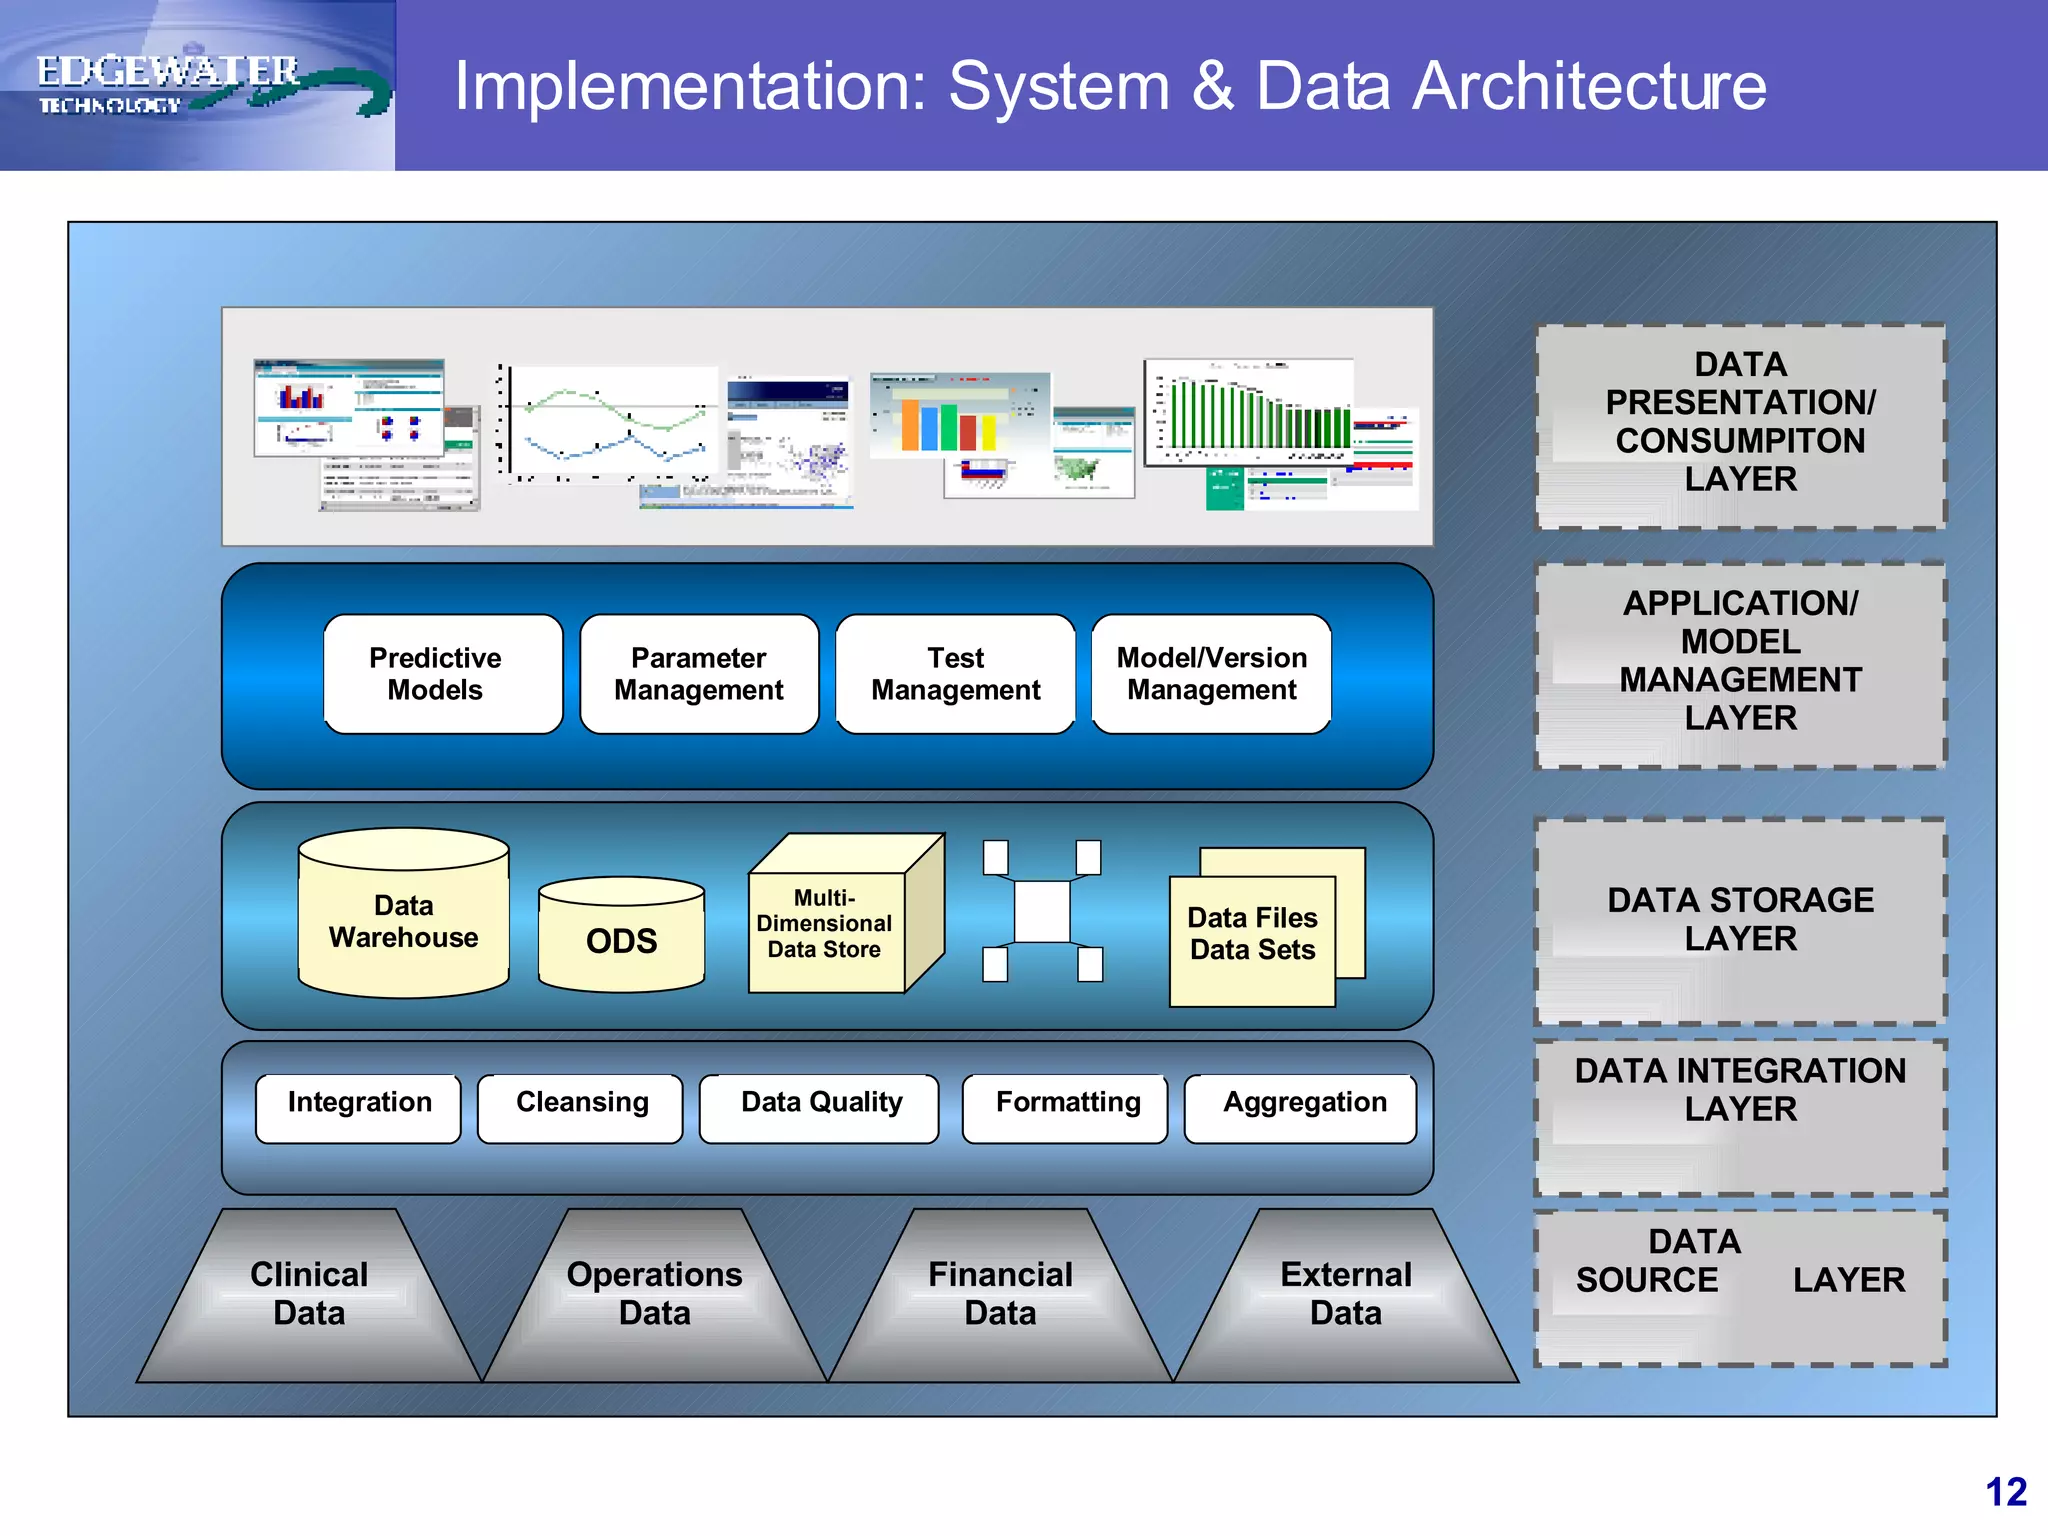


The document discusses the role of predictive analytics in healthcare, outlining various approaches such as clustering, forecasting, and decision trees to enhance the healthcare value chain. It explains how these methods support hospital operations and risk management by analyzing current and historical data to forecast future events and improve decision-making. Additionally, the document emphasizes the importance of system architecture and data integration in effectively implementing predictive analytics in healthcare settings.


