Downloaded 125 times


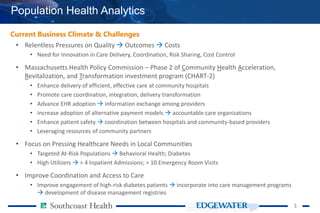
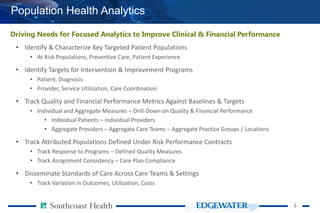
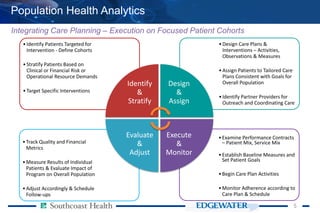
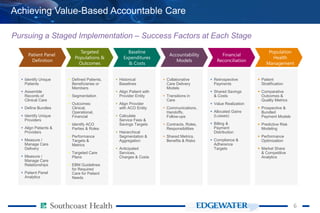
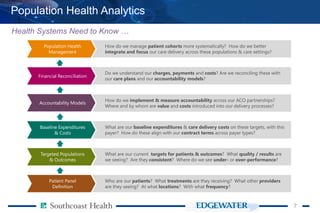
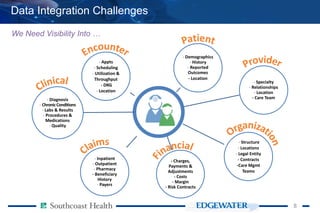

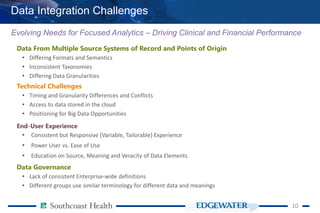
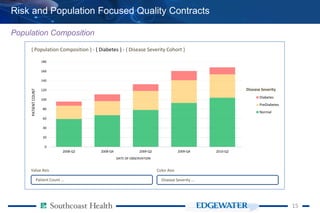
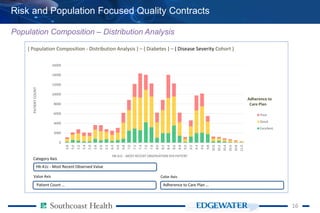
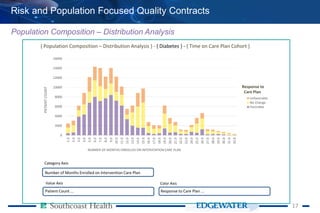
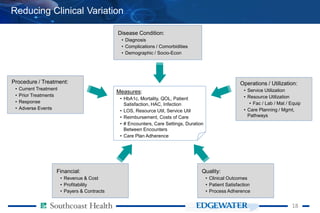
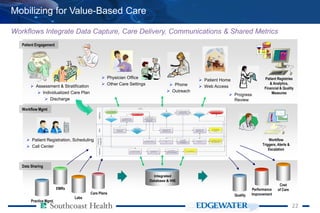
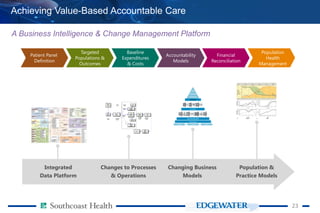
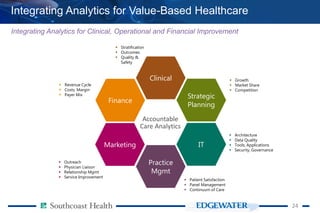


The document discusses the integration of analytics in value-based healthcare, emphasizing the importance of population health analytics to improve clinical and financial performance. It outlines challenges in data integration, the need for focused analytics, and strategies to mobilize healthcare delivery, while highlighting the role of accountable care organizations and alternative payment models. The content also addresses achieving better care coordination and patient engagement strategies for targeted populations, alongside identifying and stratifying patients for tailored care plans.


