Chapter 1: Basics
ofEconomics
Definitions, Nature, Scope, and Fundamental Concepts
2.
Economics is oneof the most
exciting disciplines in social
sciences. The word economy
comes from the Greek phrase
―one who manages a household .
‖
The science of economics in its
current form is about two hundred
years old
3.
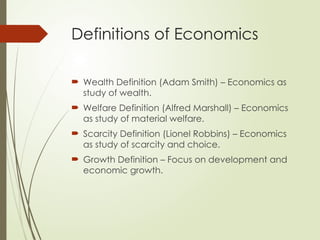
Definitions of Economics
Wealth Definition (Adam Smith) – Economics as
study of wealth.
Welfare Definition (Alfred Marshall) – Economics
as study of material welfare.
Scarcity Definition (Lionel Robbins) – Economics
as study of scarcity and choice.
Growth Definition – Focus on development and
economic growth.
4.
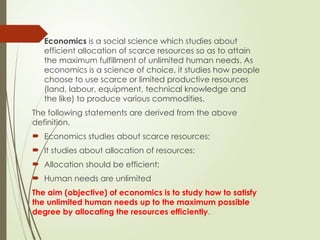
Economics isa social science which studies about
efficient allocation of scarce resources so as to attain
the maximum fulfillment of unlimited human needs. As
economics is a science of choice, it studies how people
choose to use scarce or limited productive resources
(land, labour, equipment, technical knowledge and
the like) to produce various commodities.
The following statements are derived from the above
definition.
Economics studies about scarce resources;
It studies about allocation of resources;
Allocation should be efficient;
Human needs are unlimited
The aim (objective) of economics is to study how to satisfy
the unlimited human needs up to the maximum possible
degree by allocating the resources efficiently.
5.
Nature of Economics
Economics is a social science.
Deals with human wants and scarce
resources.
Analyzes production, distribution, and
consumption.
Both positive (what is) and normative
(what ought to be).
6.
Economics can beanalyzed from two perspectives: positive
economics and normative economics.
Positive economics: it is concerned with analysis of facts and
attempts to describe the world as it is. It tries to answer the
questions what was; what is; or what will be? It does not judge
a system as good or bad, better or worse.
Example:
The current inflation rate in Uzbekistan is 12 percent.
Poverty and unemployment are the biggest problems in India.
The life expectancy at birth in Ethiopia is rising.
All the above statements are known as positive statements. These
statements are all concerned with real facts and information. Any
disagreement on positive statements can be checked by looking
into facts.
Is economics a positive science or normative science, or both? What is your
justification?
7.
Normative economics:It deals with the questions like, what
ought to be? Or what the economy should be? It evaluates
the desirability of alternative outcomes based on one‘s
value judgments about what is good or what is bad. In this
situation since normative economics is loaded with
judgments, what is good for one may not be the case for the
other. Normative analysis is a matter of opinion (subjective in
nature) which cannot be proved or rejected with reference
to facts.
Example:
The poor should pay no taxes.
There is a need for intervention of government in the
economy.
Females ought to be given job opportunities.
Any disagreement on a normative statement can be solved by
voting.
8.
Scope of Economics
Microeconomics is concerned with the economic
behavior of individual decision making units such as
households, firms, markets and industries. In other words,
it deals with how households and firms make decisions
and how they interact in specific markets.
Macroeconomics is a branch of economics that deals
with the effects and consequences of the aggregate
behavior of all decision making units in a certain
economy. In other words, it is an aggregative
economics that examines the interrelations among
various aggregates, their determination and the causes
of fluctuations in them. It looks at the economy as a
whole and discusses about the economy-wide
phenomena.
Applied branches – Development, International, Public,
etc.
9.
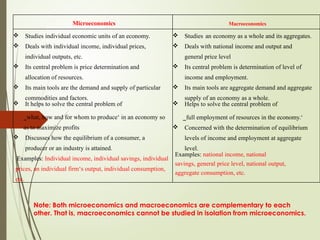
Note: Both microeconomicsand macroeconomics are complementary to each
other. That is, macroeconomics cannot be studied in isolation from microeconomics.
Microeconomics Macroeconomics
Studies individual economic units of an economy.
Deals with individual income, individual prices,
individual outputs, etc.
Its central problem is price determination and
allocation of resources.
Its main tools are the demand and supply of particular
commodities and factors.
It helps to solve the central problem of
‗what, how and for whom to produce‘ in an economy so
as to maximize profits
Discusses how the equilibrium of a consumer, a
producer or an industry is attained.
Examples: Individual income, individual savings, individual
prices, an individual firm‘s output, individual consumption,
etc.
Studies an economy as a whole and its aggregates.
Deals with national income and output and
general price level
Its central problem is determination of level of
income and employment.
Its main tools are aggregate demand and aggregate
supply of an economy as a whole.
Helps to solve the central problem of
‗full employment of resources in the economy.‘
Concerned with the determination of equilibrium
levels of income and employment at aggregate
level.
Examples: national income, national
savings, general price level, national output,
aggregate consumption, etc.
10.
Inductive and deductivereasoning in economics
The fundamental objective of economics, like any
science, is the establishment of valid
generalizations about certain aspects of human
behaviour. Those generalizations are known as
theories. A theory is a simplified picture of reality.
Economic theory provides the basis for economic
analysis which uses logical reasoning. There are
two methods of logical reasoning: inductive and
deductive.
11.
Inductive reasoningis a logical method of
reaching at a correct general statement or
theory based on several independent and
specific correct statements. In short, it is the
process of deriving a principle or theory by
moving from facts to theories and from
particular to general economic analysis.
Inductive method involves the following steps.
Selecting problem for analysis
Collection, classification, and analysis of
data
Establishing cause and effect relationship
between economic phenomena.
12.
Deductive reasoningis a logical way of arriving at a
particular or specific correct statement starting from a
correct general statement. In short, it deals with conclusions
about economic phenomenon from certain fundamental
assumptions or truths or axioms through a process of logical
arguments. The theory may agree or disagree with the real
world and we should check the validity of the theory to
facts by moving from general to particular.
Major steps in the deductive approach include:
Problem identification
Specification of the assumptions
Formulating hypotheses
Testing the validity of the hypotheses
13.
Scarcity, choice, opportunitycost and
production possibilities frontier
Have you ever faced a problem of
choice among different alternatives? If
yes, what was your decision?
What is scarcity? Do you think that it is
different from shortage? Why?
It is often said that the central purpose of economic activity is the
production of goods and services to satisfy consumer‘s needs and
wants i.e. to meet people‘s need for consumption both as a means
of survival and also to meet their ever-growing demand for an
improved lifestyle or standard of living.
14.
SCARCITY
The fundamentaleconomic problem that
any human society faces is the problem of
scarcity. Scarcity refers to the fact that all
economic resources that a society needs to
produce goods and services are finite or
limited in supply. But their being limited
should be expressed in relation to human
wants. Thus, the term scarcity reflects the
imbalance between our wants and the
means to satisfy those wants.
15.
Resources
Free resources:A resource is said to be
free if the amount available to a society
is greater than the amount people desire
at zero price. E.g. sunshine
Scarce (economic) resources: A resource
is said to be scarce or economic resource
when the amount available to a society is
less than what people want to have at
zero price.
16.
The following areexamples of scarce resources.
All types of human resources: manual,
intellectual, skilled and specialized
labor;
Most natural resources like land
(especially, fertile land), minerals,
clean water, forests and wild - animals;
All types of capital resources ( like
machines, intermediate goods,
infrastructure ); and
All types of entrepreneurial resources.
17.
Economic resources areusually classified into four
categories.
🖙 Labour: refers to the physical as well as mental efforts of human beings in
the production and distribution of goods and services. The reward for labour is
called wage.
🖙 Land: refers to the natural resources or all the free gifts of nature usable in
the production of goods and services. The reward for the services of land is
known as rent.
🖙 Capital: refers to all the manufactured inputs that can be used to produce
other goods and services. Example: equipment, machinery, transport and
communication facilities, etc. The reward for the services of capital is called
interest.
🖙 Entrepreneurship: refers to a special type of human talent that helps to
organize and
manage other factors of production to produce goods and services and takes
risk of making loses. The reward for entrepreneurship is called profit.
scaricity=Shotage?
18.
Note: Scarcitydoes not mean shortage. We have
already said that a good is said to be scarce if
the amount available is less than the amount
people wish to have at zero price. But we say that
there is shortage of goods and services when
people are unable to get the amount they want
at the prevailing or on going price. Shortage is a
specific and short term problem but scarcity is a
universal and everlasting problem.
19.
Choice
If resourcesare scarce, then output will be limited. If output is limited,
then we cannot satisfy all of our wants. Thus, choice must be made.
Due to the problem of scarcity, individuals, firms and government
are forced to choose as to what output to produce, in what
quantity, and what output not to produce. In short, scarcity implies
choice. Choice, in turn, implies cost. That means whenever choice is
made, an alternative opportunity is sacrificed. This cost is known as
opportunity cost.
Scarcity → limited resource → limited output → we might not satisfy all our wants
→choice involves costs → opportunity cost
20.
Opportunity cost
Ina world of scarcity, a decision to have more of one thing, at the
same time, means a decision to have less of another thing. The
value of the next best alternative that must be sacrificed is,
therefore, the opportunity cost of the decision.
Definition: Opportunity cost is the amount or value of the next best
alternative that must be sacrificed (forgone) in order to obtain one
more unit of a product.
For example, suppose the country spends all of its limited resources
on the production of cloth or computer. If a given amount of
resources can produce either one meter of cloth or 20 units of
computer, then the cost of one meter of cloth is the 20 units of
computer that must be sacrificed in order to produce a meter of
cloth.
When we say opportunity cost, we mean that:
It is measured in goods & services but not in money costs
It should be in line with the principle of substitution.
In conclusion, when opportunity cost of an activity increases
people substitute other activities in its place.
21.
The Production PossibilitiesFrontier or Curve (PPF/ PPC)
The production possibilities frontier (PPF) is a curve that shows
the various possible combinations of goods and services that
the society can produce given its resources and technology. To
draw the PPF we need the following assumptions.
The quantity as well as quality of economic resource
available for use during the year is fixed.
There are two broad classes of output to be produced over
the year.
The economy is operating at full employment and is
achieving full production (efficiency).
Technology does not change during the year.
Some inputs are better adapted to the production of one
good than to the production of the other (specialization).
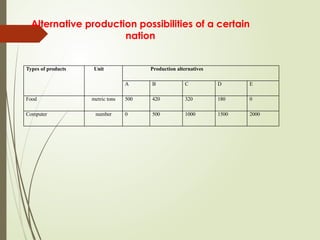
22.
Alternative production possibilitiesof a certain
nation
Types of products Unit Production alternatives
A B C D E
Food metric tons 500 420 320 180 0
Computer number 0 500 1000 1500 2000
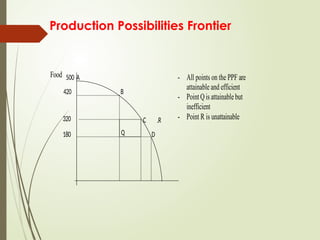
23.
Production Possibilities Frontier
Food500 A
420
320
180
B
C .R
D
- All points on the PPF are
attainable and efficient
- PointQisattainablebut
inefficient
- Point R is unattainable
Q
24.
The PPF describesthree important concepts:
The concepts of scarcity: - the society cannot have unlimited
amount of outputs even if it employs all of its resources and
utilizes them in the best possible way.
The concept of choice: - any movement along the curve
indicates the change in choice.
The concept of opportunity cost: - when the economy
produces on the PPF, production of more of one good
requires sacrificing some of another product which is reflected
by the downward sloping PPF. Related to the opportunity cost
we have a law known as the law of increasing opportunity
cost. This law states that as we produce more and more of a
product, the opportunity cost per unit of the additional output
increases. This makes the shape of the PPF concave to the
origin.
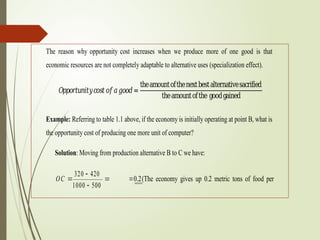
25.
The reason whyopportunity cost increases when we produce more of one good is that
economic resources are not completely adaptable to alternative uses (specialization effect).
𝑂𝑝𝑝𝑜𝑟𝑡𝑢𝑛𝑖𝑡𝑦𝑐𝑜𝑠𝑡𝑜𝑓𝑎𝑔𝑜𝑜𝑑=
theamountofthenextbestalternativesacrified
theamountofthe goodgained
Example: Referring to table 1.1 above, if the economy is initially operating at point B, what is
the opportunity cost of producing one more unit of computer?
Solution: Moving from production alternative B to C we have:
OC
320 420
1000 500
0.2(The economy gives up 0.2 metric tons of food per
26.
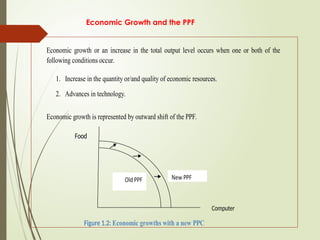
Economic Growth andthe PPF
Economic growth or an increase in the total output level occurs when one or both of the
following conditions occur.
1. Increase in the quantity or/and quality of economic resources.
2. Advances in technology.
Economic growth is represented by outward shift of the PPF.
Food
Computer
Figure 1.2: Economic growths with a new PPC
27.
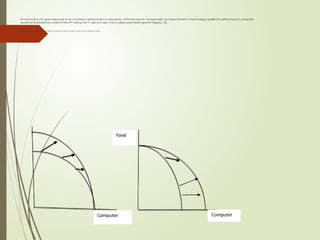
An economy cangrow because of an increase in productivity in one sector of the economy. For example, an improvement in technology applied to either food or computer
would be illustrated by a shift of the PPF along the Y- axis or X-axis. This is called asymmetric growth (figure 1.3).
Figure 1.3: improvements in technology and quantity and/or quality of resources on national output
28.
Basic economic questions
Economic problems faced by an
economic system due to scarcity of
resources are known as basic economic
problems. These problems are common
to all economic systems. They are also
known as central problems of an
economy. Therefore, any human society
should answer the following three basic
questions.
29.
What to Produce?
This problem is also known as the problem of allocation of
resources. It implies that every economy must decide
which goods and in what quantities are to be produced.
The economy must make choices such as consumption
goods versus capital goods, civil goods versus military
goods, and necessity goods versus luxury goods. As
economic resources are limited we must reduce the
production of one type of good if we want more of
another type. Generally, the final choice of any economy
is a combination of the various types of goods but the
exact nature of the combination depends upon the
specific circumstances and objectives of the economy.
30.
How to Produce?
This problem is also known as the problem of choice of
technique. Once an economy has reached a decision
regarding the types of goods to be produced, and has
determined their respective quantities, the economy must
decide how to produce them - choosing between
alternative methods or techniques of production.
For example, cotton cloth can be produced with hand
looms, power looms, or automatic looms. Similarly, wheat
can be grown with primitive tools and manual labour, or
with modern machinery and little labour.
31.
The various techniquesof production can be classified into
two groups:
A labour-intensive techniques and capital-intensive
techniques. A labour-intensive technique involves the
use of more labour relative to capital, per unit of
output.
A capital-intensive technique involves the use of more
capital relative to labour, per unit of output. The choice
between different techniques depends on the
available supplies of different factors of production and
their relative prices.
Making good choices is essential for making the best
possible use of limited resources to produce maximum
amounts of goods and services.
32.
For Whom toProduce?
This problem is also known as the problem of distribution of national
product. It relates to how a material product is to be distributed
among the members of a society. The economy must decide, for
example, whether to produce for the benefit of the few rich people
or for the large number of poor people. An economy that wants to
benefit the maximum number of persons would first try to produce
the necessities of the whole population and then to proceed to the
production of luxury goods.
All these and other fundamental economic problems center
around human needs and wants. Many human efforts in society are
directed towards the production of goods and services to satisfy
human needs and wants. These human efforts result in economic
activities that occur within the framework of an economic system.
33.
Economic systems
Theway a society tries to answer the above
fundamental questions is summarized by a
concept known as economic system. An
economic system is a set of organizational
and institutional arrangements established
to answer the basic economic questions.
Customarily, we can identify three types of
economic system. These are capitalism,
command and mixed economy
34.
Capitalist economy
Capitalismis the oldest formal economic system in
the world. It became widespread in the middle of
the 19th
century. In this economic system, all means
of production are privately owned, and production
takes place at the initiative of individual private
entrepreneurs who work mainly for private profit.
Government intervention in the economy is minimal.
This system is also called free market economy or
market system or laissez faire.
35.
Features of CapitalisticEconomy
The right to private property: The right to private property is a
fundamental feature of a capitalist economy. As part of that
principle, economic or productive factors such as land, factories,
machinery, mines etc. are under private ownership.
Freedom of choice by consumers: Consumers can buy the goods
and services that suit their tastes and preferences. Producers
produce goods in accordance with the wishes of the consumers.
This is known as the principle of consumer sovereignty.
Profit motive: Entrepreneurs, in their productive activity, are guided
by the motive of profit-making.
Competition: In a capitalist economy, competition exists among
sellers or producers of similar goods to attract customers. Among
buyers, there is competition to obtain goods. Among workers, the
competition is to get jobs. Among employers, it is to get workers
and investment funds.
36.
Features of CapitalisticEconomy
Price mechanism: All basic economic problems are solved
through the price mechanism.
Minor role of government: The government does not interfere in
day-to-day economic activities and confines itself to defense
and maintenance of law and order.
Self-interest: Each individual is guided by self-interest and
motivated by the desire for economic gain.
Inequalities of income: There is a wide economic gap between
the rich and the poor.
Existence of negative externalities: A negative externality is the
harm, cost, or inconvenience suffered by a third party because
of actions by others. In capitalistic economy, decision of firms
may result in negative externalities against another firm or
society in general.
37.
Advantages of CapitalisticEconomy
Flexibility or adaptability: It successfully adapts itself to changing
environments.
Decentralization of economic power: Market mechanisms work as a
decentralizing force against the concentration of economic power.
Increase in per-capita income and standard of living: Rapid growth in
levels of production and income leads to higher per-capita income
and standards of living.
New types of consumer goods: Varieties of new consumer goods are
developed and produced at large scale.
Growth of entrepreneurship: Profit motive creates and supports new
entrepreneurial skills and approaches.
Optimum utilization of productive resources: Full utilization of productive
resources is possible due to innovations and technological progress.
High rate of capital formation: The right to private property helps in
capital formation.
38.
Disadvantages of CapitalisticEconomy
Inequality of income: Capitalism promotes economic
inequalities and creates social imbalance.
Unbalanced economic activity: As there is no check on
the economic system, the economy can develop in an
unbalanced way in terms of different geographic regions
and different sections of society.
Exploitation of labour: In a capitalistic economy,
exploitation of labour (for example by paying low wages)
is common.
Negative externalities: are problems in capitalistic
economy where profit maximization is the main objective
of firms. If economic makes sense for a firm to force others
to pay the impacts of negative externalities such as
pollution.
39.
Command economy
Command economyis also known as
socialistic economy. Under this economic
system, the economic institutions that are
engaged in production and distribution are
owned and controlled by the state. In the
recent past, socialism has lost its popularity
and most of the socialist countries are trying
free market economies.
40.
Main Features ofCommand Economy
Collective ownership: All means of production are owned by
the society as a whole, and there is no right to private
property.
Central economic planning: Planning for resource allocation is
performed by the controlling authority according to given
socio-economic goals.
Strong government role: Government has complete control
over all economic activities.
Maximum social welfare: Command economy aims at
maximizing social welfare and does not allow the exploitation
of labour.
Relative equality of incomes: Private property does not exist in
a command economy, the profit motive is absent, and there
are no opportunities for accumulation of wealth. All these
factors lead to greater equality in income distribution, in
comparison with capitalism.
41.
Advantages of CommandEconomy
Absence of wasteful competition: There is no place for
wasteful use of productive resources through unhealthy
competition.
Balanced economic growth: Allocation of resources through
centralized planning leads to balanced economic
development. Different regions and different sectors of the
economy can develop equally.
Elimination of private monopolies and inequalities:
Command economies avoid the major evils of capitalism
such as inequality of income and wealth, private
monopolies, and concentration of economic, political and
social power.
42.
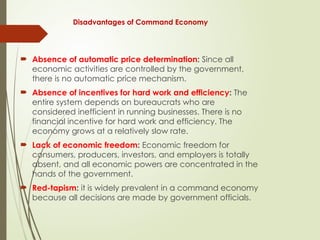
Disadvantages of CommandEconomy
Absence of automatic price determination: Since all
economic activities are controlled by the government,
there is no automatic price mechanism.
Absence of incentives for hard work and efficiency: The
entire system depends on bureaucrats who are
considered inefficient in running businesses. There is no
financial incentive for hard work and efficiency. The
economy grows at a relatively slow rate.
Lack of economic freedom: Economic freedom for
consumers, producers, investors, and employers is totally
absent, and all economic powers are concentrated in the
hands of the government.
Red-tapism: it is widely prevalent in a command economy
because all decisions are made by government officials.
43.
Mixed economy
A mixedeconomy is an attempt to
combine the advantages of both the
capitalistic economy and the
command economy. It incorporates
some of the features of both and
allows private and public sectors to
co-exist.
44.
Main Features ofMixed Economy
Co-existence of public and private sectors: Public
and private sectors co-exist in this system. Their
respective roles and aims are well-defined. Industries
of national and strategic importance, such as heavy
and basic industry, defense production, power
generation, etc. are set up in the public sector,
whereas consumer-goods industry and small-scale
industry are developed through the private sector.
Economic welfare: Economic welfare is the most
important criterion of the success of a mixed
economy. The public sector tries to remove regional
imbalances, provides large employment
opportunities and seeks economic welfare through
its price policy. Government control over the private
sector leads to economic welfare of society at large.
45.
Main Features ofMixed Economy
Economic planning: The government uses instruments of
economic planning to achieve co-ordinated rapid
economic development, making use of both the
private and the public sector.
Price mechanism: The price mechanism operates for
goods produced in the private sector, but not for
essential commodities and goods produced in the
public sector. Those prices are defined and regulated
by the government.
Economic equality: Private property is allowed, but rules
exist to prevent concentration of wealth. Limits are fixed
for owning land and property. Progressive taxation,
concessions and subsides are implemented to achieve
economic equality.
46.
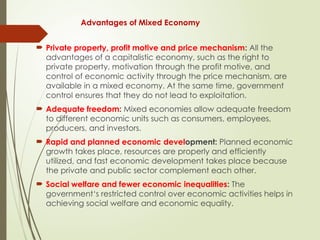
Advantages of MixedEconomy
Private property, profit motive and price mechanism: All the
advantages of a capitalistic economy, such as the right to
private property, motivation through the profit motive, and
control of economic activity through the price mechanism, are
available in a mixed economy. At the same time, government
control ensures that they do not lead to exploitation.
Adequate freedom: Mixed economies allow adequate freedom
to different economic units such as consumers, employees,
producers, and investors.
Rapid and planned economic development: Planned economic
growth takes place, resources are properly and efficiently
utilized, and fast economic development takes place because
the private and public sector complement each other.
Social welfare and fewer economic inequalities: The
government‘s restricted control over economic activities helps in
achieving social welfare and economic equality.
47.
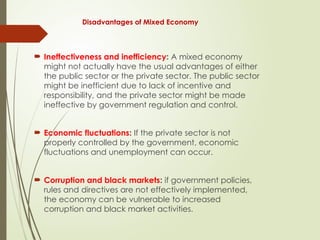
Disadvantages of MixedEconomy
Ineffectiveness and inefficiency: A mixed economy
might not actually have the usual advantages of either
the public sector or the private sector. The public sector
might be inefficient due to lack of incentive and
responsibility, and the private sector might be made
ineffective by government regulation and control.
Economic fluctuations: If the private sector is not
properly controlled by the government, economic
fluctuations and unemployment can occur.
Corruption and black markets: if government policies,
rules and directives are not effectively implemented,
the economy can be vulnerable to increased
corruption and black market activities.
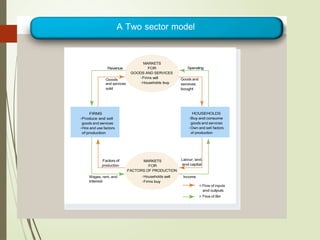
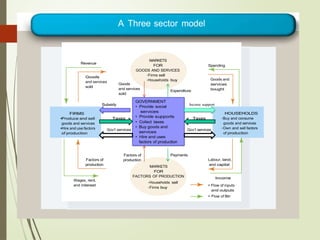
48.
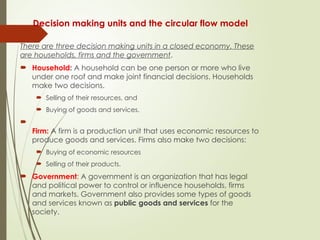
Decision making unitsand the circular flow model
There are three decision making units in a closed economy. These
are households, firms and the government.
Household: A household can be one person or more who live
under one roof and make joint financial decisions. Households
make two decisions.
Selling of their resources, and
Buying of goods and services.
Firm: A firm is a production unit that uses economic resources to
produce goods and services. Firms also make two decisions:
Buying of economic resources
Selling of their products.
Government: A government is an organization that has legal
and political power to control or influence households, firms
and markets. Government also provides some types of goods
and services known as public goods and services for the
society.
49.
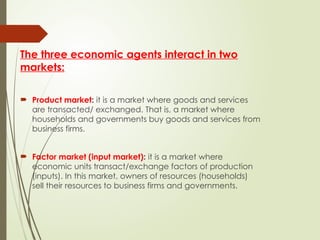
The three economicagents interact in two
markets:
Product market: it is a market where goods and services
are transacted/ exchanged. That is, a market where
households and governments buy goods and services from
business firms.
Factor market (input market): it is a market where
economic units transact/exchange factors of production
(inputs). In this market, owners of resources (households)
sell their resources to business firms and governments.
52.
Summary
Economics isa social science which studies about efficient
allocation of scarce resources so as to attain the maximum
fulfillment of unlimited human needs. Economics has two main
ranches: Microeconomics (deals with the economic behavior of
individual economic units and individual economic variables) and
Macroeconomics (deals with the functions of the economy as a
whole).
Resources can be categorized as free resources (that are free gifts
of nature, are unlimited in supply) and economic resources (that
are scarce such as land, labor, capital and entrepreneurship).
Production Possibility Curve (PPC) is a curve that depicts all possible
combinations of the maximum output that can be produced in an
economy with given resources and technology.
Economic system is a legal and institutional framework within which
various economic activities take place. In economics there are
three basic alternative economic systems such as Capitalistic
economy, Command economy and Mixed economy. In a closed
economy, the major decision-making units are households, firms,
and the government.
53.
Review questions
1) Defineeconomics from perspective of Wealth, Welfare, Scarcity, and Growth.
Which definition more suits for economics? Why?
2) Why we study economics? Have you gained anything from this chapter?
Would you discuss them please?
3) Define scarcity, choice and opportunity cost. Can you link them in your day to
day lives?
4) What do you understand by positive economics and normative economics?
5) Explain why economics deals with allocation and efficient utilization of scarce
resources only?
6) In recent years, especially around big cities, there is the problem of air
pollution and the likelihood of poisoning is high. Given this scenario, do you
think that air is free resource? Justify your answer.
7) Describe the four categories of economic resources. Which category of
resources you and your family owned?
8) What is a production possibility curve?
9) Discuss the economic system in Ethiopia over the recent three regimes (EPRDF,
Derg and imperial regime)
10) What are the central problems of an economy? Discuss them in detail.
54.
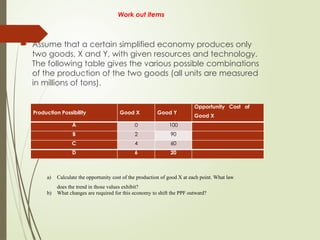
Work out items
Assume that a certain simplified economy produces only
two goods, X and Y, with given resources and technology.
The following table gives the various possible combinations
of the production of the two goods (all units are measured
in millions of tons).
Production Possibility Good X Good Y
Opportunity Cost of
Good X
A 0 100
B 2 90
C 4 60
D 6 20
a) Calculate the opportunity cost of the production of good X at each point. What law
does the trend in those values exhibit?
b) What changes are required for this economy to shift the PPF outward?
55.
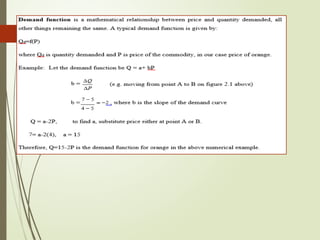
Theory of Demandand Supply
Demand is one of the forces determining prices. The theory of demand is related to the economic activities of
consumers-consumption. Hence, the purpose of the theory of demand is to determine the various factors that affect
demand.
In our day-to-day life we use the word ‗demand‘ in a loose sense to mean a desire of a person to purchase a
commodity or service. But in economics it has a specific meaning, which is different from what we use it in our
day to day activities.
demand refers to various quantities of a commodity or service that a consumer would purchase at a given time in
a market at various prices, given other things unchanged (ceteris paribus). The quantity demanded of a particular
commodity depends on the price of that commodity.
Law of demand: This is the principle of demand, which states that , price of a commodity and its quantity demanded
are inversely related i.e., as price of a commodity increases (decreases) quantity demanded for that commodity
decreases (increases), ceteris paribus.
56.
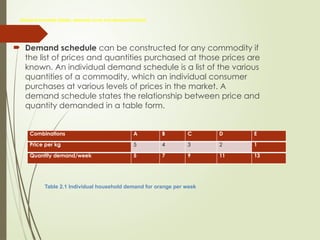
Demand schedule (table),demand curve and demand function
Demand schedule can be constructed for any commodity if
the list of prices and quantities purchased at those prices are
known. An individual demand schedule is a list of the various
quantities of a commodity, which an individual consumer
purchases at various levels of prices in the market. A
demand schedule states the relationship between price and
quantity demanded in a table form.
Combinations A B C D E
Price per kg 5 4 3 2 1
Quantity demand/week 5 7 9 11 13
Table 2.1 Individual household demand for orange per week
57.
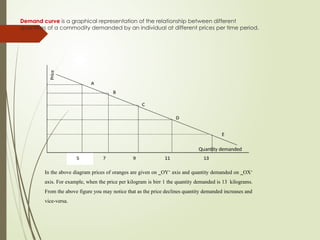
Demand curve isa graphical representation of the relationship between different
quantities of a commodity demanded by an individual at different prices per time period.
Price
Quantity demanded
In the above diagram prices of oranges are given on ‗OY‘ axis and quantity demanded on ‗OX‘
axis. For example, when the price per kilogram is birr 1 the quantity demanded is 13 kilograms.
From the above figure you may notice that as the price declines quantity demanded increases and
vice-versa.
59.
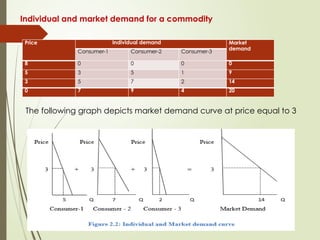
Individual and marketdemand for a commodity
Price Individual demand Market
demand
Consumer-1 Consumer-2 Consumer-3
8 0 0 0 0
5 3 5 1 9
3 5 7 2 14
0 7 9 4 20
The following graph depicts market demand curve at price equal to 3
60.
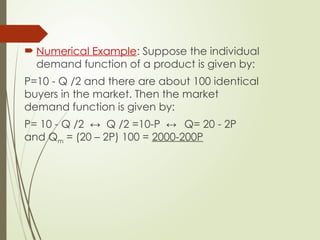
Numerical Example:Suppose the individual
demand function of a product is given by:
P=10 - Q /2 and there are about 100 identical
buyers in the market. Then the market
demand function is given by:
P= 10 - Q /2 ↔ Q /2 =10-P ↔ Q= 20 - 2P
and Qm = (20 – 2P) 100 = 2000-200P
61.
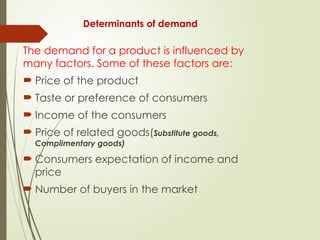
Determinants of demand
Thedemand for a product is influenced by
many factors. Some of these factors are:
Price of the product
Taste or preference of consumers
Income of the consumers
Price of related goods(Substitute goods,
Complimentary goods)
Consumers expectation of income and
price
Number of buyers in the market
62.
Changes in demand:a change in any determinant of demand—except for the good‘s price- causes the demand curve to shift. We call this a change in demand. If buyers choose to purchase
more at any price, the demand curve shifts rightward—an increase in demand. If buyers choose to purchase less at any price, the demand curve shifts leftward—a decrease in demand.
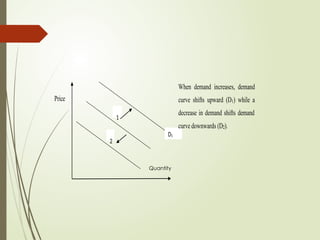
63.
Price
1
2
When demand increases,demand
curve shifts upward (D1) while a
decrease in demand shifts demand
curve downwards (D2).
D1
Quantity
64.
Elasticity of demand
Ineconomics, the concept of elasticity is very crucial and is used to
analyze the quantitative relationship between price and quantity
purchased or sold. Elasticity is a measure of responsiveness of a
dependent variable to changes in an independent variable. Accordingly,
we have the concepts of elasticity of demand and elasticity of supply.
Elasticity of demand refers to the degree of responsiveness of quantity
demanded of a good to a change in its price, or change in income, or
change in prices of related goods. Commonly, there are three kinds of
demand elasticity: price elasticity, income elasticity, and cross elasticity.
65.
Price Elasticity ofDemand
Price elasticity of demand means degree of responsiveness of
demand to change in price. It indicates how consumers react
to changes in price. The greater the reaction the greater will be
the elasticity, and the lesser the reaction, the smaller will be the
elasticity. Price elasticity of demand is a measure of how much
the quantity demanded of a good responds to a change in
the price of that good, computed as the percentage change
in quantity demanded divided by the percentage change in
price.
Demand for commodities like clothes, fruit etc. changes when
there is even a small change in their price, whereas demand
for commodities which are basic necessities of life, like salt,
food grains etc., may not change even if price changes, or it
may change, but not in proportion to the change in price.
Price elasticity demand can be measured in two ways. These
are point and arc elasticity
66.
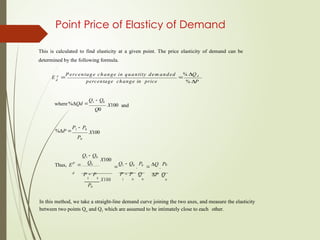
Point Price ofElasticy of Demand
This is calculated to find elasticity at a given point. The price elasticity of demand can be
determined by the following formula.
E p
P ercentage change in quantity dem anded
% Q d
d
percentage change in price % P
where%Qd
Q1 Q0
Q0
X100 and
%P
P1 P0
P0
X100
Thus, EP
Q1 Q0
Q0
X100
Q1 Q0
.
P0
Q
.
P0
d
P P P P Q P Q
1 0
X100
P0
1 0 0 0
In this method, we take a straight-line demand curve joining the two axes, and measure the elasticity
between two points Qo and Q1 which are assumed to be intimately close to each other.
67.
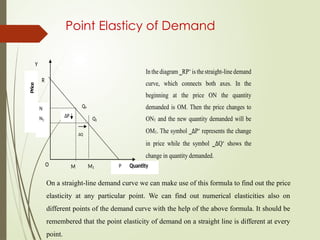
Point Elasticy ofDemand
1
N
Y
R
N Qo
N1
∆P
Q1
∆Q
O M M1
In the diagram ‗RP‘is thestraight-line demand
curve, which connects both axes. In the
beginning at the price ON the quantity
demanded is OM. Then the price changes to
ON1 and the new quantity demanded will be
OM1. The symbol ‗∆P‘ represents the change
in price while the symbol ‗∆Q‘ shows the
change in quantity demanded.
P Quantity
Price
On a straight-line demand curve we can make use of this formula to find out the price
elasticity at any particular point. We can find out numerical elasticities also on
different points of the demand curve with the help of the above formula. It should be
remembered that the point elasticity of demand on a straight line is different at every
point.
68.
Arc price elasticityof demand
The main drawback of the point elasticity method is that it
is applicable only when we have information about even
the slight changes in the price and the quantity
demanded of the commodity. But in practice, we do not
acquire such information about minute changes. We may
possess demand schedules in which there are big gaps in
price as well as the quantity demanded. In such cases,
there is an alternative method known as arc method of
elasticity measurement.
In arc price elasticity of demand, the midpoints of the old
and the new values of both price and quantity demanded
are used. It measures a portion or a segment of the
demand curve between the two points. An arc is a portion
of a curve line, hence, a portion or segment of a demand
curve.
69.
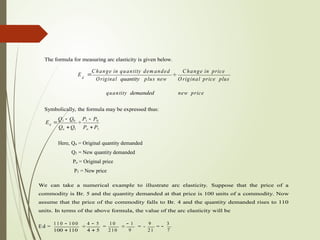
The formula formeasuring arc elasticity is given below.
E
Change in quantity dem anded
C hange in price
d
Original quantity plus new O riginal price plus
quantity demanded new price
Symbolically, the formula may be expressed thus:
E
Q1 Q0
P1 P0
Qo Q1 Po P1
d
Here, Qo = Original quantity demanded
Q1 = New quantity demanded
Po = Original price
P1 = New price
We can take a numerical example to illustrate arc elasticity. Suppose that the price of a
commodity is Br. 5 and the quantity demanded at that price is 100 units of a commodity. Now
assume that the price of the commodity falls to Br. 4 and the quantity demanded rises to 110
units. In terms of the above formula, the value of the arc elasticity will be
E
E d
d =
=
11 0 1 0 0
4 5
=
=
1 0
1
=
= -
-
9
=
=
3
100 110 4 5 210 9 21 7
70.
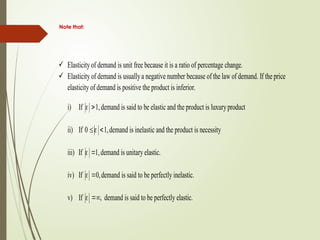
Note that:
Elasticityof demand is unit free because it is a ratio of percentage change.
Elasticityof demand is usuallya negative number because of the law of demand. If the price
elasticity of demand is positive the product is inferior.
i) If 1,demand is said to be elastic and the product is luxuryproduct
ii) If 0 1,demand is inelastic and the product is necessity
iii) If 1,demand is unitary elastic.
iv) If 0,demand is said to be perfectly inelastic.
v) If , demand is said to be perfectly elastic.
71.
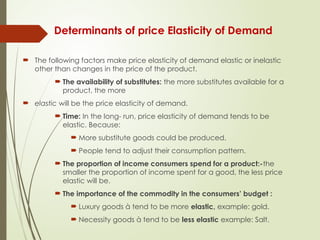
Determinants of priceElasticity of Demand
The following factors make price elasticity of demand elastic or inelastic
other than changes in the price of the product.
The availability of substitutes: the more substitutes available for a
product, the more
elastic will be the price elasticity of demand.
Time: In the long- run, price elasticity of demand tends to be
elastic. Because:
More substitute goods could be produced.
People tend to adjust their consumption pattern.
The proportion of income consumers spend for a product:-the
smaller the proportion of income spent for a good, the less price
elastic will be.
The importance of the commodity in the consumers’ budget :
Luxury goods à tend to be more elastic, example: gold.
Necessity goods à tend to be less elastic example: Salt.
72.
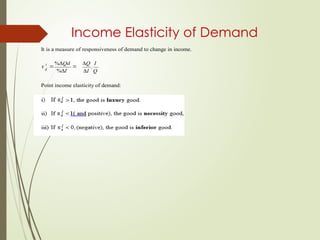
Income Elasticity ofDemand
It is a measure of responsiveness of demand to change in income.
I
%Qd
Q
.
I
d
%I I Q
Point income elasticity of demand:
73.
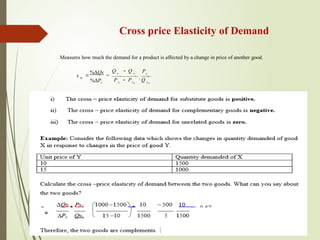
Cross price Elasticityof Demand
x
y
x
y x
y
Measures how much the demand for a product is affected by a change in price of another good.
xy
%Qx
=
%Py
Q Q P
1 o
. 0
P P Q
1 0 0
74.
Theory of supply
Supply indicates various quantities of a product
that sellers (producers) are willing and able to
provide at different prices in a given period of
time, other things remaining unchanged.
The law of supply: states that, ceteris paribus, as
price of a product increase, quantity supplied of
the product increases, and as price decreases,
quantity supplied decreases. It tells us there is a
positive relationship between price and quantity
supplied.
75.
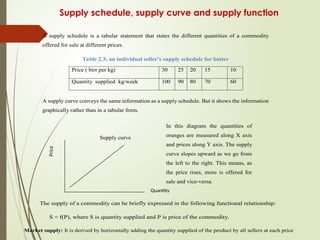
Supply schedule, supplycurve and supply function
A supply schedule is a tabular statement that states the different quantities of a commodity
offered for sale at different prices.
Table 2.3: an individual seller’s supply schedule for butter
Price ( birr per kg) 30 25 20 15 10
Quantity supplied kg/week 100 90 80 70 60
A supply curve conveys the same information as a supply schedule. But it shows the information
graphically rather than in a tabular form.
Supply curve
In this diagram the quantities of
oranges are measured along X axis
and prices along Y axis. The supply
curve slopes upward as we go from
the left to the right. This means, as
the price rises, more is offered for
sale and vice-versa.
Quantity
Price
The supply of a commodity can be briefly expressed in the following functional relationship:
S = f(P), where S is quantity supplied and P is price of the commodity.
Market supply: It is derived by horizontally adding the quantity supplied of the product by all sellers at each price
76.
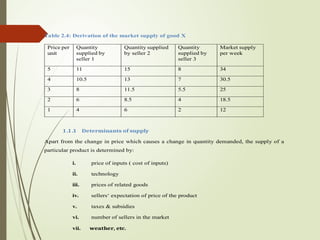
Table 2.4: Derivationof the market supply of good X
Price per
unit
Quantity
supplied by
seller 1
Quantity supplied
by seller 2
Quantity
supplied by
seller 3
Market supply
per week
5 11 15 8 34
4 10.5 13 7 30.5
3 8 11.5 5.5 25
2 6 8.5 4 18.5
1 4 6 2 12
1 .1 .1 Determinants of supply
Apart from the change in price which causes a change in quantity demanded, the supply of a
particular product is determined by:
i. price of inputs ( cost of inputs)
ii. technology
iii. prices of related goods
iv. sellers‘ expectation of price of the product
v. taxes & subsidies
vi. number of sellers in the market
vii. weather, etc.
77.
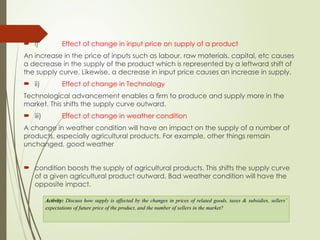
i) Effectof change in input price on supply of a product
An increase in the price of inputs such as labour, raw materials, capital, etc causes
a decrease in the supply of the product which is represented by a leftward shift of
the supply curve. Likewise, a decrease in input price causes an increase in supply.
ii) Effect of change in Technology
Technological advancement enables a firm to produce and supply more in the
market. This shifts the supply curve outward.
iii) Effect of change in weather condition
A change in weather condition will have an impact on the supply of a number of
products, especially agricultural products. For example, other things remain
unchanged, good weather
condition boosts the supply of agricultural products. This shifts the supply curve
of a given agricultural product outward. Bad weather condition will have the
opposite impact.
Activity: Discuss how supply is affected by the changes in prices of related goods, taxes & subsidies, sellers’
expectations of future price of the product, and the number of sellers in the market?
78.
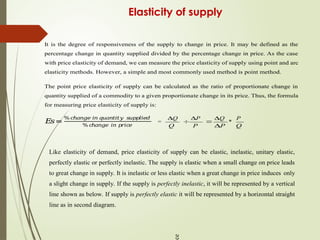
Elasticity of supply
Itis the degree of responsiveness of the supply to change in price. It may be defined as the
percentage change in quantity supplied divided by the percentage change in price. As the case
with price elasticity of demand, we can measure the price elasticity of supply using point and arc
elasticity methods. However, a simple and most commonly used method is point method.
The point price elasticity of supply can be calculated as the ratio of proportionate change in
quantity supplied of a commodity to a given proportionate change in its price. Thus, the formula
for measuring price elasticity of supply is:
𝐸
𝑠=
%𝑐
ℎ𝑎𝑛𝑔𝑒 𝑖𝑛 𝑞𝑢𝑎𝑛𝑡𝑖𝑡𝑦 𝑠𝑢𝑝
𝑝
𝑙𝑖𝑒
𝑑
=
Q
P
Q
*
P
% 𝑐
ℎ𝑎𝑛𝑔𝑒 𝑖𝑛 𝑝
𝑟𝑖𝑐
𝑒 Q P P Q
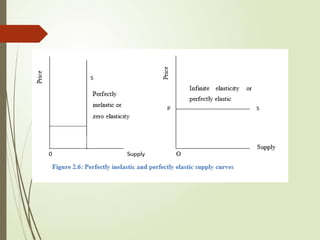
Like elasticity of demand, price elasticity of supply can be elastic, inelastic, unitary elastic,
perfectly elastic or perfectly inelastic. The supply is elastic when a small change on price leads
to great change in supply. It is inelastic or less elastic when a great change in price induces only
a slight change in supply. If the supply is perfectly inelastic, it will be represented by a vertical
line shown as below. If supply is perfectly elastic it will be represented by a horizontal straight
line as in second diagram.
ce
80.
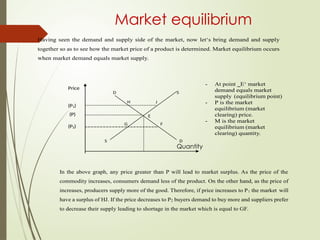
Market equilibrium
Having seenthe demand and supply side of the market, now let‘s bring demand and supply
together so as to see how the market price of a product is determined. Market equilibrium occurs
when market demand equals market supply.
Price
(P1)
(P)
(P2)
- At point ‗E‘ market
demand equals market
supply (equilibrium point)
- P is the market
equilibrium (market
clearing) price.
- M is the market
equilibrium (market
clearing) quantity.
Quantity
In the above graph, any price greater than P will lead to market surplus. As the price of the
commodity increases, consumers demand less of the product. On the other hand, as the price of
increases, producers supply more of the good. Therefore, if price increases to P1 the market will
have a surplus of HJ. If the price decreases to P2 buyers demand to buy more and suppliers prefer
to decrease their supply leading to shortage in the market which is equal to GF.
82.
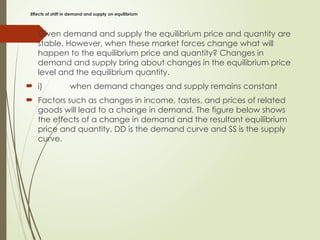
Effects of shiftin demand and supply on equilibrium
Given demand and supply the equilibrium price and quantity are
stable. However, when these market forces change what will
happen to the equilibrium price and quantity? Changes in
demand and supply bring about changes in the equilibrium price
level and the equilibrium quantity.
i) when demand changes and supply remains constant
Factors such as changes in income, tastes, and prices of related
goods will lead to a change in demand. The figure below shows
the effects of a change in demand and the resultant equilibrium
price and quantity. DD is the demand curve and SS is the supply
curve.
83.
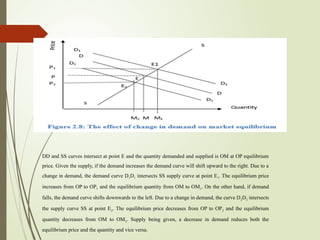
DD and SScurves intersect at point E and the quantity demanded and supplied is OM at OP equilibrium
price. Given the supply, if the demand increases the demand curve will shift upward to the right. Due to a
change in demand, the demand curve D1D1 intersects SS supply curve at point E1. The equilibrium price
increases from OP to OP1 and the equilibrium quantity from OM to OM1. On the other hand, if demand
falls, the demand curve shifts downwards to the left. Due to a change in demand, the curve D2D2 intersects
the supply curve SS at point E2. The equilibrium price decreases from OP to OP2 and the equilibrium
quantity decreases from OM to OM2. Supply being given, a decrease in demand reduces both the
equilibrium price and the quantity and vice versa.
84.
The effect ofchange in supply on market equilibrium
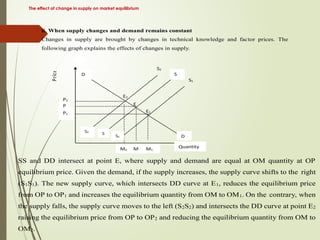
ii. When supply changes and demand remains constant
Changes in supply are brought by changes in technical knowledge and factor prices. The
following graph explains the effects of changes in supply.
Price
SS and DD intersect at point E, where supply and demand are equal at OM quantity at OP
equilibrium price. Given the demand, if the supply increases, the supply curve shifts to the right
(S1S1). The new supply curve, which intersects DD curve at E1, reduces the equilibrium price
from OP to OP1 and increases the equilibrium quantity from OM to OM1. On the contrary, when
the supply falls, the supply curve moves to the left (S2S2) and intersects the DD curve at point E2
raising the equilibrium price from OP to OP2 and reducing the equilibrium quantity from OM to
OM2.
85.
Effects of combinedchanges in demand and supply
When both demand and supply increase, the quantity of the
product will increase definitely. But it is not certain whether the
price will rise or fall. If an increase in demand is more than an
increase in supply, then the price goes up. On the other hand, if
an increase in supply is more than an increase in demand, the
price falls but the quantity increases. If the increase in demand
and supply is same, then the price remains the same.
When demand and supply decline, the quantity decreases. But
the change in price will depend upon the relative fall in demand
and supply. When the fall in demand is more than the fall in
supply, the price will decrease. On the other hand, when the fall in
supply is more than the fall in demand, the price will rise. If both
demand and supply decline in the same ratio, there is no change
in the equilibrium price, but the quantity decreases.
Activity: Considering the initial market equilibrium of figure 2.9 above, show the new equilibrium
if there is an increase in supply and proportionate increase in demand
if the magnitude of an increment in demand is less than an increment in supply
if demand and supply change in the opposite directions
86.
Summary
Demand for acommodity refers to the amount that will be purchased at a particular price during
a particular period of time. Price of the commodity, income of the consumer, prices of related
goods, consumer‘s tastes and preferences, consumers‘ expectations and number of buyers are
considered the main determinants of demand for a commodity. The law of demand states that,
other things remaining constant, the quantity demanded of a commodity increases when its price
falls and decreases when the price rises.
Supply refers to the quantity of a commodity which producers are willing to produce and offer
for sale at a particular price during a particular period of time. Price of a commodity, input prices,
prices of related products, techniques of production, policy of taxation and subsidy, expectations
of future prices, and the number of sellers are the main determinants of supply. Law of supply
states that other things remaining the same, the quantity of any commodity that firms will
produce and offer for sale rises with a rise in price and falls with a fall in price.
Market equilibrium refers to a situation in which quantity demanded of a commodity equals the
quantity supplied of a commodity.
Goods can be categorized as normal good (a good for which the demand increases with increases
in income), an inferior good (a good for which the demand tends to fall with an increase in the
income of the consumer), substitute goods(are those goods which satisfy the same type of
demand and can be used in place of one another), complementary goods( are those goods which
are used jointly or together), and giffen goods(whose demand falls with a fall in their prices).
Elasticity of demand refers to the degree of responsiveness of quantity demanded of a commodity
to change in any of its determinants. There are three types of elasticity of demand: Price elasticity
of demand, income elasticity of demand and cross price elasticity of demand. Price elasticity of
demand is determined by availability of substitutes, nature of the commodity, proportion of
income spent and time.
87.
Theory of ConsumerBehaviour
Consumer behaviour can be best understood in
three steps. First, by examining consumer‘s
preference, we need a practical way to describe
how people prefer one good to another. Second,
we must take into account that consumers face
budget constraints – they have limited incomes
that restrict the quantities of goods they can buy.
Third, we will put consumer preference and
budget constraint together to determine
consumer choice.
88.
A consumermakes choices by comparing bundle of goods. Given any two
consumption bundles, the consumer either decides that one of the consumption
bundles is strictly better than the other, or decides that she is indifferent between the
two bundles.
In order to tell whether one bundle is preferred to another, we see how the
consumer behaves in choice situations involving two bundles. If she always chooses
X when Y is available, then it is natural to say that this consumer prefers X to Y. We
use the symbol ≻ to mean that one bundle is strictly preferred to another, so that X
Y
≻ should be interpreted as saying that the consumer strictly prefers X to Y, in the
sense that she definitely wants the X-bundle rather than the Y-bundle.
If the consumer is indifferent between two bundles of goods, we use the symbol
and write X~Y
∼ . Indifference means that the consumer would be just as satisfied,
according to her own preferences, consuming the bundle X as she would be
consuming bundle Y. If the consumer prefers or is indifferent between the two
bundles we say that she weakly prefers X to Y and write X Y.
⪰
The relations of strict preference, weak preference, and indifference are not
independent concepts; the relations are themselves related. For example, if X Y
⪰
and Y X, we can conclude that X ~Y
⪰ . That is, if the consumer thinks that X is at least
as good as Y and that Y is at least as good as X, then she must be indifferent
between the two bundles of goods. Similarly, if X Y but we know that it is not the
⪰
case that X~ Y, we can conclude that X Y. This just says that if the consumer thinks
≻
that X is at least as good as Y, and she is not indifferent between the two bundles,
then she thinks that X is strictly better than Y.
89.
The concept ofutility
Economists use the term utility to describe the satisfaction
or pleasure derived from the consumption of a good or
service. In other words, utility is the power of the product
to satisfy human wants. Given any two consumption
bundles X and Y, the consumer definitely wants the X-
bundle than the Y-bundle if and only if the utility of X is
better than the utility of Y.
Do you think that utility and usefulness are synonymous? Do two individuals
always derive equal satisfaction from consuming the same level of a product?
90.
In defining utility,it is important to bear in mind the following points.
‘Utility’ and ‘Usefulness’ are not synonymous. For example,
paintings by Picasso may be useless functionally but offer
great utility to art lovers. Hence, usefulness is product
centric whereas utility is consumer centric.
Utility is subjective. The utility of a product will vary from
person to person. That means, the utility that two individuals
derive from consuming the same level of a product may
not be the same. For example, non-smokers do not derive
any utility from cigarettes.
Utility can be different at different places and time. For
example, the utility that we get from drinking coffee early in
the morning may be different from the utility we get during
lunch time.