Download to read offline
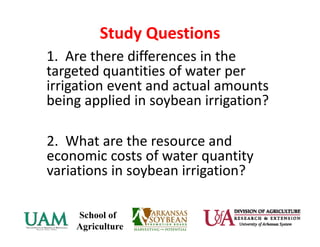
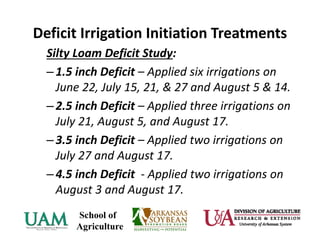
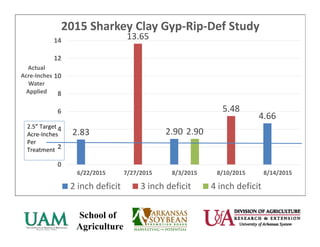

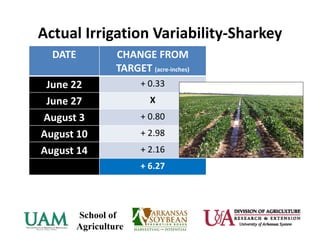
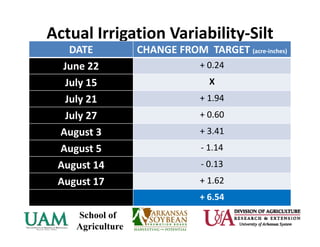
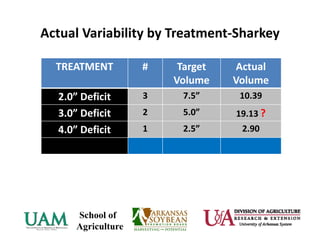
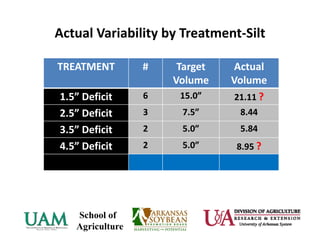
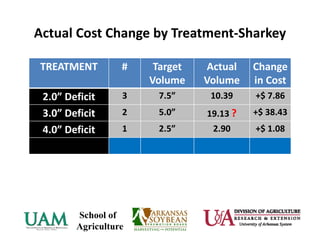
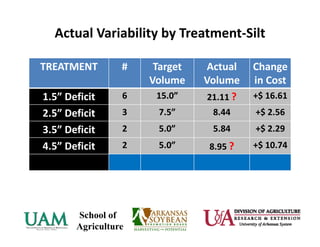
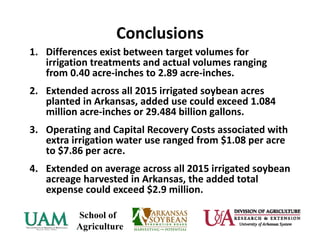

This study examined differences between targeted and actual irrigation amounts applied to soybean fields in Arkansas. Researchers found that actual water usage exceeded targets by 0.4 to 2.9 acre-inches per treatment. Extrapolated across all irrigated soybean acres in the state, this could mean over 1 billion extra acre-inches of water used, costing an estimated $2.9 million. The costs of applying more water than planned ranged from $1.08 to $7.86 per acre depending on the treatment. This has implications for water conservation and farm budgets in Arkansas soybean production.


