SlideShare a Scribd company logo
1 of 26
Download to read offline
United States
                                   Department of
                                   Agriculture

                                   Foreign
                                   Agricultural
                                   Service
                                                     Coffee:
                                   Circular Series
                                   June 2011         World Markets and Trade
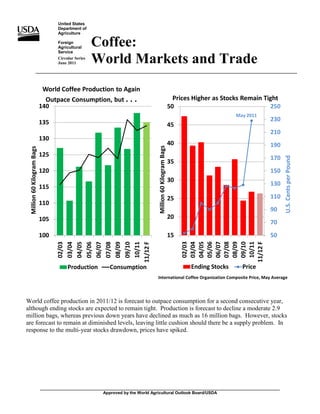
                             World Coffee Production to Again
                              Outpace Consumption, but . . .                                              Prices Higher as Stocks Remain Tight
                            140                                                                          50                                250
                                                                                                                                May 2011
                            135                                                                                                            230
                                                                                                         45
                                                                                                                                           210
                            130
                                                                                                         40                                190

                                                                              Million 60 Kilogram Bags
 Million 60 Kilogram Bags


                            125                                                                                                            170


                                                                                                                                                 U.S. Cents per Pound
                                                                                                         35
                            120                                                                                                            150
                                                                                                         30
                            115                                                                                                            130

                                                                                                         25                                110
                            110
                                                                                                                                           90
                            105                                                                          20
                                                                                                                                           70
                            100                                                                          15                                50
                                                                                                               02/03
                                                                                                               03/04
                                                                                                               04/05
                                                                                                               05/06
                                                                                                               06/07
                                                                                                               07/08
                                                                                                               08/09
                                                                                                               09/10
                                                                                                               10/11
                                                                                                              11/12 F
                                   02/03
                                   03/04
                                   04/05
                                   05/06
                                   06/07
                                   07/08
                                   08/09
                                   09/10
                                   10/11
                                  11/12 F


                                        Production       Consumption                                            Ending Stocks     Price
                                                                               International Coffee Organization Composite Price, May Average


World coffee production in 2011/12 is forecast to outpace consumption for a second consecutive year,
although ending stocks are expected to remain tight. Production is forecast to decline a moderate 2.9
million bags, whereas previous down years have declined as much as 16 million bags. However, stocks
are forecast to remain at diminished levels, leaving little cushion should there be a supply problem. In
response to the multi-year stocks drawdown, prices have spiked.


                            _______________________________________________________________________________________________________
                                                       Approved by the World Agricultural Outlook Board/USDA
Decade in Review
          In the last decade, world production has                                        Brazil and Vietnam Lead Production Growth
          expanded by 23.5 million bags (21
          percent), with Brazil and Vietnam                                       140
          accounting for virtually all of the gain.
                                                                                                                                                              Vietnam
          The other 50 producing countries have                                   120
          been mostly flat, with growth in some


                                                       Million 60 Kilogram Bags
          countries largely being offset by losses
                                                                                  100
          in others. For example, Nicaragua,
          Honduras,      Peru     and     Indonesia                                                                                                           Brazil
          experienced growth in excess of 1                                        80
          million bags during this period, but
          declines of similar caliber occurred in                                  60
          Cote      d’Ivoire     and     Colombia.
          Production in just the last few years has
          fallen in certain countries because of                                   40
                                                                                                                                                              Other
          pests, diseases and/or poor weather.
          Also, output has been affected by tree                                   20
          renovation        programs        recently
          implemented in several countries.
                                                                                      -
          Arabica and Robusta production have                                                          2001/02                                               2011/12 F
          increased by nearly equal amounts in the
          last decade, expanding 11.9 million and
          11.6 million bags, respectively. As a                                             Brazil Dominates Arabica                                    Vietnam and Brazil Account
          result, the ratio has not changed                                                   Expansion, While . . .                                   For Nearly All Robusta Growth
                                                                                  90                                                              60
          significantly from 60 percent Arabica to
          40 percent Robusta. The vast majority
                                                                                  80
          of the Arabica growth has come from
                                                                                                                                                  50
          Brazil, with gains in Honduras, Peru and                                70                                                                                      Brazil
          Nicaragua partially offset by losses in                                                           Brazil
                                                                                                                       Million 60 Kilogram Bags
                                                       Million 60 Kilogram Bags


          Colombia, India and Costa Rica. Nearly                                  60                                                              40
          two-thirds of the Robusta gain has been
          from Vietnam and one-third from                                         50
          Brazil.                                                                                                                                 30
                                                                                                                                                                         Vietnam
                                                                                  40
          Stocks have been cut nearly in half in
          the last decade and their location has                                  30                                                              20
          shifted.     Initially, top consuming                                                             Other
          countries were balanced with top                                        20
                                                                                                                                                  10
                                                                                                                                                                          Other
          producing countries at about 40 percent.
          The United States, Europe and Japan are                                 10
          forecast to account for 70 percent with
                                                                                  -                                                               -
          Brazil, Vietnam and Colombia holding
          just 25 percent.                                                                   2001/02       2011/12 F                                       2001/02       2011/12 F


Foreign Agricultural Service/USDA
Office of Global Analysis                                                                                                                                                              June 2011
2011/12 Production Forecast
          World coffee production for 2011/12 is forecast at 135.0 million bags, down just 2.9 million as Brazil
          enters the off-year of the biennial Arabica production cycle. Record Robusta crops in Brazil and Vietnam,
          combined with Colombia’s continued recovery, are expected to soften the decline.

          Brazil’s Robusta harvest is forecast to jump 1.8 million bags to a record 14.5 million as favorable weather
          conditions and good crop management benefited fruit setting and development in the State of Espirito
          Santo, where nearly 75 percent is grown.
          Production during the previous two                Record Robusta Crop Forecast for Brazil
                                                         15
          seasons suffered from weather related
          problems during the blossoming period,
                                                         12
          making the year-over-year growth all the


                                                        Million 60 Kilogram Bags
          more dramatic. The Arabica crop is
          forecast to drop 7.1 million bags to 34.7       9
          million during the off-year of the
          biennial cycle, a normal amount as              6
          compared to recent periods. Strong
          blossoming, favorable weather and good          3
          crop management supported ideal cherry
          setting and development. As a result,           0
          total production is forecast to fall 5.3             2007/08    2008/09      2009/10   2010/11  2011/12 F
          million bags to 49.2 million.                                     Espirito Santo     Other

          Vietnam is forecast to rise 1.9 million bags to a record 20.6 million as the rainy season arrived on time,
          resulting in a good flowering and fruit setting. High prices motivated many growers to irrigate in order to
          boost yields, while higher incomes encouraged some farmers to begin replacing low-yielding trees.

          Colombia is forecast to recover 1 million bags to 10.5 million. High prices combined with government
          support encouraged many growers to apply more fertilizer, pesticides and fungicides in order to improve
          yields. However, the crop is still short of the five-year average of 11.8 million produced prior to shortfalls
          caused by coffee rust and the coffee cherry borer. The ongoing tree renovation program has also cut into
          yields.

          Indonesia is forecast down 1.4 million bags to 7.9 million as higher-than-average rainfall during flowering
          damaged the bloom in many areas.

          India is forecast to slip 300,000 bags to 4.8 million mainly because Robusta areas experienced uneven
          rainfall during the bloom period, which is expected to lower yields.

          Mexico is forecast at 3.7 million bags, unchanged from last year’s low production, as dry conditions in
          certain areas adversely affected the bloom.

          For further information, please contact Tony Halstead at 202-720-4620, or send an email to
          Tony.Halstead@fas.usda.gov

          Users can find the release schedule and generate the full USDA Production, Supply and Distribution
          (PSD) dataset for reporting countries by accessing the following link:
          http://www.fas.usda.gov/psdonline/psdHome.aspx


Foreign Agricultural Service/USDA
Office of Global Analysis                                                                                                  June 2011
Coffee: ICO Average Composite Indicator Price

                    Jan.       Feb.    Mar.     Apr.      May      June      July    Aug.    Sept.     Oct.    Nov.      Dec.
                                                         --------Cents per pound--------

       ICO Composite:
         2001  49.19         49.39     48.52    47.31    49.38    46.54    43.07    42.77    41.17    42.21    44.24    43.36
         2002  43.46         44.30     49.49    50.19    47.30    45.56    44.70    42.79    47.96    50.79    54.69    51.68
         2003  54.04         54.07     49.61    51.87    53.19    48.90    50.89    52.22    54.10    51.72    49.81    52.44
         2004  58.69         59.87     60.80    58.80    59.91    64.28    58.46    56.98    61.47    61.10    67.74    77.72
         2005  79.35         89.40    101.44    98.20    99.78    96.29    88.48    85.31    78.79    82.55    85.93    86.85
         2006 101.20         97.39     92.76    94.20    90.00    86.04    88.57    95.78    95.98    95.53   103.48   108.01
         2007 105.81        104.18    100.09    99.30   100.09   107.03   106.20   107.98   113.20   115.71   114.43   118.16
         2008 122.33        138.82    136.17   126.55   126.76   130.51   132.78   131.14   126.69   108.31   107.88   103.07
         2009 108.39        107.60    105.87   111.61   123.05   119.05   112.90   117.45   116.40   121.09   119.67   124.96
         2010 126.85        123.37    125.30   126.89   128.10   142.20   153.41   157.46   163.61   161.56   173.90   184.26
         2011 197.35        216.03    224.33   231.24   227.97

       Source: International Coffee Organization (ICO).
       http://www.ico.org/historical/2000+/PDF/HIST-PRICES.pdf
       1/ Average through the latest month.


Foreign Agricultural Service/USDA                                                                                               June 2011
Office of Global Analysis
Table 01 Coffee World Production, Supply and Distribution

                                                                                                Thousand 60-Kilogram Bags

                                 Beginning         Arabica           Robusta         Production         Imports         Total Supply     Exports       Domestic      Ending          Total        Exportable
                                   Stocks         Production        Production                                                                        Consumption    Stocks       Distribution    Production


      Coffee, Green
        1977/78                          25,667           54,430            15,920           70,724               627           97,018       48,755         18,828       29,435          97,018         52,233
        1978/79                          29,435           59,847            18,770           79,018               678          109,131       64,612         19,462       25,057         109,131         60,035
        1979/80                          25,057           62,302            19,207           81,906               653          107,616       62,130         19,963       25,523         107,616         62,283
        1980/81                          25,523           63,154            22,584           86,174               675          112,372       60,955         20,438       30,979         112,372         66,007
        1981/82                          30,979           75,132            22,396           98,023               755          129,757       65,359         20,556       43,842         129,757         77,771
        1982/83                          43,842           59,258            22,196           81,904               733          126,479       66,059         20,221       40,199         126,479         61,916
        1983/84                          40,199           70,459            17,905           88,801               606          129,606       68,191         20,577       40,838         129,606         68,490
        1984/85                          40,838           65,302            24,591           90,362               456          131,656       72,322         21,968       37,366         131,656         68,591
        1985/86                          37,366           71,299            23,998           95,750               397          133,513       70,478         21,220       41,815         133,513         74,777
        1986/87                          41,815           52,812            26,121           79,394               262          121,471       66,982         21,202       33,287         121,471         58,416
        1987/88                          33,287           78,985            23,810          103,170               296          136,753       67,504         21,075       48,174         136,753         82,310
        1988/89                          48,174           64,934            28,901           94,165               415          142,754       71,371         21,190       50,193         142,754         73,168
        1989/90                          50,193           69,118            27,542           96,958               258          147,409       83,402         20,995       43,012         147,409         76,157
        1990/91                          43,012           72,143            27,768          100,181               331          143,524       76,163         22,265       45,096         143,524         78,131
        1991/92                          45,096           73,980            29,809          104,064               291          149,451       80,887         22,266       46,298         149,451         81,950
        1992/93                          46,298           65,234            27,455           92,959               713          139,970       77,869         21,579       40,522         139,970         71,722
        1993/94                          40,522           65,052            27,146           92,406               585          133,513       76,284         22,928       34,301         133,513         69,764
        1994/95                          34,301           68,809            28,033           97,042             1,070          132,413       68,672         22,526       41,215         132,413         74,978
        1995/96                          41,215           61,394            27,372           88,946             1,079          131,240       74,103         24,049       33,088         131,240         65,393
        1996/97                          33,088           66,452            37,236          103,786             1,091          137,965       84,509         24,361       29,095         137,965         79,780
        1997/98                          29,095           64,712            32,940           97,687             1,220          128,002       77,939         25,180       24,883         128,002         72,986
        1998/99                          24,883           74,859            34,060          108,953             1,435          135,271       85,133         25,738       24,400         135,271         83,533
        1999/00                          24,400           73,200            40,323          113,553             1,303          139,256       92,733         25,648       20,875         139,256         88,064
        2000/01                          20,875           70,486            47,000          117,521             1,478          139,874       90,937         26,319       22,618         139,874         91,357
        2001/02                          22,618           68,199            43,289          111,518             6,974          141,110       88,292         27,611       25,207         141,110         84,157
        2002/03                          39,422           84,953            42,121          127,102           90,663           257,187       94,108        115,720       47,359         257,187         99,454
        2003/04                          47,359           66,540            44,185          110,750           90,698           248,807       90,071        119,391       39,345         248,807         80,601
        2004/05                          39,345           77,994            43,243          121,262           93,011           253,618       93,195        120,149       40,274         253,618         89,607
        2005/06                          40,274           69,802            46,894          116,721           92,195           249,190       92,829        125,107       31,254         249,190         84,653
        2006/07                          31,254           82,227            49,567          131,819           97,470           260,543      102,839        124,107       33,597         260,543         99,197
        2007/08                          33,597           73,145            48,583          121,753           96,809           252,159       96,479        127,033       28,647         252,159         88,620
        2008/09                          28,647           82,886            50,492          133,403           96,831           258,881       99,476        123,742       35,663         258,881         99,179
        2009/10                          35,663           74,379            52,377          126,781           99,581           262,025      101,736        135,871       24,418         262,025         91,901
        2010/11                          24,418           85,787            52,096          137,908          104,473           266,799      107,455        132,497       26,847         266,799        101,503
        2011/12                          26,847           80,125            54,896          135,046          100,574           262,467      102,123        133,957       26,387         262,467         98,112


        Note:
        Prior to 2002/03, the database does not include import, consumption or stocks data for non-producing countries such as the
        United States, EU-27 and Japan.


Foreign Agricultural Service/USDA
Office of Global Analysis                                                                                                                                                                               June 2011
Table 01A Coffee Production, Consumption and Ending Stocks
                                                                     Thousand 60-Kilogram Bags

                                                                                                                                                         Jun
                                                 2006/07               2007/08               2008/09               2009/10                2010/11    2011/12

     Production                                                                                                                                          none
       Brazil                                        46,700                39,100                53,300               44,800                54,500      49,200
       Vietnam                                       19,500                18,000                16,980               18,500                18,725      20,600
       Colombia                                      12,164                12,515                 8,664                 8,100                9,500      10,500
       Indonesia                                      7,500                 7,600                 9,300               10,500                 9,325       7,885
       India                                          4,665                 4,660                 4,375                 4,850                5,100       4,800
       Ethiopia                                       4,036                 3,906                 3,650                 4,000                4,400       4,500
       Honduras                                       3,460                 3,642                 3,225                 3,550                4,000       4,100
       Guatemala                                      4,050                 4,110                 3,980                 4,010                3,910       3,910
       Peru                                           4,400                 2,800                 4,000                 3,300                4,000       3,800
       Mexico                                         4,500                 4,350                 4,550                 4,150                3,700       3,700
       Other                                         20,844                21,070                21,379               21,021                20,748      22,051
         Total                                      131,819               121,753              133,403               126,781               137,908     135,046
     Domestic Consumption                                                                                                                                none
       EU-27                                         44,555                45,885                41,815               51,880                44,925      46,600
       United States                                 23,324                23,726                23,800               23,395                23,952      24,150
       Brazil                                        16,720                17,390                18,030               18,760                19,500      20,100
       Japan                                          7,315                 7,060                 7,025                 7,035                7,250       7,125
       Russia                                         4,410                 4,520                 3,455                 4,075                4,100       3,975
       Philippines                                    1,335                 1,380                 1,620                 2,220                2,314       2,255
       Canada                                         1,950                 1,960                 1,940                 2,010                2,300       2,100
       Algeria                                        1,825                 2,025                 2,045                 2,060                2,050       2,025
       Switzerland                                    1,490                 1,710                 1,800                 1,950                2,200       2,000
       Mexico                                         1,750                 1,800                 1,950                 1,900                2,000       1,950
       Other                                         19,433                19,577                20,262               20,586                21,906      21,677
         Total                                      124,107               127,033              123,742               135,871               132,497     133,957
     Ending Stocks                                                                                                                                       none
       EU-27                                         12,900                12,775                16,325               10,850                13,000      12,000
       Brazil                                         8,361                 2,781                 6,576                 2,836                3,836       4,936
       United States                                  5,700                 5,600                 5,333                 4,250                4,800       4,500
       Japan                                          2,160                 1,960                 2,050                 1,850                2,250       1,950
       Vietnam                                          244                 1,747                 2,307                 1,140                 895         970
       Venezuela                                        480                   370                   330                   380                 315         340
       Colombia                                         890                   885                   209                   284                 224         324
       Switzerland                                      200                   200                   200                   200                 200         200
       Norway                                           125                   125                   125                   125                 125         125
       Cote d'Ivoire                                    202                   130                   128                   173                 123         123
       Other                                          2,335                 2,074                 2,080                 2,330                1,079        919
         Total                                       33,597                28,647                35,663               24,418                26,847      26,387


     Notes:
     Coffee marketing year for producer countries begins either in October (Colombia), April (Indonesia) or July (Brazil), as examples.
     Coffee marketing year for non-producer countries begins in October.


Foreign Agricultural Service/USDA
Office of Global Analysis                                                                                                                                June 2011
Table 01B Green Coffee Bean Exports and Imports
                                                                  Thousand 60-Kilogram Bags

                                                                                                                                                      Jun
                                               2006/07              2007/08              2008/09              2009/10              2010/11        2011/12

     Bean Exports                                                                                                                                     none
       Brazil                                      26,185               23,770               28,396               26,580              30,630         24,930
       Vietnam                                     18,740               15,600               15,430               18,425              17,550         19,000
       Colombia                                    10,460               10,770                8,160                6,445                  8,400       9,000
       Indonesia                                    6,000                5,510                6,625                7,425                  7,050       5,150
       Guatemala                                    3,980                3,890                3,783                3,860                  3,940       3,925
       Honduras                                     3,370                3,440                3,050                3,200                  4,000       3,925
       Peru                                         4,200                2,660                3,830                3,150                  3,825       3,650
       Ethiopia                                     2,225                2,110                1,850                2,325                  2,550       2,640
       India                                        2,550                2,620                2,120                2,760                  2,775       2,500
       Uganda                                       1,840                2,160                2,770                2,290                  1,900       2,100
       Nicaragua                                    1,160                1,580                1,425                1,650                  1,850       1,900
       Cote d'Ivoire                                1,710                1,550                1,180                1,755                  1,550       1,700
       El Salvador                                  1,320                1,580                1,506                1,215                  1,575       1,450
       Mexico                                       2,260                1,910                2,125                1,790                  1,500       1,400
       Costa Rica                                   1,582                1,588                1,410                1,200                  1,350       1,390
       Other                                        6,232                5,368                5,676                6,117                  5,534       6,129
         Total                                     93,814               86,106               89,336               90,187              95,979         90,789
     Bean Imports                                                                                                                                     none
       EU-27                                       44,370               43,550               43,350               44,280              45,000         43,500
       United States                               22,110               21,775               21,660               20,250              22,500         21,800
       Japan                                        6,200                6,150                6,375                6,160                  7,000       6,200
       Canada                                       1,950                1,960                1,940                2,010                  2,300       2,100
       Algeria                                      1,825                2,025                2,045                2,060                  2,050       2,025
       Switzerland                                  1,490                1,710                1,800                1,950                  2,200       2,000
       Korea, South                                 1,400                1,550                1,680                1,705                  2,000       1,900
       Russia                                         960                  970                1,240                1,430                  1,450       1,475
       Australia                                      900                  920                  950                1,040                  1,075       1,100
       Malaysia                                       730                  660                  650                  960                   850         850
       Ecuador                                        130                  210                  310                  650                   700         750
       China                                          300                  300                  320                  425                   575         675
       Norway                                         650                  590                  610                  580                   725         600
       Colombia                                       190                  110                  650                  570                   750         560
       Argentina                                      510                  490                  480                  500                   515         525
       Other                                        3,709                3,426                3,442                4,300                  4,160       4,015
         Total                                     87,424               86,396               87,502               88,870              93,850         90,075


     Coffee marketing year for producer countries begins either in October (Colombia), April (Indonesia) or July (Brazil), as examples.
     Coffee marketing year for non-producer countries begins in October.
     For the United States, Canada and the EU-27, exports appear as zero in the database and the actual amount has been subtracted from
     imports to show net imports.


Foreign Agricultural Service/USDA
Office of Global Analysis                                                                                                                             June 2011
Table 02A Green Coffee Bean Production
                                                                     Thousand 60-Kilogram Bags

                                                                                                                                                         Jun
                                                 2006/07               2007/08               2008/09               2009/10                2010/11    2011/12

     Production                                                                                                                                          none
       Angola                                             35                   30                    30                    30                  25          25
       Bolivia                                          152                   140                   135                   140                 135         140
       Brazil                                        46,700                39,100                53,300               44,800                54,500      49,200
       Burundi                                          287                   209                   250                   300                 250         275
       Cameroon                                         835                   695                   650                   590                 615         590
       Central African Republic                           45                   50                    10                    30                  35          30
       Colombia                                      12,164                12,515                 8,664                 8,100                9,500      10,500
       Congo (Kinshasa)                                 280                   315                   300                   305                 285         290
       Costa Rica                                     1,782                 1,867                 1,580                 1,475                1,575       1,640
       Cote d'Ivoire                                  2,447                 2,098                 1,853                 2,350                2,100       2,300
       Cuba                                             100                    70                   127                   120                 120         125
       Dominican Republic                               390                   465                   545                   500                 500         500
       Ecuador                                          875                   825                   635                   635                 650         650
       El Salvador                                    1,400                 1,650                 1,550                 1,300                1,700       1,525
       Ethiopia                                       4,036                 3,906                 3,650                 4,000                4,400       4,500
       Ghana                                              29                   27                    19                    30                  35          35
       Guatemala                                      4,050                 4,110                 3,980                 4,010                3,910       3,910
       Guinea                                           400                   250                   400                   495                 225         450
       Haiti                                            337                   335                   360                   275                 300         300
       Honduras                                       3,460                 3,642                 3,225                 3,550                4,000       4,100
       India                                          4,665                 4,660                 4,375                 4,850                5,100       4,800
       Indonesia                                      7,500                 7,600                 9,300               10,500                 9,325       7,885
       Jamaica                                            30                   35                    31                    29                  25          30
       Kenya                                            870                   700                   884                   750                 750         825
       Laos                                             420                   355                   350                   390                 450         475
       Liberia                                            53                   25                     7                     2                   1              1
       Madagascar                                       582                   555                   530                   475                 525         550
       Malawi                                             17                   25                    25                    25                  25          25
       Malaysia                                         500                   770                   975                 1,000                1,000       1,100
       Mexico                                         4,500                 4,350                 4,550                 4,150                3,700       3,700
       Nicaragua                                      1,300                 1,850                 1,650                 1,925                2,000       2,150
       Nigeria                                            51                   35                    30                    30                  30          30
       Panama                                           150                   150                   100                   100                 100         100
       Papua New Guinea                                 810                   970                 1,035                 1,085                 890        1,050
       Paraguay                                           20                   28                    25                    25                  25          25
       Peru                                           4,400                 2,800                 4,000                 3,300                4,000       3,800
       Philippines                                      705                   460                   360                   245                 460         455
       Rwanda                                           400                   230                   340                   240                 310         325
       Sierra Leone                                       31                   42                    87                    90                  60          70
       Sri Lanka                                          32                   35                    35                    35                  35          35
       Tanzania                                         820                   830                 1,040                   920                 825         900
       Thailand                                         850                   900                   800                   900                 900         900
       Togo                                             180                   255                   185                   450                 525         550
       Uganda                                         2,300                 2,500                 3,200                 2,700                2,300       2,500
       United States                                    154                   151                   133                   107                 102         100
       Venezuela                                        862                   900                   900                   725                 690         800
       Vietnam                                       19,500                18,000                16,980               18,500                18,725      20,600
       Yemen                                            200                   150                   150                   150                 150         150
       Zambia                                             56                   60                    39                    27                  10          15
       Zimbabwe                                           45                   31                    22                    21                  10          15
       Trinidad and Tobago                                12                     2                    2                     0                   0              0
         Total                                      131,819               121,753              133,403               126,781               137,908     135,046


     Notes:
     Coffee marketing year for producer countries begins either in October (Colombia), April (Indonesia) or July (Brazil), as examples.
     Coffee marketing year for non-producer countries begins in October.


Foreign Agricultural Service/USDA
Office of Global Analysis                                                                                                                                June 2011
Table 02B Arabica Coffee Production
                                                                     Thousand 60-Kilogram Bags

                                                                                                                                                         Jun
                                                 2006/07               2007/08               2008/09               2009/10                2010/11    2011/12

     Arabica Production                                                                                                                                  none
       Bolivia                                          152                   140                   135                   140                 135         140
       Brazil                                        36,000                27,650                40,500               33,000                41,800      34,700
       Burundi                                          287                   209                   250                   300                 250         275
       Cameroon                                           90                   90                    90                    90                  90          90
       Colombia                                      12,164                12,515                 8,664                 8,100                9,500      10,500
       Congo (Kinshasa)                                 100                   115                   100                   105                 100         100
       Costa Rica                                     1,782                 1,867                 1,580                 1,475                1,575       1,640
       Cuba                                             100                    70                   127                   120                 120         125
       Dominican Republic                               390                   465                   545                   500                 500         500
       Ecuador                                          500                   475                   360                   375                 400         425
       El Salvador                                    1,400                 1,650                 1,550                 1,300                1,700       1,525
       Ethiopia                                       4,036                 3,906                 3,650                 4,000                4,400       4,500
       Guatemala                                      4,040                 4,100                 3,970                 4,000                3,900       3,900
       Haiti                                            337                   335                   360                   275                 300         300
       Honduras                                       3,460                 3,642                 3,225                 3,550                4,000       4,100
       India                                          1,415                 1,580                 1,325                 1,600                1,500       1,475
       Indonesia                                        900                   800                 1,200                 1,500                1,375       1,230
       Jamaica                                            30                   35                    31                    29                  25          30
       Kenya                                            870                   700                   884                   750                 750         825
       Madagascar                                         30                   30                    30                    25                  25          25
       Malawi                                             17                   25                    25                    25                  25          25
       Mexico                                         4,300                 4,100                 4,300                 3,950                3,500       3,500
       Nicaragua                                      1,300                 1,850                 1,650                 1,925                2,000       2,150
       Panama                                           150                   150                   100                   100                 100         100
       Papua New Guinea                                 780                   925                 1,000                 1,050                 850        1,000
       Paraguay                                           20                   28                    25                    25                  25          25
       Peru                                           4,400                 2,800                 4,000                 3,300                4,000       3,800
       Philippines                                        35                   35                    35                    20                  35          30
       Rwanda                                           400                   230                   340                   240                 310         325
       Sri Lanka                                           9                   10                    10                    10                  10          10
       Tanzania                                         515                   525                   700                   620                 550         600
       Trinidad and Tobago                                 1                     1                    1                     0                   0              0
       Uganda                                           400                   400                   400                   400                 400         400
       United States                                    154                   151                   133                   107                 102         100
       Venezuela                                        862                   900                   900                   725                 690         800
       Vietnam                                          500                   400                   480                   450                 575         675
       Yemen                                            200                   150                   150                   150                 150         150
       Zambia                                             56                   60                    39                    27                  10          15
       Zimbabwe                                           45                   31                    22                    21                  10          15
         Total                                       82,227                73,145                82,886               74,379                85,787      80,125


     Notes:
     Coffee marketing year for producer countries begins either in October (Colombia), April (Indonesia) or July (Brazil), as examples.
     Coffee marketing year for non-producer countries begins in October.


Foreign Agricultural Service/USDA
Office of Global Analysis                                                                                                                                June 2011
Table 02C Robusta Coffee Production
                                                                     Thousand 60-Kilogram Bags

                                                                                                                                                         Jun
                                                 2006/07               2007/08               2008/09               2009/10                2010/11    2011/12

     Robusta Production                                                                                                                                  none
       Angola                                             35                   30                    30                    30                  25          25
       Brazil                                        10,700                11,450                12,800               11,800                12,700      14,500
       Cameroon                                         745                   605                   560                   500                 525         500
       Central African Republic                           45                   50                    10                    30                  35          30
       Congo (Kinshasa)                                 180                   200                   200                   200                 185         190
       Cote d'Ivoire                                  2,447                 2,098                 1,853                 2,350                2,100       2,300
       Ecuador                                          375                   350                   275                   260                 250         225
       Ghana                                              29                   27                    19                    30                  35          35
       Guatemala                                          10                   10                    10                    10                  10          10
       Guinea                                           400                   250                   400                   495                 225         450
       India                                          3,250                 3,080                 3,050                 3,250                3,600       3,325
       Indonesia                                      6,600                 6,800                 8,100                 9,000                7,950       6,655
       Laos                                             420                   355                   350                   390                 450         475
       Liberia                                            53                   25                     7                     2                   1              1
       Madagascar                                       552                   525                   500                   450                 500         525
       Malaysia                                         500                   770                   975                 1,000                1,000       1,100
       Mexico                                           200                   250                   250                   200                 200         200
       Nigeria                                            51                   35                    30                    30                  30          30
       Papua New Guinea                                   30                   45                    35                    35                  40          50
       Philippines                                      645                   400                   300                   200                 400         400
       Sierra Leone                                       31                   42                    87                    90                  60          70
       Sri Lanka                                          23                   25                    25                    25                  25          25
       Tanzania                                         305                   305                   340                   300                 275         300
       Thailand                                         850                   900                   800                   900                 900         900
       Togo                                             180                   255                   185                   450                 525         550
       Trinidad and Tobago                                11                     1                    1                     0                   0              0
       Uganda                                         1,900                 2,100                 2,800                 2,300                1,900       2,100
       Vietnam                                       19,000                17,600                16,500               18,050                18,150      19,925
         Total                                       49,567                48,583                50,492               52,377                52,096      54,896


     Notes:
     Coffee marketing year for producer countries begins either in October (Colombia), April (Indonesia) or July (Brazil), as examples.
     Coffee marketing year for non-producer countries begins in October.


Foreign Agricultural Service/USDA
Office of Global Analysis                                                                                                                                June 2011
Table 03A Total Coffee Exports
                                                                     Thousand 60-Kilogram Bags

                                                                                                                                                      Jun
                                                 2006/07               2007/08               2008/09          2009/10              2010/11        2011/12

     Exports                                                                                                                                          none
       Angola                                              5                    4                      4               8                     5              5
       Bolivia                                          104                    73                     73              74                    75          75
       Brazil                                        29,260               27,290                   31,475         29,780              34,000         28,000
       Burundi                                          240                   300                    250             290                   250         270
       Cameroon                                         790                   560                    480             690                   550         525
       Central African Republic                          45                    50                      6              25                    30          30
       Colombia                                      11,155               11,525                    8,935          7,435                  9,150       9,800
       Congo (Kinshasa)                                  78                   110                    117             102                    95         100
       Costa Rica                                     1,582                 1,588                   1,410          1,200                  1,350       1,390
       Cote d'Ivoire                                  2,075                 1,870                   1,555          2,005                  1,850       2,000
       Cuba                                              13                     5                      6               7                     7              7
       Dominican Republic                                50                    41                     42              36                    48          50
       Ecuador                                          951                   942                    861           1,140                  1,250       1,275
       El Salvador                                    1,325                 1,585                   1,510          1,219                  1,579       1,454
       Ethiopia                                       2,225                 2,110                   1,850          2,325                  2,550       2,640
       Ghana                                             28                    26                     18              30                    35          35
       Guatemala                                      3,980                 3,890                   3,783          3,860                  3,940       3,925
       Guinea                                           390                   195                    375             460                   200         400
       Haiti                                             21                    19                     17              10                     6              5
       Honduras                                       3,370                 3,440                   3,050          3,200                  4,000       3,925
       India                                          3,609                 3,820                   3,120          4,110                  4,100       3,750
       Indonesia                                      6,400                 6,110                   7,700          8,750                  8,250       6,350
       Jamaica                                           20                    30                     26              24                    20          25
       Kenya                                            870                   820                    980             740                   750         800
       Laos                                             280                   225                    250             290                   350         375
       Liberia                                           49                    25                      7               2                     1              1
       Madagascar                                       200                   165                    115              40                    85         100
       Malawi                                            17                    25                     25              24                    24          24
       Malaysia                                       1,171                 1,422                   1,619          1,980                  1,870       1,920
       Mexico                                         2,865                 2,610                   2,735          2,480                  2,150       2,125
       Nicaragua                                      1,310                 1,745                   1,585          1,806                  1,925       2,050
       Nigeria                                             9                    1                      1               3                     2              2
       Panama                                            95                    96                     45              53                    50          50
       Papua New Guinea                                 820                   900                   1,070          1,040                   875        1,000
       Paraguay                                          10                    10                      5               5                     5              5
       Peru                                           4,200                 2,660                   3,830          3,150                  3,825       3,650
       Philippines                                         1                    0                      0               0                     0              0
       Rwanda                                           400                   230                    340             240                   310         325
       Sierra Leone                                      30                    25                     70              70                    40          50
       Tanzania                                         745                   730                    880             875                   705         800
       Thailand                                         925                   775                    644             684                   807         760
       Togo                                             200                   250                    185             440                   525         550
       Uganda                                         1,840                 2,160                   2,770          2,290                  1,900       2,100
       Venezuela                                        120                   160                      0               0                     0              0
       Vietnam                                       18,840               15,735                   15,565         18,670              17,875         19,350
       Yemen                                             30                    40                     35              30                    25          25
       Zambia                                            55                    59                     39              27                    10          15
       Zimbabwe                                          41                    27                     18              17                     6          10
         Total                                      102,839               96,479                   99,476       101,736              107,455        102,123


     Notes:
     A conversion factor of 2.6 was used to convert soluble coffee to the green bean equivalent.

     Coffee marketing year for producer countries begins either in October (Colombia), April (Indonesia) or July (Brazil), as examples.
     Coffee marketing year for non-producer countries begins in October.
     For the United States, Canada and the EU-27, exports appear as zero in the database and the actual amount has been subtracted from
     imports to show net imports.


Foreign Agricultural Service/USDA
Office of Global Analysis                                                                                                                             June 2011
Table 03B Green Coffee Bean Exports
                                                                  Thousand 60-Kilogram Bags

                                                                                                                                                      Jun
                                               2006/07              2007/08              2008/09              2009/10              2010/11        2011/12

     Bean Exports                                                                                                                                     none
       Angola                                            5                   4                    4                    8                     5              5
       Bolivia                                        104                   73                   73                   74                    75          75
       Brazil                                      26,185               23,770               28,396               26,580              30,630         24,930
       Burundi                                        240                  300                  250                  290                   250         270
       Cameroon                                       790                  560                  480                  690                   550         525
       Central African Republic                        45                   50                    6                   25                    30          30
       Colombia                                    10,460               10,770                8,160                6,445                  8,400       9,000
       Congo (Kinshasa)                                78                  110                  117                  102                    95         100
       Costa Rica                                   1,582                1,588                1,410                1,200                  1,350       1,390
       Cote d'Ivoire                                1,710                1,550                1,180                1,755                  1,550       1,700
       Cuba                                            13                    5                    6                    7                     7              7
       Dominican Republic                              50                   41                   42                   36                    48          50
       Ecuador                                        300                  180                  179                  450                   425         425
       El Salvador                                  1,320                1,580                1,506                1,215                  1,575       1,450
       Ethiopia                                     2,225                2,110                1,850                2,325                  2,550       2,640
       Ghana                                           28                   26                   18                   30                    35          35
       Guatemala                                    3,980                3,890                3,783                3,860                  3,940       3,925
       Guinea                                         390                  195                  375                  460                   200         400
       Haiti                                           21                   19                   17                   10                     6              5
       Honduras                                     3,370                3,440                3,050                3,200                  4,000       3,925
       India                                        2,550                2,620                2,120                2,760                  2,775       2,500
       Indonesia                                    6,000                5,510                6,625                7,425                  7,050       5,150
       Jamaica                                         20                   30                   26                   24                    20          25
       Kenya                                          870                  820                  980                  740                   750         800
       Laos                                           280                  225                  250                  290                   350         375
       Liberia                                         49                   25                    7                    2                     1              1
       Madagascar                                     200                  165                  115                   40                    85         100
       Malawi                                          17                   25                   25                   24                    24          24
       Malaysia                                        21                   12                   19                   16                    20          20
       Mexico                                       2,260                1,910                2,125                1,790                  1,500       1,400
       Nicaragua                                    1,160                1,580                1,425                1,650                  1,850       1,900
       Nigeria                                           9                   1                    1                    3                     2              2
       Panama                                          95                   96                   45                   53                    50          50
       Papua New Guinea                               820                  900                1,070                1,040                   875        1,000
       Paraguay                                        10                   10                    5                    5                     5              5
       Peru                                         4,200                2,660                3,830                3,150                  3,825       3,650
       Rwanda                                         400                  230                  340                  240                   310         325
       Sierra Leone                                    30                   25                   70                   70                    40          50
       Tanzania                                       735                  720                  875                  870                   700         800
       Thailand                                       200                   25                    4                    4                    10          25
       Togo                                           200                  250                  185                  440                   525         550
       Uganda                                       1,840                2,160                2,770                2,290                  1,900       2,100
       Venezuela                                       85                  120                    0                    0                     0              0
       Vietnam                                     18,740               15,600               15,430               18,425              17,550         19,000
       Yemen                                           30                   40                   35                   30                    25          25
       Zambia                                          55                   59                   39                   27                    10          15
       Zimbabwe                                        41                   27                   18                   17                     6          10
         Total                                     93,814               86,106               89,336               90,187              95,979         90,789


     Notes:
     Coffee marketing year for producer countries begins either in October (Colombia), April (Indonesia) or July (Brazil), as examples.
     Coffee marketing year for non-producer countries begins in October.
     For the United States, Canada and the EU-27, exports appear as zero in the database and the actual amount has been subtracted from
     imports to show net imports.


Foreign Agricultural Service/USDA
Office of Global Analysis                                                                                                                             June 2011
Table 03C Soluble Coffee Exports
                                                                     Thousand 60-Kilogram Bags

                                                                                                                                                      Jun
                                                 2006/07               2007/08               2008/09          2009/10              2010/11        2011/12

     Soluble Exports                                                                                                                                  none
       Brazil                                         3,020                 3,395                  2,991           3,120                  3,300       3,000
       Colombia                                         680                   720                   725              925                   700         750
       Cote d'Ivoire                                    365                   320                   375              250                   300         300
       Ecuador                                          650                   760                   680              680                   825         850
       El Salvador                                         2                    2                     2                2                     2              2
       India                                          1,059                 1,200                  1,000           1,350                  1,325       1,250
       Indonesia                                        400                   600                  1,075           1,325                  1,200       1,200
       Malaysia                                       1,150                 1,410                  1,600           1,964                  1,850       1,900
       Mexico                                           605                   700                   610              690                   650         725
       Nicaragua                                        150                   165                   160              156                    75         150
       Tanzania                                          10                    10                     5                5                     5              0
       Thailand                                         725                   750                   640              680                   797         735
       Vietnam                                           75                   115                   110              195                   275         300
         Total                                        8,891               10,147                   9,973          11,342              11,304         11,162


     Notes:
     A conversion factor of 2.6 was used to convert soluble coffee to the green bean equivalent.

     Coffee marketing year for producer countries begins either in October (Colombia), April (Indonesia) or July (Brazil), as examples.
     Coffee marketing year for non-producer countries begins in October.
     For the United States, Canada and the EU-27, exports appear as zero in the database and the actual amount has been subtracted from
     imports to show net imports.


Foreign Agricultural Service/USDA
Office of Global Analysis                                                                                                                             June 2011
Table 04A Total Coffee Imports
                                                                     Thousand 60-Kilogram Bags

                                                                                                                                                      Jun
                                                 2006/07               2007/08               2008/09          2009/10              2010/11        2011/12

     Imports                                                                                                                                          none
       Algeria                                        1,825                 2,025                   2,045          2,060                  2,050       2,025
       Argentina                                        510                   490                    480             500                   515         525
       Australia                                        900                   920                    950           1,040                  1,075       1,100
       Canada                                         1,950                 1,960                   1,940          2,010                  2,300       2,100
       China                                            300                   300                    320             425                   575         675
       Colombia                                         215                   142                    695             610                   790         600
       Croatia                                          330                   325                    300             300                   300         300
       Cuba                                             210                   230                    240             220                   225         225
       Ecuador                                          222                   274                    389             732                   763         817
       El Salvador                                      117                    96                    167             136                   137         142
       EU-27                                         46,530               45,760                   45,365         46,405              47,075         45,600
       Guatemala                                        175                   193                    223             225                   230         230
       Honduras                                          12                    14                     18              18                    23          15
       India                                            334                   490                    555             725                   550         500
       Indonesia                                        820                   100                    120             425                   150         200
       Japan                                          7,025                 6,860                   7,115          6,835                  7,650       6,825
       Korea, South                                   1,400                 1,550                   1,680          1,705                  2,000       1,900
       Malaysia                                       1,156                 1,200                   1,135          1,480                  1,420       1,370
       Mexico                                            49                   171                    114             245                   420         370
       Morocco                                          560                   570                    600             580                   510         500
       Norway                                           650                   590                    610             580                   725         600
       Philippines                                      600                   915                   1,340          1,920                  1,850       1,850
       Russia                                         4,410                 4,520                   3,455          4,075                  4,100       3,975
       Serbia                                           590                   590                    590             525                   500         500
       South Africa                                     430                   410                    330             400                   385         400
       Switzerland                                    1,490                 1,710                   1,800          1,950                  2,200       2,000
       Thailand                                         546                   530                    400             545                   675         600
       Turkey                                           230                   230                    260             275                   350         300
       United States                                 23,670               23,475                   23,400         22,205              24,400         23,750
       Venezuela                                         96                    77                     85             205                   335         350
       Vietnam                                          115                    88                     95              75                   105         150
         Total                                       97,470               96,809                   96,831         99,581             104,473        100,574


     Notes:
     A conversion factor of 2.6 was used to convert soluble coffee to the green bean equivalent.

     Coffee marketing year for producer countries begins either in October (Colombia), April (Indonesia) or July (Brazil), as examples.
     Coffee marketing year for non-producer countries begins in October.
     For the United States, Canada and the EU-27, exports appear as zero in the database and the actual amount has been subtracted from
     imports to show net imports.


Foreign Agricultural Service/USDA
Office of Global Analysis                                                                                                                             June 2011
Table 04B Green Coffee Bean Imports
                                                                     Thousand 60-Kilogram Bags

                                                                                                                                                         Jun
                                                 2006/07               2007/08               2008/09               2009/10                2010/11    2011/12

     Bean Imports                                                                                                                                        none
       Algeria                                        1,825                 2,025                 2,045                 2,060                2,050       2,025
       Argentina                                        510                   490                   480                   500                 515         525
       Australia                                        900                   920                   950                 1,040                1,075       1,100
       Canada                                         1,950                 1,960                 1,940                 2,010                2,300       2,100
       China                                            300                   300                   320                   425                 575         675
       Colombia                                         190                   110                   650                   570                 750         560
       Croatia                                          330                   325                   300                   300                 300         300
       EU-27                                         44,370                43,550                43,350               44,280                45,000      43,500
       Ecuador                                          130                   210                   310                   650                 700         750
       El Salvador                                        31                     1                     3                    0                   0              0
       India                                            334                   490                   555                   725                 550         500
       Indonesia                                        820                   100                   120                   425                 150         200
       Japan                                          6,200                 6,150                 6,375                 6,160                7,000       6,200
       Korea, South                                   1,400                 1,550                 1,680                 1,705                2,000       1,900
       Malaysia                                         730                   660                   650                   960                 850         850
       Mexico                                             21                     1                     4                   90                 250         200
       Morocco                                          560                   570                   600                   580                 510         500
       Norway                                           650                   590                   610                   580                 725         600
       Philippines                                      225                   390                   405                   420                 450         400
       Russia                                           960                   970                 1,240                 1,430                1,450       1,475
       Serbia                                           590                   590                   590                   525                 500         500
       South Africa                                     430                   410                   330                   400                 385         400
       Switzerland                                    1,490                 1,710                 1,800                 1,950                2,200       2,000
       Thailand                                            6                  200                   130                   205                 225         200
       Turkey                                           230                   230                   260                   275                 350         300
       United States                                 22,110                21,775                21,660               20,250                22,500      21,800
       Vietnam                                            79                   65                     70                   50                  80         125
         Total                                       87,424                86,396                87,502               88,870                93,850      90,075


     Notes:

     Coffee marketing year for producer countries begins either in October (Colombia), April (Indonesia) or July (Brazil), as examples.
     Coffee marketing year for non-producer countries begins in October.

     Imports for the United States, Canada and the EU-27 are net imports after subtracting exports.


Foreign Agricultural Service/USDA
Office of Global Analysis                                                                                                                                June 2011
Table 04C Soluble Coffee Imports
                                                                     Thousand 60-Kilogram Bags

                                                                                                                                                      Jun
                                                 2006/07               2007/08               2008/09          2009/10              2010/11        2011/12

     Soluble Imports                                                                                                                                  none
       Ecuador                                           91                    64                    77               79                    60          65
       El Salvador                                       72                    80                   150              125                   125         130
       EU-27                                          2,160                 2,210                  2,015           2,125                  2,075       2,100
       Guatemala                                        125                   140                   160              165                   170         170
       Honduras                                            6                    7                    10               10                    15          15
       Japan                                            825                   710                   740              675                   650         625
       Malaysia                                         406                   520                   465              500                   550         500
       Mexico                                              0                  150                    95              135                   150         150
       Philippines                                      375                   525                   935            1,500                  1,400       1,450
       Russia                                         3,450                 3,550                  2,215           2,645                  2,650       2,500
       United States                                  1,560                 1,700                  1,740           1,955                  1,900       1,950
       Vietnam                                           35                    22                    25               25                    25          25
         Total                                        9,737               10,081                   8,982          10,389              10,295         10,180


     Notes:
     A conversion factor of 2.6 was used to convert soluble coffee to the green bean equivalent.

     Coffee marketing year for producer countries begins either in October (Colombia), April (Indonesia) or July (Brazil), as examples.
     Coffee marketing year for non-producer countries begins in October.
     For the United States, Canada and the EU-27, exports appear as zero in the database and the actual amount has been subtracted from
     imports to show net imports.


Foreign Agricultural Service/USDA
Office of Global Analysis                                                                                                                             June 2011
Coffee USDA junho/11

More Related Content

Similar to Coffee USDA junho/11

Geom1-2hour4
Geom1-2hour4Geom1-2hour4
Geom1-2hour4kquarton
 
2.3 angles in triangles
2.3   angles in triangles2.3   angles in triangles
2.3 angles in trianglesGary Ball
 
When supply met_demand
When supply met_demandWhen supply met_demand
When supply met_demandVictor Barros
 
Cement Report
Cement ReportCement Report
Cement Reportutk01
 
Corn cattle-confusion-nov2012
Corn cattle-confusion-nov2012Corn cattle-confusion-nov2012
Corn cattle-confusion-nov2012osborne51
 
Corn cattle-confusion-nov2012
Corn cattle-confusion-nov2012Corn cattle-confusion-nov2012
Corn cattle-confusion-nov2012osborne51
 
John Loos on the Property Outlook
John Loos on the Property OutlookJohn Loos on the Property Outlook
John Loos on the Property Outlookmoneyweb
 

Similar to Coffee USDA junho/11 (8)

Geom1-2hour4
Geom1-2hour4Geom1-2hour4
Geom1-2hour4
 
2.3 angles in triangles
2.3   angles in triangles2.3   angles in triangles
2.3 angles in triangles
 
When supply met_demand
When supply met_demandWhen supply met_demand
When supply met_demand
 
Cement Report
Cement ReportCement Report
Cement Report
 
S65
S65S65
S65
 
Corn cattle-confusion-nov2012
Corn cattle-confusion-nov2012Corn cattle-confusion-nov2012
Corn cattle-confusion-nov2012
 
Corn cattle-confusion-nov2012
Corn cattle-confusion-nov2012Corn cattle-confusion-nov2012
Corn cattle-confusion-nov2012
 
John Loos on the Property Outlook
John Loos on the Property OutlookJohn Loos on the Property Outlook
John Loos on the Property Outlook
 

More from nataliafernandes

Procafé Aviso fitossanitário - jul12 - Cerrado
Procafé Aviso fitossanitário - jul12 - CerradoProcafé Aviso fitossanitário - jul12 - Cerrado
Procafé Aviso fitossanitário - jul12 - Cerradonataliafernandes
 
Procafé jul12-AvisoFitossanitario-Sul de Minas
Procafé jul12-AvisoFitossanitario-Sul de MinasProcafé jul12-AvisoFitossanitario-Sul de Minas
Procafé jul12-AvisoFitossanitario-Sul de Minasnataliafernandes
 
Levantamento safra café Conab - maio 2011
Levantamento safra café Conab - maio 2011Levantamento safra café Conab - maio 2011
Levantamento safra café Conab - maio 2011nataliafernandes
 
Cecafe resumo das exportacoes de cafe abril 2011[1]
Cecafe   resumo das exportacoes de cafe abril 2011[1]Cecafe   resumo das exportacoes de cafe abril 2011[1]
Cecafe resumo das exportacoes de cafe abril 2011[1]nataliafernandes
 
Diagnostico e propostas_cafe_da_bahia
Diagnostico e propostas_cafe_da_bahiaDiagnostico e propostas_cafe_da_bahia
Diagnostico e propostas_cafe_da_bahianataliafernandes
 
Cecafe resumo das exportacoes de cafe março 2011
Cecafe   resumo das exportacoes de cafe março 2011Cecafe   resumo das exportacoes de cafe março 2011
Cecafe resumo das exportacoes de cafe março 2011nataliafernandes
 
8 simpósio estadual 2011 ES
8 simpósio estadual 2011 ES8 simpósio estadual 2011 ES
8 simpósio estadual 2011 ESnataliafernandes
 
Cecafe -resumo_das_exportacoes_de_cafe_janeiro_2011_(3)[1]
Cecafe  -resumo_das_exportacoes_de_cafe_janeiro_2011_(3)[1]Cecafe  -resumo_das_exportacoes_de_cafe_janeiro_2011_(3)[1]
Cecafe -resumo_das_exportacoes_de_cafe_janeiro_2011_(3)[1]nataliafernandes
 
Votos CNM venda futura café 2011
Votos CNM venda futura café 2011Votos CNM venda futura café 2011
Votos CNM venda futura café 2011nataliafernandes
 
Folder encontro montanha 2010 (2)
Folder encontro montanha 2010 (2)Folder encontro montanha 2010 (2)
Folder encontro montanha 2010 (2)nataliafernandes
 

More from nataliafernandes (20)

Procafé Aviso fitossanitário - jul12 - Cerrado
Procafé Aviso fitossanitário - jul12 - CerradoProcafé Aviso fitossanitário - jul12 - Cerrado
Procafé Aviso fitossanitário - jul12 - Cerrado
 
Procafé jul12-AvisoFitossanitario-Sul de Minas
Procafé jul12-AvisoFitossanitario-Sul de MinasProcafé jul12-AvisoFitossanitario-Sul de Minas
Procafé jul12-AvisoFitossanitario-Sul de Minas
 
Folder final
Folder finalFolder final
Folder final
 
Cafe manejo cultura
Cafe manejo culturaCafe manejo cultura
Cafe manejo cultura
 
Cafe plantas daninhas
Cafe plantas daninhasCafe plantas daninhas
Cafe plantas daninhas
 
Cafe nutricao
Cafe nutricaoCafe nutricao
Cafe nutricao
 
Cafe manejo solo_agua
Cafe manejo solo_aguaCafe manejo solo_agua
Cafe manejo solo_agua
 
Cafe boas praticas
Cafe boas praticasCafe boas praticas
Cafe boas praticas
 
Levantamento safra café Conab - maio 2011
Levantamento safra café Conab - maio 2011Levantamento safra café Conab - maio 2011
Levantamento safra café Conab - maio 2011
 
Cecafe resumo das exportacoes de cafe abril 2011[1]
Cecafe   resumo das exportacoes de cafe abril 2011[1]Cecafe   resumo das exportacoes de cafe abril 2011[1]
Cecafe resumo das exportacoes de cafe abril 2011[1]
 
Resolução cmn 3966
Resolução cmn 3966Resolução cmn 3966
Resolução cmn 3966
 
Diagnostico e propostas_cafe_da_bahia
Diagnostico e propostas_cafe_da_bahiaDiagnostico e propostas_cafe_da_bahia
Diagnostico e propostas_cafe_da_bahia
 
Cna 2011 vpb
Cna 2011 vpbCna 2011 vpb
Cna 2011 vpb
 
Cna 2011
Cna 2011Cna 2011
Cna 2011
 
Cecafe resumo das exportacoes de cafe março 2011
Cecafe   resumo das exportacoes de cafe março 2011Cecafe   resumo das exportacoes de cafe março 2011
Cecafe resumo das exportacoes de cafe março 2011
 
8 simpósio estadual 2011 ES
8 simpósio estadual 2011 ES8 simpósio estadual 2011 ES
8 simpósio estadual 2011 ES
 
Coletade folhas
Coletade folhasColetade folhas
Coletade folhas
 
Cecafe -resumo_das_exportacoes_de_cafe_janeiro_2011_(3)[1]
Cecafe  -resumo_das_exportacoes_de_cafe_janeiro_2011_(3)[1]Cecafe  -resumo_das_exportacoes_de_cafe_janeiro_2011_(3)[1]
Cecafe -resumo_das_exportacoes_de_cafe_janeiro_2011_(3)[1]
 
Votos CNM venda futura café 2011
Votos CNM venda futura café 2011Votos CNM venda futura café 2011
Votos CNM venda futura café 2011
 
Folder encontro montanha 2010 (2)
Folder encontro montanha 2010 (2)Folder encontro montanha 2010 (2)
Folder encontro montanha 2010 (2)
 

Recently uploaded

Vector Search -An Introduction in Oracle Database 23ai.pptx
Vector Search -An Introduction in Oracle Database 23ai.pptxVector Search -An Introduction in Oracle Database 23ai.pptx
Vector Search -An Introduction in Oracle Database 23ai.pptxRemote DBA Services
 
Repurposing LNG terminals for Hydrogen Ammonia: Feasibility and Cost Saving
Repurposing LNG terminals for Hydrogen Ammonia: Feasibility and Cost SavingRepurposing LNG terminals for Hydrogen Ammonia: Feasibility and Cost Saving
Repurposing LNG terminals for Hydrogen Ammonia: Feasibility and Cost SavingEdi Saputra
 
Connector Corner: Accelerate revenue generation using UiPath API-centric busi...
Connector Corner: Accelerate revenue generation using UiPath API-centric busi...Connector Corner: Accelerate revenue generation using UiPath API-centric busi...
Connector Corner: Accelerate revenue generation using UiPath API-centric busi...DianaGray10
 
Elevate Developer Efficiency & build GenAI Application with Amazon Q​
Elevate Developer Efficiency & build GenAI Application with Amazon Q​Elevate Developer Efficiency & build GenAI Application with Amazon Q​
Elevate Developer Efficiency & build GenAI Application with Amazon Q​Bhuvaneswari Subramani
 
Choreo: Empowering the Future of Enterprise Software Engineering
Choreo: Empowering the Future of Enterprise Software EngineeringChoreo: Empowering the Future of Enterprise Software Engineering
Choreo: Empowering the Future of Enterprise Software EngineeringWSO2
 
JohnPollard-hybrid-app-RailsConf2024.pptx
JohnPollard-hybrid-app-RailsConf2024.pptxJohnPollard-hybrid-app-RailsConf2024.pptx
JohnPollard-hybrid-app-RailsConf2024.pptxJohnPollard37
 
ChatGPT and Beyond - Elevating DevOps Productivity
ChatGPT and Beyond - Elevating DevOps ProductivityChatGPT and Beyond - Elevating DevOps Productivity
ChatGPT and Beyond - Elevating DevOps ProductivityVictorSzoltysek
 
WSO2 Micro Integrator for Enterprise Integration in a Decentralized, Microser...
WSO2 Micro Integrator for Enterprise Integration in a Decentralized, Microser...WSO2 Micro Integrator for Enterprise Integration in a Decentralized, Microser...
WSO2 Micro Integrator for Enterprise Integration in a Decentralized, Microser...WSO2
 
Stronger Together: Developing an Organizational Strategy for Accessible Desig...
Stronger Together: Developing an Organizational Strategy for Accessible Desig...Stronger Together: Developing an Organizational Strategy for Accessible Desig...
Stronger Together: Developing an Organizational Strategy for Accessible Desig...caitlingebhard1
 
Polkadot JAM Slides - Token2049 - By Dr. Gavin Wood
Polkadot JAM Slides - Token2049 - By Dr. Gavin WoodPolkadot JAM Slides - Token2049 - By Dr. Gavin Wood
Polkadot JAM Slides - Token2049 - By Dr. Gavin WoodJuan lago vázquez
 
Exploring Multimodal Embeddings with Milvus
Exploring Multimodal Embeddings with MilvusExploring Multimodal Embeddings with Milvus
Exploring Multimodal Embeddings with MilvusZilliz
 
API Governance and Monetization - The evolution of API governance
API Governance and Monetization -  The evolution of API governanceAPI Governance and Monetization -  The evolution of API governance
API Governance and Monetization - The evolution of API governanceWSO2
 
Platformless Horizons for Digital Adaptability
Platformless Horizons for Digital AdaptabilityPlatformless Horizons for Digital Adaptability
Platformless Horizons for Digital AdaptabilityWSO2
 
Architecting Cloud Native Applications
Architecting Cloud Native ApplicationsArchitecting Cloud Native Applications
Architecting Cloud Native ApplicationsWSO2
 
[BuildWithAI] Introduction to Gemini.pdf
[BuildWithAI] Introduction to Gemini.pdf[BuildWithAI] Introduction to Gemini.pdf
[BuildWithAI] Introduction to Gemini.pdfSandro Moreira
 
"I see eyes in my soup": How Delivery Hero implemented the safety system for ...
"I see eyes in my soup": How Delivery Hero implemented the safety system for ..."I see eyes in my soup": How Delivery Hero implemented the safety system for ...
"I see eyes in my soup": How Delivery Hero implemented the safety system for ...Zilliz
 
The Zero-ETL Approach: Enhancing Data Agility and Insight
The Zero-ETL Approach: Enhancing Data Agility and InsightThe Zero-ETL Approach: Enhancing Data Agility and Insight
The Zero-ETL Approach: Enhancing Data Agility and InsightSafe Software
 
Cloud Frontiers: A Deep Dive into Serverless Spatial Data and FME
Cloud Frontiers:  A Deep Dive into Serverless Spatial Data and FMECloud Frontiers:  A Deep Dive into Serverless Spatial Data and FME
Cloud Frontiers: A Deep Dive into Serverless Spatial Data and FMESafe Software
 
MINDCTI Revenue Release Quarter One 2024
MINDCTI Revenue Release Quarter One 2024MINDCTI Revenue Release Quarter One 2024
MINDCTI Revenue Release Quarter One 2024MIND CTI
 

Recently uploaded (20)

Vector Search -An Introduction in Oracle Database 23ai.pptx
Vector Search -An Introduction in Oracle Database 23ai.pptxVector Search -An Introduction in Oracle Database 23ai.pptx
Vector Search -An Introduction in Oracle Database 23ai.pptx
 
Repurposing LNG terminals for Hydrogen Ammonia: Feasibility and Cost Saving
Repurposing LNG terminals for Hydrogen Ammonia: Feasibility and Cost SavingRepurposing LNG terminals for Hydrogen Ammonia: Feasibility and Cost Saving
Repurposing LNG terminals for Hydrogen Ammonia: Feasibility and Cost Saving
 
Connector Corner: Accelerate revenue generation using UiPath API-centric busi...
Connector Corner: Accelerate revenue generation using UiPath API-centric busi...Connector Corner: Accelerate revenue generation using UiPath API-centric busi...
Connector Corner: Accelerate revenue generation using UiPath API-centric busi...
 
Elevate Developer Efficiency & build GenAI Application with Amazon Q​
Elevate Developer Efficiency & build GenAI Application with Amazon Q​Elevate Developer Efficiency & build GenAI Application with Amazon Q​
Elevate Developer Efficiency & build GenAI Application with Amazon Q​
 
Choreo: Empowering the Future of Enterprise Software Engineering
Choreo: Empowering the Future of Enterprise Software EngineeringChoreo: Empowering the Future of Enterprise Software Engineering
Choreo: Empowering the Future of Enterprise Software Engineering
 
JohnPollard-hybrid-app-RailsConf2024.pptx
JohnPollard-hybrid-app-RailsConf2024.pptxJohnPollard-hybrid-app-RailsConf2024.pptx
JohnPollard-hybrid-app-RailsConf2024.pptx
 
ChatGPT and Beyond - Elevating DevOps Productivity
ChatGPT and Beyond - Elevating DevOps ProductivityChatGPT and Beyond - Elevating DevOps Productivity
ChatGPT and Beyond - Elevating DevOps Productivity
 
WSO2 Micro Integrator for Enterprise Integration in a Decentralized, Microser...
WSO2 Micro Integrator for Enterprise Integration in a Decentralized, Microser...WSO2 Micro Integrator for Enterprise Integration in a Decentralized, Microser...
WSO2 Micro Integrator for Enterprise Integration in a Decentralized, Microser...
 
Stronger Together: Developing an Organizational Strategy for Accessible Desig...
Stronger Together: Developing an Organizational Strategy for Accessible Desig...Stronger Together: Developing an Organizational Strategy for Accessible Desig...
Stronger Together: Developing an Organizational Strategy for Accessible Desig...
 
Polkadot JAM Slides - Token2049 - By Dr. Gavin Wood
Polkadot JAM Slides - Token2049 - By Dr. Gavin WoodPolkadot JAM Slides - Token2049 - By Dr. Gavin Wood
Polkadot JAM Slides - Token2049 - By Dr. Gavin Wood
 
Exploring Multimodal Embeddings with Milvus
Exploring Multimodal Embeddings with MilvusExploring Multimodal Embeddings with Milvus
Exploring Multimodal Embeddings with Milvus
 
API Governance and Monetization - The evolution of API governance
API Governance and Monetization -  The evolution of API governanceAPI Governance and Monetization -  The evolution of API governance
API Governance and Monetization - The evolution of API governance
 
Platformless Horizons for Digital Adaptability
Platformless Horizons for Digital AdaptabilityPlatformless Horizons for Digital Adaptability
Platformless Horizons for Digital Adaptability
 
Architecting Cloud Native Applications
Architecting Cloud Native ApplicationsArchitecting Cloud Native Applications
Architecting Cloud Native Applications
 
[BuildWithAI] Introduction to Gemini.pdf
[BuildWithAI] Introduction to Gemini.pdf[BuildWithAI] Introduction to Gemini.pdf
[BuildWithAI] Introduction to Gemini.pdf
 
Understanding the FAA Part 107 License ..
Understanding the FAA Part 107 License ..Understanding the FAA Part 107 License ..
Understanding the FAA Part 107 License ..
 
"I see eyes in my soup": How Delivery Hero implemented the safety system for ...
"I see eyes in my soup": How Delivery Hero implemented the safety system for ..."I see eyes in my soup": How Delivery Hero implemented the safety system for ...
"I see eyes in my soup": How Delivery Hero implemented the safety system for ...
 
The Zero-ETL Approach: Enhancing Data Agility and Insight
The Zero-ETL Approach: Enhancing Data Agility and InsightThe Zero-ETL Approach: Enhancing Data Agility and Insight
The Zero-ETL Approach: Enhancing Data Agility and Insight
 
Cloud Frontiers: A Deep Dive into Serverless Spatial Data and FME
Cloud Frontiers:  A Deep Dive into Serverless Spatial Data and FMECloud Frontiers:  A Deep Dive into Serverless Spatial Data and FME
Cloud Frontiers: A Deep Dive into Serverless Spatial Data and FME
 
MINDCTI Revenue Release Quarter One 2024
MINDCTI Revenue Release Quarter One 2024MINDCTI Revenue Release Quarter One 2024
MINDCTI Revenue Release Quarter One 2024
 

Coffee USDA junho/11

  • 1. United States Department of Agriculture Foreign Agricultural Service Coffee: Circular Series June 2011 World Markets and Trade World Coffee Production to Again Outpace Consumption, but . . . Prices Higher as Stocks Remain Tight 140 50 250 May 2011 135 230 45 210 130 40 190 Million 60 Kilogram Bags Million 60 Kilogram Bags 125 170 U.S. Cents per Pound 35 120 150 30 115 130 25 110 110 90 105 20 70 100 15 50 02/03 03/04 04/05 05/06 06/07 07/08 08/09 09/10 10/11 11/12 F 02/03 03/04 04/05 05/06 06/07 07/08 08/09 09/10 10/11 11/12 F Production Consumption Ending Stocks Price International Coffee Organization Composite Price, May Average World coffee production in 2011/12 is forecast to outpace consumption for a second consecutive year, although ending stocks are expected to remain tight. Production is forecast to decline a moderate 2.9 million bags, whereas previous down years have declined as much as 16 million bags. However, stocks are forecast to remain at diminished levels, leaving little cushion should there be a supply problem. In response to the multi-year stocks drawdown, prices have spiked. _______________________________________________________________________________________________________ Approved by the World Agricultural Outlook Board/USDA
  • 2. Decade in Review In the last decade, world production has Brazil and Vietnam Lead Production Growth expanded by 23.5 million bags (21 percent), with Brazil and Vietnam 140 accounting for virtually all of the gain. Vietnam The other 50 producing countries have 120 been mostly flat, with growth in some Million 60 Kilogram Bags countries largely being offset by losses 100 in others. For example, Nicaragua, Honduras, Peru and Indonesia Brazil experienced growth in excess of 1 80 million bags during this period, but declines of similar caliber occurred in 60 Cote d’Ivoire and Colombia. Production in just the last few years has fallen in certain countries because of 40 Other pests, diseases and/or poor weather. Also, output has been affected by tree 20 renovation programs recently implemented in several countries. - Arabica and Robusta production have 2001/02 2011/12 F increased by nearly equal amounts in the last decade, expanding 11.9 million and 11.6 million bags, respectively. As a Brazil Dominates Arabica Vietnam and Brazil Account result, the ratio has not changed Expansion, While . . . For Nearly All Robusta Growth 90 60 significantly from 60 percent Arabica to 40 percent Robusta. The vast majority 80 of the Arabica growth has come from 50 Brazil, with gains in Honduras, Peru and 70 Brazil Nicaragua partially offset by losses in Brazil Million 60 Kilogram Bags Million 60 Kilogram Bags Colombia, India and Costa Rica. Nearly 60 40 two-thirds of the Robusta gain has been from Vietnam and one-third from 50 Brazil. 30 Vietnam 40 Stocks have been cut nearly in half in the last decade and their location has 30 20 shifted. Initially, top consuming Other countries were balanced with top 20 10 Other producing countries at about 40 percent. The United States, Europe and Japan are 10 forecast to account for 70 percent with - - Brazil, Vietnam and Colombia holding just 25 percent. 2001/02 2011/12 F 2001/02 2011/12 F Foreign Agricultural Service/USDA Office of Global Analysis June 2011
  • 3. 2011/12 Production Forecast World coffee production for 2011/12 is forecast at 135.0 million bags, down just 2.9 million as Brazil enters the off-year of the biennial Arabica production cycle. Record Robusta crops in Brazil and Vietnam, combined with Colombia’s continued recovery, are expected to soften the decline. Brazil’s Robusta harvest is forecast to jump 1.8 million bags to a record 14.5 million as favorable weather conditions and good crop management benefited fruit setting and development in the State of Espirito Santo, where nearly 75 percent is grown. Production during the previous two Record Robusta Crop Forecast for Brazil 15 seasons suffered from weather related problems during the blossoming period, 12 making the year-over-year growth all the Million 60 Kilogram Bags more dramatic. The Arabica crop is forecast to drop 7.1 million bags to 34.7 9 million during the off-year of the biennial cycle, a normal amount as 6 compared to recent periods. Strong blossoming, favorable weather and good 3 crop management supported ideal cherry setting and development. As a result, 0 total production is forecast to fall 5.3 2007/08 2008/09 2009/10 2010/11 2011/12 F million bags to 49.2 million. Espirito Santo Other Vietnam is forecast to rise 1.9 million bags to a record 20.6 million as the rainy season arrived on time, resulting in a good flowering and fruit setting. High prices motivated many growers to irrigate in order to boost yields, while higher incomes encouraged some farmers to begin replacing low-yielding trees. Colombia is forecast to recover 1 million bags to 10.5 million. High prices combined with government support encouraged many growers to apply more fertilizer, pesticides and fungicides in order to improve yields. However, the crop is still short of the five-year average of 11.8 million produced prior to shortfalls caused by coffee rust and the coffee cherry borer. The ongoing tree renovation program has also cut into yields. Indonesia is forecast down 1.4 million bags to 7.9 million as higher-than-average rainfall during flowering damaged the bloom in many areas. India is forecast to slip 300,000 bags to 4.8 million mainly because Robusta areas experienced uneven rainfall during the bloom period, which is expected to lower yields. Mexico is forecast at 3.7 million bags, unchanged from last year’s low production, as dry conditions in certain areas adversely affected the bloom. For further information, please contact Tony Halstead at 202-720-4620, or send an email to Tony.Halstead@fas.usda.gov Users can find the release schedule and generate the full USDA Production, Supply and Distribution (PSD) dataset for reporting countries by accessing the following link: http://www.fas.usda.gov/psdonline/psdHome.aspx Foreign Agricultural Service/USDA Office of Global Analysis June 2011
  • 4. Coffee: ICO Average Composite Indicator Price Jan. Feb. Mar. Apr. May June July Aug. Sept. Oct. Nov. Dec. --------Cents per pound-------- ICO Composite: 2001 49.19 49.39 48.52 47.31 49.38 46.54 43.07 42.77 41.17 42.21 44.24 43.36 2002 43.46 44.30 49.49 50.19 47.30 45.56 44.70 42.79 47.96 50.79 54.69 51.68 2003 54.04 54.07 49.61 51.87 53.19 48.90 50.89 52.22 54.10 51.72 49.81 52.44 2004 58.69 59.87 60.80 58.80 59.91 64.28 58.46 56.98 61.47 61.10 67.74 77.72 2005 79.35 89.40 101.44 98.20 99.78 96.29 88.48 85.31 78.79 82.55 85.93 86.85 2006 101.20 97.39 92.76 94.20 90.00 86.04 88.57 95.78 95.98 95.53 103.48 108.01 2007 105.81 104.18 100.09 99.30 100.09 107.03 106.20 107.98 113.20 115.71 114.43 118.16 2008 122.33 138.82 136.17 126.55 126.76 130.51 132.78 131.14 126.69 108.31 107.88 103.07 2009 108.39 107.60 105.87 111.61 123.05 119.05 112.90 117.45 116.40 121.09 119.67 124.96 2010 126.85 123.37 125.30 126.89 128.10 142.20 153.41 157.46 163.61 161.56 173.90 184.26 2011 197.35 216.03 224.33 231.24 227.97 Source: International Coffee Organization (ICO). http://www.ico.org/historical/2000+/PDF/HIST-PRICES.pdf 1/ Average through the latest month. Foreign Agricultural Service/USDA June 2011 Office of Global Analysis
  • 5. Table 01 Coffee World Production, Supply and Distribution Thousand 60-Kilogram Bags Beginning Arabica Robusta Production Imports Total Supply Exports Domestic Ending Total Exportable Stocks Production Production Consumption Stocks Distribution Production Coffee, Green 1977/78 25,667 54,430 15,920 70,724 627 97,018 48,755 18,828 29,435 97,018 52,233 1978/79 29,435 59,847 18,770 79,018 678 109,131 64,612 19,462 25,057 109,131 60,035 1979/80 25,057 62,302 19,207 81,906 653 107,616 62,130 19,963 25,523 107,616 62,283 1980/81 25,523 63,154 22,584 86,174 675 112,372 60,955 20,438 30,979 112,372 66,007 1981/82 30,979 75,132 22,396 98,023 755 129,757 65,359 20,556 43,842 129,757 77,771 1982/83 43,842 59,258 22,196 81,904 733 126,479 66,059 20,221 40,199 126,479 61,916 1983/84 40,199 70,459 17,905 88,801 606 129,606 68,191 20,577 40,838 129,606 68,490 1984/85 40,838 65,302 24,591 90,362 456 131,656 72,322 21,968 37,366 131,656 68,591 1985/86 37,366 71,299 23,998 95,750 397 133,513 70,478 21,220 41,815 133,513 74,777 1986/87 41,815 52,812 26,121 79,394 262 121,471 66,982 21,202 33,287 121,471 58,416 1987/88 33,287 78,985 23,810 103,170 296 136,753 67,504 21,075 48,174 136,753 82,310 1988/89 48,174 64,934 28,901 94,165 415 142,754 71,371 21,190 50,193 142,754 73,168 1989/90 50,193 69,118 27,542 96,958 258 147,409 83,402 20,995 43,012 147,409 76,157 1990/91 43,012 72,143 27,768 100,181 331 143,524 76,163 22,265 45,096 143,524 78,131 1991/92 45,096 73,980 29,809 104,064 291 149,451 80,887 22,266 46,298 149,451 81,950 1992/93 46,298 65,234 27,455 92,959 713 139,970 77,869 21,579 40,522 139,970 71,722 1993/94 40,522 65,052 27,146 92,406 585 133,513 76,284 22,928 34,301 133,513 69,764 1994/95 34,301 68,809 28,033 97,042 1,070 132,413 68,672 22,526 41,215 132,413 74,978 1995/96 41,215 61,394 27,372 88,946 1,079 131,240 74,103 24,049 33,088 131,240 65,393 1996/97 33,088 66,452 37,236 103,786 1,091 137,965 84,509 24,361 29,095 137,965 79,780 1997/98 29,095 64,712 32,940 97,687 1,220 128,002 77,939 25,180 24,883 128,002 72,986 1998/99 24,883 74,859 34,060 108,953 1,435 135,271 85,133 25,738 24,400 135,271 83,533 1999/00 24,400 73,200 40,323 113,553 1,303 139,256 92,733 25,648 20,875 139,256 88,064 2000/01 20,875 70,486 47,000 117,521 1,478 139,874 90,937 26,319 22,618 139,874 91,357 2001/02 22,618 68,199 43,289 111,518 6,974 141,110 88,292 27,611 25,207 141,110 84,157 2002/03 39,422 84,953 42,121 127,102 90,663 257,187 94,108 115,720 47,359 257,187 99,454 2003/04 47,359 66,540 44,185 110,750 90,698 248,807 90,071 119,391 39,345 248,807 80,601 2004/05 39,345 77,994 43,243 121,262 93,011 253,618 93,195 120,149 40,274 253,618 89,607 2005/06 40,274 69,802 46,894 116,721 92,195 249,190 92,829 125,107 31,254 249,190 84,653 2006/07 31,254 82,227 49,567 131,819 97,470 260,543 102,839 124,107 33,597 260,543 99,197 2007/08 33,597 73,145 48,583 121,753 96,809 252,159 96,479 127,033 28,647 252,159 88,620 2008/09 28,647 82,886 50,492 133,403 96,831 258,881 99,476 123,742 35,663 258,881 99,179 2009/10 35,663 74,379 52,377 126,781 99,581 262,025 101,736 135,871 24,418 262,025 91,901 2010/11 24,418 85,787 52,096 137,908 104,473 266,799 107,455 132,497 26,847 266,799 101,503 2011/12 26,847 80,125 54,896 135,046 100,574 262,467 102,123 133,957 26,387 262,467 98,112 Note: Prior to 2002/03, the database does not include import, consumption or stocks data for non-producing countries such as the United States, EU-27 and Japan. Foreign Agricultural Service/USDA Office of Global Analysis June 2011
  • 6. Table 01A Coffee Production, Consumption and Ending Stocks Thousand 60-Kilogram Bags Jun 2006/07 2007/08 2008/09 2009/10 2010/11 2011/12 Production none Brazil 46,700 39,100 53,300 44,800 54,500 49,200 Vietnam 19,500 18,000 16,980 18,500 18,725 20,600 Colombia 12,164 12,515 8,664 8,100 9,500 10,500 Indonesia 7,500 7,600 9,300 10,500 9,325 7,885 India 4,665 4,660 4,375 4,850 5,100 4,800 Ethiopia 4,036 3,906 3,650 4,000 4,400 4,500 Honduras 3,460 3,642 3,225 3,550 4,000 4,100 Guatemala 4,050 4,110 3,980 4,010 3,910 3,910 Peru 4,400 2,800 4,000 3,300 4,000 3,800 Mexico 4,500 4,350 4,550 4,150 3,700 3,700 Other 20,844 21,070 21,379 21,021 20,748 22,051 Total 131,819 121,753 133,403 126,781 137,908 135,046 Domestic Consumption none EU-27 44,555 45,885 41,815 51,880 44,925 46,600 United States 23,324 23,726 23,800 23,395 23,952 24,150 Brazil 16,720 17,390 18,030 18,760 19,500 20,100 Japan 7,315 7,060 7,025 7,035 7,250 7,125 Russia 4,410 4,520 3,455 4,075 4,100 3,975 Philippines 1,335 1,380 1,620 2,220 2,314 2,255 Canada 1,950 1,960 1,940 2,010 2,300 2,100 Algeria 1,825 2,025 2,045 2,060 2,050 2,025 Switzerland 1,490 1,710 1,800 1,950 2,200 2,000 Mexico 1,750 1,800 1,950 1,900 2,000 1,950 Other 19,433 19,577 20,262 20,586 21,906 21,677 Total 124,107 127,033 123,742 135,871 132,497 133,957 Ending Stocks none EU-27 12,900 12,775 16,325 10,850 13,000 12,000 Brazil 8,361 2,781 6,576 2,836 3,836 4,936 United States 5,700 5,600 5,333 4,250 4,800 4,500 Japan 2,160 1,960 2,050 1,850 2,250 1,950 Vietnam 244 1,747 2,307 1,140 895 970 Venezuela 480 370 330 380 315 340 Colombia 890 885 209 284 224 324 Switzerland 200 200 200 200 200 200 Norway 125 125 125 125 125 125 Cote d'Ivoire 202 130 128 173 123 123 Other 2,335 2,074 2,080 2,330 1,079 919 Total 33,597 28,647 35,663 24,418 26,847 26,387 Notes: Coffee marketing year for producer countries begins either in October (Colombia), April (Indonesia) or July (Brazil), as examples. Coffee marketing year for non-producer countries begins in October. Foreign Agricultural Service/USDA Office of Global Analysis June 2011
  • 7. Table 01B Green Coffee Bean Exports and Imports Thousand 60-Kilogram Bags Jun 2006/07 2007/08 2008/09 2009/10 2010/11 2011/12 Bean Exports none Brazil 26,185 23,770 28,396 26,580 30,630 24,930 Vietnam 18,740 15,600 15,430 18,425 17,550 19,000 Colombia 10,460 10,770 8,160 6,445 8,400 9,000 Indonesia 6,000 5,510 6,625 7,425 7,050 5,150 Guatemala 3,980 3,890 3,783 3,860 3,940 3,925 Honduras 3,370 3,440 3,050 3,200 4,000 3,925 Peru 4,200 2,660 3,830 3,150 3,825 3,650 Ethiopia 2,225 2,110 1,850 2,325 2,550 2,640 India 2,550 2,620 2,120 2,760 2,775 2,500 Uganda 1,840 2,160 2,770 2,290 1,900 2,100 Nicaragua 1,160 1,580 1,425 1,650 1,850 1,900 Cote d'Ivoire 1,710 1,550 1,180 1,755 1,550 1,700 El Salvador 1,320 1,580 1,506 1,215 1,575 1,450 Mexico 2,260 1,910 2,125 1,790 1,500 1,400 Costa Rica 1,582 1,588 1,410 1,200 1,350 1,390 Other 6,232 5,368 5,676 6,117 5,534 6,129 Total 93,814 86,106 89,336 90,187 95,979 90,789 Bean Imports none EU-27 44,370 43,550 43,350 44,280 45,000 43,500 United States 22,110 21,775 21,660 20,250 22,500 21,800 Japan 6,200 6,150 6,375 6,160 7,000 6,200 Canada 1,950 1,960 1,940 2,010 2,300 2,100 Algeria 1,825 2,025 2,045 2,060 2,050 2,025 Switzerland 1,490 1,710 1,800 1,950 2,200 2,000 Korea, South 1,400 1,550 1,680 1,705 2,000 1,900 Russia 960 970 1,240 1,430 1,450 1,475 Australia 900 920 950 1,040 1,075 1,100 Malaysia 730 660 650 960 850 850 Ecuador 130 210 310 650 700 750 China 300 300 320 425 575 675 Norway 650 590 610 580 725 600 Colombia 190 110 650 570 750 560 Argentina 510 490 480 500 515 525 Other 3,709 3,426 3,442 4,300 4,160 4,015 Total 87,424 86,396 87,502 88,870 93,850 90,075 Coffee marketing year for producer countries begins either in October (Colombia), April (Indonesia) or July (Brazil), as examples. Coffee marketing year for non-producer countries begins in October. For the United States, Canada and the EU-27, exports appear as zero in the database and the actual amount has been subtracted from imports to show net imports. Foreign Agricultural Service/USDA Office of Global Analysis June 2011
  • 8. Table 02A Green Coffee Bean Production Thousand 60-Kilogram Bags Jun 2006/07 2007/08 2008/09 2009/10 2010/11 2011/12 Production none Angola 35 30 30 30 25 25 Bolivia 152 140 135 140 135 140 Brazil 46,700 39,100 53,300 44,800 54,500 49,200 Burundi 287 209 250 300 250 275 Cameroon 835 695 650 590 615 590 Central African Republic 45 50 10 30 35 30 Colombia 12,164 12,515 8,664 8,100 9,500 10,500 Congo (Kinshasa) 280 315 300 305 285 290 Costa Rica 1,782 1,867 1,580 1,475 1,575 1,640 Cote d'Ivoire 2,447 2,098 1,853 2,350 2,100 2,300 Cuba 100 70 127 120 120 125 Dominican Republic 390 465 545 500 500 500 Ecuador 875 825 635 635 650 650 El Salvador 1,400 1,650 1,550 1,300 1,700 1,525 Ethiopia 4,036 3,906 3,650 4,000 4,400 4,500 Ghana 29 27 19 30 35 35 Guatemala 4,050 4,110 3,980 4,010 3,910 3,910 Guinea 400 250 400 495 225 450 Haiti 337 335 360 275 300 300 Honduras 3,460 3,642 3,225 3,550 4,000 4,100 India 4,665 4,660 4,375 4,850 5,100 4,800 Indonesia 7,500 7,600 9,300 10,500 9,325 7,885 Jamaica 30 35 31 29 25 30 Kenya 870 700 884 750 750 825 Laos 420 355 350 390 450 475 Liberia 53 25 7 2 1 1 Madagascar 582 555 530 475 525 550 Malawi 17 25 25 25 25 25 Malaysia 500 770 975 1,000 1,000 1,100 Mexico 4,500 4,350 4,550 4,150 3,700 3,700 Nicaragua 1,300 1,850 1,650 1,925 2,000 2,150 Nigeria 51 35 30 30 30 30 Panama 150 150 100 100 100 100 Papua New Guinea 810 970 1,035 1,085 890 1,050 Paraguay 20 28 25 25 25 25 Peru 4,400 2,800 4,000 3,300 4,000 3,800 Philippines 705 460 360 245 460 455 Rwanda 400 230 340 240 310 325 Sierra Leone 31 42 87 90 60 70 Sri Lanka 32 35 35 35 35 35 Tanzania 820 830 1,040 920 825 900 Thailand 850 900 800 900 900 900 Togo 180 255 185 450 525 550 Uganda 2,300 2,500 3,200 2,700 2,300 2,500 United States 154 151 133 107 102 100 Venezuela 862 900 900 725 690 800 Vietnam 19,500 18,000 16,980 18,500 18,725 20,600 Yemen 200 150 150 150 150 150 Zambia 56 60 39 27 10 15 Zimbabwe 45 31 22 21 10 15 Trinidad and Tobago 12 2 2 0 0 0 Total 131,819 121,753 133,403 126,781 137,908 135,046 Notes: Coffee marketing year for producer countries begins either in October (Colombia), April (Indonesia) or July (Brazil), as examples. Coffee marketing year for non-producer countries begins in October. Foreign Agricultural Service/USDA Office of Global Analysis June 2011
  • 9. Table 02B Arabica Coffee Production Thousand 60-Kilogram Bags Jun 2006/07 2007/08 2008/09 2009/10 2010/11 2011/12 Arabica Production none Bolivia 152 140 135 140 135 140 Brazil 36,000 27,650 40,500 33,000 41,800 34,700 Burundi 287 209 250 300 250 275 Cameroon 90 90 90 90 90 90 Colombia 12,164 12,515 8,664 8,100 9,500 10,500 Congo (Kinshasa) 100 115 100 105 100 100 Costa Rica 1,782 1,867 1,580 1,475 1,575 1,640 Cuba 100 70 127 120 120 125 Dominican Republic 390 465 545 500 500 500 Ecuador 500 475 360 375 400 425 El Salvador 1,400 1,650 1,550 1,300 1,700 1,525 Ethiopia 4,036 3,906 3,650 4,000 4,400 4,500 Guatemala 4,040 4,100 3,970 4,000 3,900 3,900 Haiti 337 335 360 275 300 300 Honduras 3,460 3,642 3,225 3,550 4,000 4,100 India 1,415 1,580 1,325 1,600 1,500 1,475 Indonesia 900 800 1,200 1,500 1,375 1,230 Jamaica 30 35 31 29 25 30 Kenya 870 700 884 750 750 825 Madagascar 30 30 30 25 25 25 Malawi 17 25 25 25 25 25 Mexico 4,300 4,100 4,300 3,950 3,500 3,500 Nicaragua 1,300 1,850 1,650 1,925 2,000 2,150 Panama 150 150 100 100 100 100 Papua New Guinea 780 925 1,000 1,050 850 1,000 Paraguay 20 28 25 25 25 25 Peru 4,400 2,800 4,000 3,300 4,000 3,800 Philippines 35 35 35 20 35 30 Rwanda 400 230 340 240 310 325 Sri Lanka 9 10 10 10 10 10 Tanzania 515 525 700 620 550 600 Trinidad and Tobago 1 1 1 0 0 0 Uganda 400 400 400 400 400 400 United States 154 151 133 107 102 100 Venezuela 862 900 900 725 690 800 Vietnam 500 400 480 450 575 675 Yemen 200 150 150 150 150 150 Zambia 56 60 39 27 10 15 Zimbabwe 45 31 22 21 10 15 Total 82,227 73,145 82,886 74,379 85,787 80,125 Notes: Coffee marketing year for producer countries begins either in October (Colombia), April (Indonesia) or July (Brazil), as examples. Coffee marketing year for non-producer countries begins in October. Foreign Agricultural Service/USDA Office of Global Analysis June 2011
  • 10. Table 02C Robusta Coffee Production Thousand 60-Kilogram Bags Jun 2006/07 2007/08 2008/09 2009/10 2010/11 2011/12 Robusta Production none Angola 35 30 30 30 25 25 Brazil 10,700 11,450 12,800 11,800 12,700 14,500 Cameroon 745 605 560 500 525 500 Central African Republic 45 50 10 30 35 30 Congo (Kinshasa) 180 200 200 200 185 190 Cote d'Ivoire 2,447 2,098 1,853 2,350 2,100 2,300 Ecuador 375 350 275 260 250 225 Ghana 29 27 19 30 35 35 Guatemala 10 10 10 10 10 10 Guinea 400 250 400 495 225 450 India 3,250 3,080 3,050 3,250 3,600 3,325 Indonesia 6,600 6,800 8,100 9,000 7,950 6,655 Laos 420 355 350 390 450 475 Liberia 53 25 7 2 1 1 Madagascar 552 525 500 450 500 525 Malaysia 500 770 975 1,000 1,000 1,100 Mexico 200 250 250 200 200 200 Nigeria 51 35 30 30 30 30 Papua New Guinea 30 45 35 35 40 50 Philippines 645 400 300 200 400 400 Sierra Leone 31 42 87 90 60 70 Sri Lanka 23 25 25 25 25 25 Tanzania 305 305 340 300 275 300 Thailand 850 900 800 900 900 900 Togo 180 255 185 450 525 550 Trinidad and Tobago 11 1 1 0 0 0 Uganda 1,900 2,100 2,800 2,300 1,900 2,100 Vietnam 19,000 17,600 16,500 18,050 18,150 19,925 Total 49,567 48,583 50,492 52,377 52,096 54,896 Notes: Coffee marketing year for producer countries begins either in October (Colombia), April (Indonesia) or July (Brazil), as examples. Coffee marketing year for non-producer countries begins in October. Foreign Agricultural Service/USDA Office of Global Analysis June 2011
  • 11. Table 03A Total Coffee Exports Thousand 60-Kilogram Bags Jun 2006/07 2007/08 2008/09 2009/10 2010/11 2011/12 Exports none Angola 5 4 4 8 5 5 Bolivia 104 73 73 74 75 75 Brazil 29,260 27,290 31,475 29,780 34,000 28,000 Burundi 240 300 250 290 250 270 Cameroon 790 560 480 690 550 525 Central African Republic 45 50 6 25 30 30 Colombia 11,155 11,525 8,935 7,435 9,150 9,800 Congo (Kinshasa) 78 110 117 102 95 100 Costa Rica 1,582 1,588 1,410 1,200 1,350 1,390 Cote d'Ivoire 2,075 1,870 1,555 2,005 1,850 2,000 Cuba 13 5 6 7 7 7 Dominican Republic 50 41 42 36 48 50 Ecuador 951 942 861 1,140 1,250 1,275 El Salvador 1,325 1,585 1,510 1,219 1,579 1,454 Ethiopia 2,225 2,110 1,850 2,325 2,550 2,640 Ghana 28 26 18 30 35 35 Guatemala 3,980 3,890 3,783 3,860 3,940 3,925 Guinea 390 195 375 460 200 400 Haiti 21 19 17 10 6 5 Honduras 3,370 3,440 3,050 3,200 4,000 3,925 India 3,609 3,820 3,120 4,110 4,100 3,750 Indonesia 6,400 6,110 7,700 8,750 8,250 6,350 Jamaica 20 30 26 24 20 25 Kenya 870 820 980 740 750 800 Laos 280 225 250 290 350 375 Liberia 49 25 7 2 1 1 Madagascar 200 165 115 40 85 100 Malawi 17 25 25 24 24 24 Malaysia 1,171 1,422 1,619 1,980 1,870 1,920 Mexico 2,865 2,610 2,735 2,480 2,150 2,125 Nicaragua 1,310 1,745 1,585 1,806 1,925 2,050 Nigeria 9 1 1 3 2 2 Panama 95 96 45 53 50 50 Papua New Guinea 820 900 1,070 1,040 875 1,000 Paraguay 10 10 5 5 5 5 Peru 4,200 2,660 3,830 3,150 3,825 3,650 Philippines 1 0 0 0 0 0 Rwanda 400 230 340 240 310 325 Sierra Leone 30 25 70 70 40 50 Tanzania 745 730 880 875 705 800 Thailand 925 775 644 684 807 760 Togo 200 250 185 440 525 550 Uganda 1,840 2,160 2,770 2,290 1,900 2,100 Venezuela 120 160 0 0 0 0 Vietnam 18,840 15,735 15,565 18,670 17,875 19,350 Yemen 30 40 35 30 25 25 Zambia 55 59 39 27 10 15 Zimbabwe 41 27 18 17 6 10 Total 102,839 96,479 99,476 101,736 107,455 102,123 Notes: A conversion factor of 2.6 was used to convert soluble coffee to the green bean equivalent. Coffee marketing year for producer countries begins either in October (Colombia), April (Indonesia) or July (Brazil), as examples. Coffee marketing year for non-producer countries begins in October. For the United States, Canada and the EU-27, exports appear as zero in the database and the actual amount has been subtracted from imports to show net imports. Foreign Agricultural Service/USDA Office of Global Analysis June 2011
  • 12. Table 03B Green Coffee Bean Exports Thousand 60-Kilogram Bags Jun 2006/07 2007/08 2008/09 2009/10 2010/11 2011/12 Bean Exports none Angola 5 4 4 8 5 5 Bolivia 104 73 73 74 75 75 Brazil 26,185 23,770 28,396 26,580 30,630 24,930 Burundi 240 300 250 290 250 270 Cameroon 790 560 480 690 550 525 Central African Republic 45 50 6 25 30 30 Colombia 10,460 10,770 8,160 6,445 8,400 9,000 Congo (Kinshasa) 78 110 117 102 95 100 Costa Rica 1,582 1,588 1,410 1,200 1,350 1,390 Cote d'Ivoire 1,710 1,550 1,180 1,755 1,550 1,700 Cuba 13 5 6 7 7 7 Dominican Republic 50 41 42 36 48 50 Ecuador 300 180 179 450 425 425 El Salvador 1,320 1,580 1,506 1,215 1,575 1,450 Ethiopia 2,225 2,110 1,850 2,325 2,550 2,640 Ghana 28 26 18 30 35 35 Guatemala 3,980 3,890 3,783 3,860 3,940 3,925 Guinea 390 195 375 460 200 400 Haiti 21 19 17 10 6 5 Honduras 3,370 3,440 3,050 3,200 4,000 3,925 India 2,550 2,620 2,120 2,760 2,775 2,500 Indonesia 6,000 5,510 6,625 7,425 7,050 5,150 Jamaica 20 30 26 24 20 25 Kenya 870 820 980 740 750 800 Laos 280 225 250 290 350 375 Liberia 49 25 7 2 1 1 Madagascar 200 165 115 40 85 100 Malawi 17 25 25 24 24 24 Malaysia 21 12 19 16 20 20 Mexico 2,260 1,910 2,125 1,790 1,500 1,400 Nicaragua 1,160 1,580 1,425 1,650 1,850 1,900 Nigeria 9 1 1 3 2 2 Panama 95 96 45 53 50 50 Papua New Guinea 820 900 1,070 1,040 875 1,000 Paraguay 10 10 5 5 5 5 Peru 4,200 2,660 3,830 3,150 3,825 3,650 Rwanda 400 230 340 240 310 325 Sierra Leone 30 25 70 70 40 50 Tanzania 735 720 875 870 700 800 Thailand 200 25 4 4 10 25 Togo 200 250 185 440 525 550 Uganda 1,840 2,160 2,770 2,290 1,900 2,100 Venezuela 85 120 0 0 0 0 Vietnam 18,740 15,600 15,430 18,425 17,550 19,000 Yemen 30 40 35 30 25 25 Zambia 55 59 39 27 10 15 Zimbabwe 41 27 18 17 6 10 Total 93,814 86,106 89,336 90,187 95,979 90,789 Notes: Coffee marketing year for producer countries begins either in October (Colombia), April (Indonesia) or July (Brazil), as examples. Coffee marketing year for non-producer countries begins in October. For the United States, Canada and the EU-27, exports appear as zero in the database and the actual amount has been subtracted from imports to show net imports. Foreign Agricultural Service/USDA Office of Global Analysis June 2011
  • 13. Table 03C Soluble Coffee Exports Thousand 60-Kilogram Bags Jun 2006/07 2007/08 2008/09 2009/10 2010/11 2011/12 Soluble Exports none Brazil 3,020 3,395 2,991 3,120 3,300 3,000 Colombia 680 720 725 925 700 750 Cote d'Ivoire 365 320 375 250 300 300 Ecuador 650 760 680 680 825 850 El Salvador 2 2 2 2 2 2 India 1,059 1,200 1,000 1,350 1,325 1,250 Indonesia 400 600 1,075 1,325 1,200 1,200 Malaysia 1,150 1,410 1,600 1,964 1,850 1,900 Mexico 605 700 610 690 650 725 Nicaragua 150 165 160 156 75 150 Tanzania 10 10 5 5 5 0 Thailand 725 750 640 680 797 735 Vietnam 75 115 110 195 275 300 Total 8,891 10,147 9,973 11,342 11,304 11,162 Notes: A conversion factor of 2.6 was used to convert soluble coffee to the green bean equivalent. Coffee marketing year for producer countries begins either in October (Colombia), April (Indonesia) or July (Brazil), as examples. Coffee marketing year for non-producer countries begins in October. For the United States, Canada and the EU-27, exports appear as zero in the database and the actual amount has been subtracted from imports to show net imports. Foreign Agricultural Service/USDA Office of Global Analysis June 2011
  • 14. Table 04A Total Coffee Imports Thousand 60-Kilogram Bags Jun 2006/07 2007/08 2008/09 2009/10 2010/11 2011/12 Imports none Algeria 1,825 2,025 2,045 2,060 2,050 2,025 Argentina 510 490 480 500 515 525 Australia 900 920 950 1,040 1,075 1,100 Canada 1,950 1,960 1,940 2,010 2,300 2,100 China 300 300 320 425 575 675 Colombia 215 142 695 610 790 600 Croatia 330 325 300 300 300 300 Cuba 210 230 240 220 225 225 Ecuador 222 274 389 732 763 817 El Salvador 117 96 167 136 137 142 EU-27 46,530 45,760 45,365 46,405 47,075 45,600 Guatemala 175 193 223 225 230 230 Honduras 12 14 18 18 23 15 India 334 490 555 725 550 500 Indonesia 820 100 120 425 150 200 Japan 7,025 6,860 7,115 6,835 7,650 6,825 Korea, South 1,400 1,550 1,680 1,705 2,000 1,900 Malaysia 1,156 1,200 1,135 1,480 1,420 1,370 Mexico 49 171 114 245 420 370 Morocco 560 570 600 580 510 500 Norway 650 590 610 580 725 600 Philippines 600 915 1,340 1,920 1,850 1,850 Russia 4,410 4,520 3,455 4,075 4,100 3,975 Serbia 590 590 590 525 500 500 South Africa 430 410 330 400 385 400 Switzerland 1,490 1,710 1,800 1,950 2,200 2,000 Thailand 546 530 400 545 675 600 Turkey 230 230 260 275 350 300 United States 23,670 23,475 23,400 22,205 24,400 23,750 Venezuela 96 77 85 205 335 350 Vietnam 115 88 95 75 105 150 Total 97,470 96,809 96,831 99,581 104,473 100,574 Notes: A conversion factor of 2.6 was used to convert soluble coffee to the green bean equivalent. Coffee marketing year for producer countries begins either in October (Colombia), April (Indonesia) or July (Brazil), as examples. Coffee marketing year for non-producer countries begins in October. For the United States, Canada and the EU-27, exports appear as zero in the database and the actual amount has been subtracted from imports to show net imports. Foreign Agricultural Service/USDA Office of Global Analysis June 2011
  • 15. Table 04B Green Coffee Bean Imports Thousand 60-Kilogram Bags Jun 2006/07 2007/08 2008/09 2009/10 2010/11 2011/12 Bean Imports none Algeria 1,825 2,025 2,045 2,060 2,050 2,025 Argentina 510 490 480 500 515 525 Australia 900 920 950 1,040 1,075 1,100 Canada 1,950 1,960 1,940 2,010 2,300 2,100 China 300 300 320 425 575 675 Colombia 190 110 650 570 750 560 Croatia 330 325 300 300 300 300 EU-27 44,370 43,550 43,350 44,280 45,000 43,500 Ecuador 130 210 310 650 700 750 El Salvador 31 1 3 0 0 0 India 334 490 555 725 550 500 Indonesia 820 100 120 425 150 200 Japan 6,200 6,150 6,375 6,160 7,000 6,200 Korea, South 1,400 1,550 1,680 1,705 2,000 1,900 Malaysia 730 660 650 960 850 850 Mexico 21 1 4 90 250 200 Morocco 560 570 600 580 510 500 Norway 650 590 610 580 725 600 Philippines 225 390 405 420 450 400 Russia 960 970 1,240 1,430 1,450 1,475 Serbia 590 590 590 525 500 500 South Africa 430 410 330 400 385 400 Switzerland 1,490 1,710 1,800 1,950 2,200 2,000 Thailand 6 200 130 205 225 200 Turkey 230 230 260 275 350 300 United States 22,110 21,775 21,660 20,250 22,500 21,800 Vietnam 79 65 70 50 80 125 Total 87,424 86,396 87,502 88,870 93,850 90,075 Notes: Coffee marketing year for producer countries begins either in October (Colombia), April (Indonesia) or July (Brazil), as examples. Coffee marketing year for non-producer countries begins in October. Imports for the United States, Canada and the EU-27 are net imports after subtracting exports. Foreign Agricultural Service/USDA Office of Global Analysis June 2011
  • 16. Table 04C Soluble Coffee Imports Thousand 60-Kilogram Bags Jun 2006/07 2007/08 2008/09 2009/10 2010/11 2011/12 Soluble Imports none Ecuador 91 64 77 79 60 65 El Salvador 72 80 150 125 125 130 EU-27 2,160 2,210 2,015 2,125 2,075 2,100 Guatemala 125 140 160 165 170 170 Honduras 6 7 10 10 15 15 Japan 825 710 740 675 650 625 Malaysia 406 520 465 500 550 500 Mexico 0 150 95 135 150 150 Philippines 375 525 935 1,500 1,400 1,450 Russia 3,450 3,550 2,215 2,645 2,650 2,500 United States 1,560 1,700 1,740 1,955 1,900 1,950 Vietnam 35 22 25 25 25 25 Total 9,737 10,081 8,982 10,389 10,295 10,180 Notes: A conversion factor of 2.6 was used to convert soluble coffee to the green bean equivalent. Coffee marketing year for producer countries begins either in October (Colombia), April (Indonesia) or July (Brazil), as examples. Coffee marketing year for non-producer countries begins in October. For the United States, Canada and the EU-27, exports appear as zero in the database and the actual amount has been subtracted from imports to show net imports. Foreign Agricultural Service/USDA Office of Global Analysis June 2011